


")


")


 Unemployment")


 economics
Similar presentations:


Macroeconomics. GDP /Business Cycle. Unemployment
1. Macroeconomics GDP /Business Cycle Unemployment
MACROECONOMICSGDP /BUSINESS CYCLE
UNEMPLOYMENT
Zharova Liubov
2. Example
EXAMPLEIn 1966, Howard Hughes was forced to sell TWA
(trans world airlines) and received a single check
for US$650 million. How much is that in 2004
dollars?
The GDP deflator in USA in 1966 was 22.855.
The deflator in 2004 was 107.958.
In 2004 dollars this is
P2004
107.958
650
650
3044.63294
P1966
22.855
3. Trends and cycles
TRENDS AND CYCLESWe observe that real GDP is growing over time
but at a non-constant rate.
We call the growth path, if the economy were
always growing at its average rate, the trend
path.
Fluctuations around the trend are called
business cycles.
4. Business Cycle term
BUSINESS CYCLE TERMAs the economy fluctuates around the trend, the economy
is experiencing business cycles.
When economy is moving from a peak level to trough level,
the economy is in a contractionary phase.
When economy is moving from trough to peak, the economy
is in an expansionary phase.
When economy is moving from peak to trough the economy
is in a contractionary phase
5.
The correlation of business cycles implies that groups of countries are in thesame phase for stretches of time. An example of this can be seen in the
figure, which shows the annual gross domestic product (GDP) growth rates
in the United States, Canada and Mexico from 1981 through 2014. Notice
that U.S. and Canadian data moved similarly over the past 30 or so years.
In the past decade, the Mexican economy also fell into sync: The correlation
between U.S. and Mexico increased by over 100 percent.
6. North American Free Trade Agreement (NAFTA)
NORTH AMERICAN FREE TRADEAGREEMENT (NAFTA)
It is a piece of regulation implemented January 1, 1994
simultaneously in Mexico, Canada and the United States
that eliminates most tariffs on trade between these
nations.
The essence of a free trade measure, NAFTA’s purpose is to
encourage economic activity between the three major
economic powers of North America.
NAFTA has two supplements: the North American
Agreement on Environmental Cooperation (NAAEC) and
the North American Agreement on Labor Cooperation
(NAALC).
About 1/4 of all U.S. imports (especially crude oil,
machinery, gold, vehicles, fresh produce, livestock and
processed foods) comes from Canada and Mexico, which are
the United States’ second- and third-largest suppliers of
imported goods. In addition, about one-third of U.S.
exports, particularly machinery, vehicle parts, mineral
fuel/oil and plastics are destined for Canada and Mexico.
7.
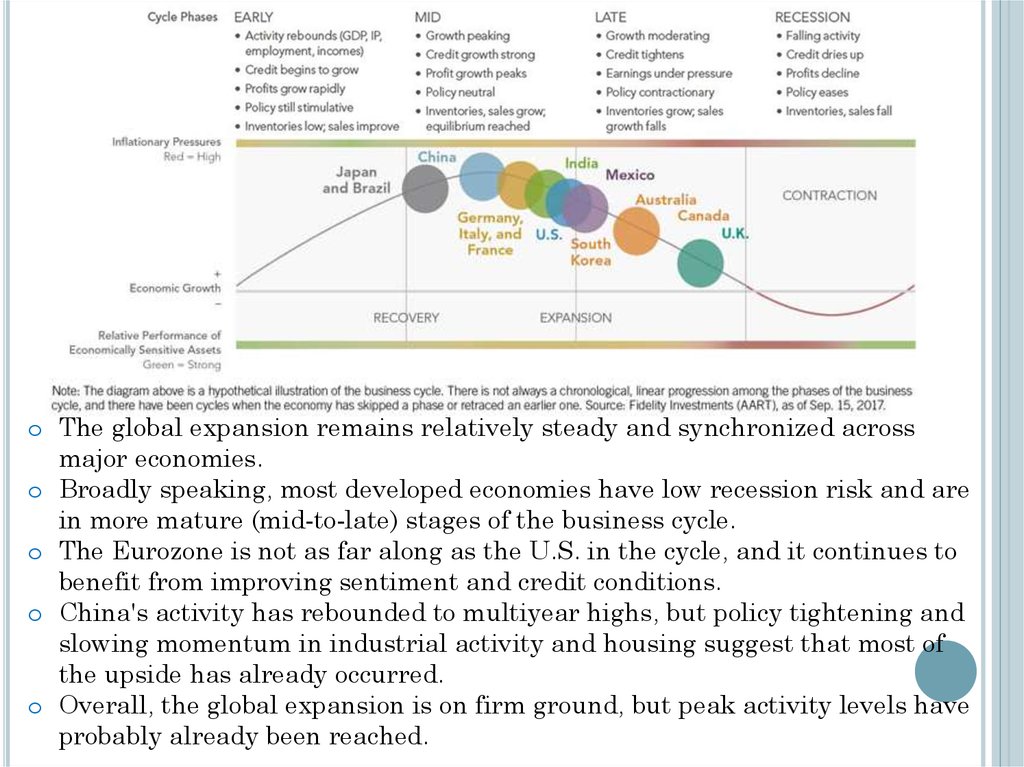
o The global expansion remains relatively steady and synchronized acrossmajor economies.
o Broadly speaking, most developed economies have low recession risk and are
in more mature (mid-to-late) stages of the business cycle.
o The Eurozone is not as far along as the U.S. in the cycle, and it continues to
benefit from improving sentiment and credit conditions.
o China's activity has rebounded to multiyear highs, but policy tightening and
slowing momentum in industrial activity and housing suggest that most of
the upside has already occurred.
o Overall, the global expansion is on firm ground, but peak activity levels have
probably already been reached.
8. Recession and booms
RECESSION AND BOOMSBusiness cycle positions are sometimes
characterized as booms and recessions.
These names have many definitions
a boom occurs roughly when real output is above the
trend growth path (detrended output is positive).
A recession occurs roughly when real output is
below trend growth.
In the USA, recessions are sometimes defined as 2
consecutive periods of negative growth.
9. Hong Kong Business Cycle
HONG KONG BUSINESS CYCLEHong Kong Business Cycle
0.06
0.02
-0.04
-0.06
-0.08
20
02
20
00
19
98
19
96
19
94
19
92
19
90
19
88
19
86
19
84
19
82
-0.02
19
80
0
19
78
% Difference from Trend
0.04
10. Business Cycles & Co-movement
BUSINESS CYCLES & CO-MOVEMENTBusiness cycles are fluctuations in the economy
as a whole.
Different sub-categories of GDP tend to co-move
with business cycles though to different degree.
Business cycles tend to co-move across countries
though not as strongly as within countries.
11. Business Cycles & Sub-Categories
BUSINESS CYCLES & SUB-CATEGORIESExpenditure. Consumption and Investment comove with output. Investment is more volatile
than consumption. Consumer durables are most
volatile part of consumption.
Production – Production sectors co-move with
business cycles. Manufacturing & Construction
most volatile. Services least volatile.
Income – Worker Compensation & Capital
Income are both pro-cyclical. Capital Income
tends to be more volatile.
12. Hong Kong Expenditure Cycle
HONG KONG EXPENDITURE CYCLE.20
.15
.10
.05
.00
-.05
-.10
-.15
1975
1980
1985
1990
1995
GDP
Household Consumption
Fixed Investment
2000
13. Corporate Profits
CORPORATE PROFITSCorporate profits are strongly pro-cyclical and
volatile.
When the economy is doing well, corporations
tend to earn high real profits.
Corporate profits fluctuate far more than the
economy as a whole
.4
% Deviation from Trend
.3
.2
.1
.0
-.1
-.2
-.3
-.4
HK Corporate
Earnings & the
Business Cycle
-.5
86
88
90
92
94
96
Real Corporate Earnings
98
00
Real GDP
02
14. Using financial market data to predict business cycles
USING FINANCIAL MARKET DATA TOPREDICT BUSINESS CYCLES
It
has been joked that stock markets have
predicted 7 out of the last 5 recession.
(In fact there does seem to be a moderately strong,
positive correlation between cyclical variation in
stock prices and business cycles)
In
the USA, some financial market indicators
have been shown to predict business cycles.
Default Spread : Interest rates on lower rated bonds
vs. Interest rates on better rated bonds.
Term Spread: Interest rates on long-term bonds vs.
short-term bonds (when this is inverted, recession is
likely)
15.
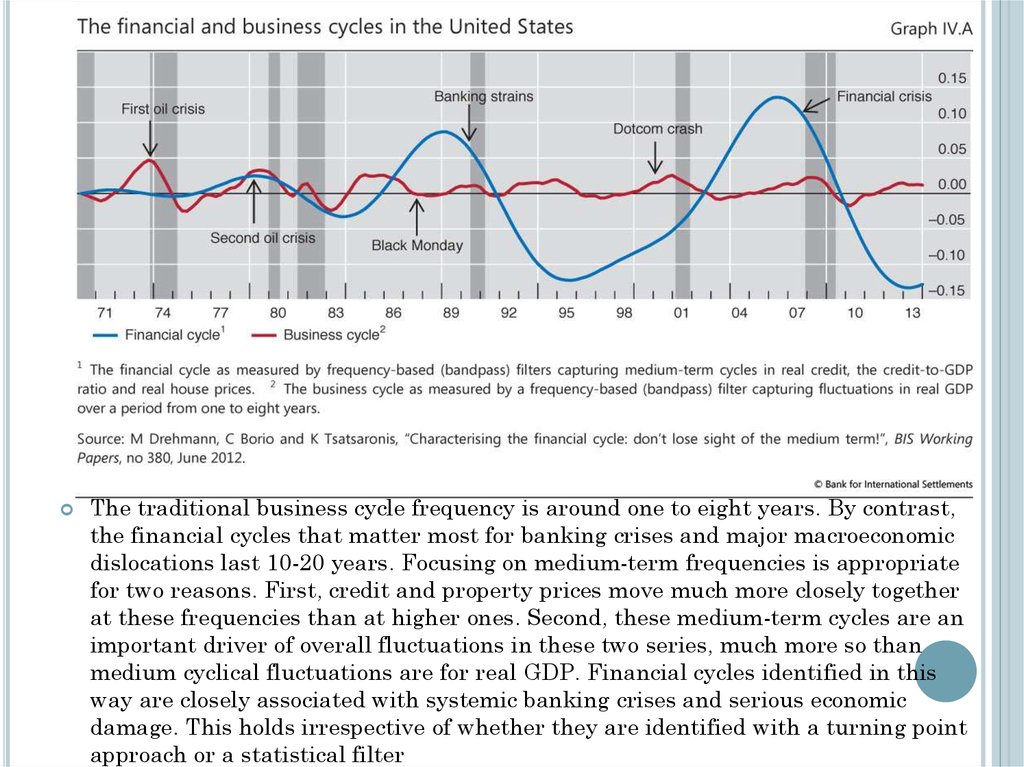
The traditional business cycle frequency is around one to eight years. By contrast,the financial cycles that matter most for banking crises and major macroeconomic
dislocations last 10-20 years. Focusing on medium-term frequencies is appropriate
for two reasons. First, credit and property prices move much more closely together
at these frequencies than at higher ones. Second, these medium-term cycles are an
important driver of overall fluctuations in these two series, much more so than
medium cyclical fluctuations are for real GDP. Financial cycles identified in this
way are closely associated with systemic banking crises and serious economic
damage. This holds irrespective of whether they are identified with a turning point
approach or a statistical filter
16.
17. Level of Unemployment (HK)
LEVEL OF UNEMPLOYMENT (HK)18. Unemployment
UNEMPLOYMENTIs defined by the International Labor
Organization (ILO) as a situation in which people
are without jobs and they have actively looked for
a job for the past four weeks.
According to this definition, people who do not
look for a job will not be considered unemployed.
Productive population
In the labor force
Employed
Not in the labor force
Unemployed
19. Unemployment
UNEMPLOYMENTThe population resides in 1 of 3 categories
1. Employed: Currently working
2. Not in the Labor Force: Not working and not
actively seeking work
3. Unemployed: Not working but seeking work
Unemployment Rate (U-3 rate)