




Similar presentations:







Information System Project – QataRetail – Smart Retail Management System
1.
QATARETAIL – SMART RETAILMANAGEMENT SYSTEM
Information Systems Management Project
Prepared by:
Mohammad Noman – 60098291
Nour Hussein – 60099846
Shouq Al-sheeb – 60088665
Yasmin Molazehi – 60101797
Instructor:
Dr. Tewfik Ziadi
Date:
02 April 2026
2.
Executive SummaryThis project presents the design of an Information System for QataRetail, a retail company
operating across both physical stores and online platforms. The primary objective of the system
is to enhance operational efficiency, improve customer experience, and support data-driven
decision-making.
The report covers requirements analysis, technology selection, ERP and CRM functionalities,
system design, business process modeling, and business intelligence. The proposed solution is
based on Odoo ERP, supported by CRM features and cloud infrastructure to ensure scalability,
security, and cost efficiency.
The system is designed to manage customers, inventory, suppliers, and sales operations while
providing valuable insights through key performance indicators and dashboards.
1. Introduction
QataRetail is a retail company that operates in both physical and online environments. To remain
competitive and improve its operations, the company requires a centralized Information System
that supports its core business functions.
The proposed system focuses on managing customer information, inventory, suppliers, and sales
processes while supporting decision-making through business intelligence tools. It aims to
provide a seamless experience across all channels and improve coordination between different
business units.
To achieve this, the system is designed using ERP and CRM functionalities within a scalable and
secure architecture.
2. Requirements Analysis
2.1 Business Requirements
QataRetail seeks an Information System to support its main business operations, including
managing customers, tracking inventory, and selling online. The system aims to increase
efficiency, coordinate online and offline channels more effectively, and provide analytical
insights to enable informed decision-making.
3.
The system should enable the company to deliver a smooth customer experience while allowingmanagers to monitor business performance, analyze customer behavior, and product availability.
2.2 Functional Requirements
The system must support several key functionalities:
Customers should be able to create accounts and manage their profiles.
The system should track customer purchases and preferences.
Inventory levels must be monitored across warehouses and retail locations.
Managers should be able to view inventory and receive restocking alerts.
The system should manage suppliers and allow the creation of purchase orders.
Loyalty programs and promotional activities should be supported.
The system should generate reports on customer activity and sales performance.
2.3 Non-Functional Requirements
In addition to functional capabilities, the system must meet the following non-functional
requirements:
Ensure data security and protect customer privacy.
Support scalability to handle increased demand.
Provide fast response times for users.
Maintain high system availability.
Be accessible through both web and mobile platforms.
2.4 Stakeholders
The system involves multiple stakeholders who interact with it in different ways:
Customers use the system to browse products, place orders, and participate in loyalty
programs.
Store Managers monitor inventory, analyze sales reports, and manage stock levels.
Warehouse Staff update inventory records and manage stock movements.
Suppliers handle restocking through purchase orders.
System Administrators ensure the system operates efficiently and securely.
4.
3. Technology Proposal3.1 Proposed Technologies
To meet the identified requirements, a set of technologies is proposed to ensure system
efficiency, scalability, and security.
Cloud-based infrastructure is recommended to host the system, as it allows flexible scaling and
ensures high availability based on demand.
Odoo ERP is selected as the main platform due to its support for inventory, sales, and customer
management. As an open-source solution, it reduces operational costs while providing essential
business functionality.
Security measures such as authentication and data encryption are also considered to protect
sensitive information and ensure secure access.
3.2 Architecture Benefits
Scalability: Cloud infrastructure allows the system to grow with the business, handling
increased user activity and sales without requiring major changes.
Security: Authentication and encryption help protect customer and business data from
unauthorized access.
Cost Efficiency: Using Odoo as an open-source ERP reduces licensing costs while still
providing comprehensive functionality.
4. ERP and CRM Integration
4.1 Odoo ERP Capabilities
Odoo supports key business operations by managing customer data, inventory, and sales
processes. It provides automatic alerts for low stock levels and generates reports for decisionmaking.
5.
4.2 Salesforce CRM CapabilitiesSalesforce focuses on customer relationship management by storing customer data, tracking sales
activities, and supporting marketing automation. It also provides insights into customer behavior.
4.3 Business Requirement Alignment
Both Odoo and Salesforce align with the system’s requirements. Odoo supports inventory and
sales management, while Salesforce enhances customer relationship management and marketing
capabilities. Together, they ensure that business processes are effectively supported.
4.4 ERP and CRM Comparison
To better evaluate ERP and CRM capabilities, the following comparison highlights the strengths
of Odoo and Salesforce in supporting different business functions.
Feature
Odoo
Salesforce
Customer Management
Yes
Yes
Inventory Management
Strong
Limited
Sales Management
Yes
Yes
Marketing Automation
Moderate
Strong
ERP Integration
Strong
Limited
4.5 ERP & CRM Workflow
The system integrates ERP and CRM functionalities to support the customer purchasing process.
Customers create accounts, and their data is stored in the CRM system.
Products are browsed and purchased through the system.
Inventory is automatically updated after each order.
Warehouse staff process and deliver orders.
Customer activity is recorded for analysis and reporting.
6.
5. System Design5.1 Data Models
The system includes several key data models:
Customer Model: Stores customer information, preferences, and purchase history.
Attributes of the Customer Model:
• Customer ID (Primary Key)
• Name
• Preferences
• Purchase History
• Loyalty Points
Product Model: Represents products with details such as category and price.
Attributes of the Product Model:
• Product ID (Primary Key)
• Product Name
• Category
• Details
• Price
• Supplier ID (Foreign Key)
Inventory Model: Tracks stock levels across locations.
Attributes of the Inventory Model:
• Inventory ID (Primary Key)
• Product ID (Foreign Key)
• Quantity
Order Model: Records customer purchases and transaction details.
Attributes of the Order Model:
• Order ID (Primary Key)
• Customer ID (Foreign Key)
7.
Order Date
Total Cost
Order Status
Supplier Model: Manages supplier information and restocking processes.
Attributes of the Supplier Model:
• Supplier ID (Primary Key)
• Supplier Name
• Phone Number
• Delivery Time
5.2 Data Models and Business Operations
The data models in the QataRetail system play an important role in supporting business
operations and ensuring efficient data management.
The Customer model allows the system to store and manage customer information, including
preferences and purchase history. This enables personalized services and improves customer
experience.
The Product and Inventory models work together to maintain accurate stock levels across both
online and physical stores. These models support product management, inventory tracking, and
restocking processes.
The Order model connects customers with the products they purchase and records all
transactions within the system. This helps track sales performance and supports reporting and
decision-making.
The Supplier model manages supplier-related information and supports restocking activities. It
ensures effective communication with suppliers and helps maintain product availability through
timely delivery.
8.
6. Business Processes and BPMN6.1 Customer Purchase Process
The customer purchase process begins when a customer logs into the system or creates an
account. The customer browses available products and selects items to purchase.
Once the order is placed, the system checks product availability. If the product is in stock, the
system proceeds with payment processing. After successful payment, the inventory is updated,
and the warehouse prepares and delivers the order to the customer.
If the product is unavailable or the payment fails, the customer is notified and the process ends.
Figure 1: Customer Purchase Process BPMN Diagram
This diagram illustrates the sequence of activities and decision points involved in processing a
customer order.
6.2 Inventory Restocking Process
The inventory restocking process starts when the system detects that stock levels have fallen
below a predefined threshold.
The manager reviews the inventory status and decides whether restocking is required. If
approved, a purchase order is created and sent to the supplier. Once the products are received,
the system updates the inventory accordingly.
9.
This process ensures that stock levels are maintained and product availability is not affected.Figure 2: Inventory Restocking Process BPMN Diagram
This diagram shows how the system monitors stock levels and manages restocking when
inventory is low.
6.3 Loyalty Program Process
The loyalty program process begins when a customer completes a purchase. The system
calculates the total cost and updates the customer’s loyalty points accordingly.
These points are stored in the customer’s account and can be redeemed later for rewards. The
system checks eligibility and deducts points when rewards are issued.
This process encourages repeat purchases and improves customer engagement.
Figure 3: Loyalty Program Process BPMN Diagram
10.
This diagram represents how loyalty points are calculated, stored, and redeemed within thesystem.
6.4 Customer Management Process
The customer management process begins when a customer registers and creates an account in
the system. The customer’s information is stored in the CRM module.
As the customer interacts with the system, their purchase history is recorded and updated. This
data is used to generate reports on customer activity.
Managers analyze this information to understand customer behavior and support better decisionmaking.
Figure 4: Customer Management Process BPMN Diagram
This diagram illustrates how customer data is collected, stored, and analyzed within the system
to support decision-making.
11.
7. Business Intelligence7.1 Business Intelligence Overview
To support data-driven decision-making, a business intelligence framework was designed using
key performance indicators (KPIs). These KPIs measure performance across key areas such as
sales, inventory, and customer activity. By analyzing these metrics, managers can monitor
business performance, identify trends, and make informed strategic decisions.
7.2 Sales KPIs
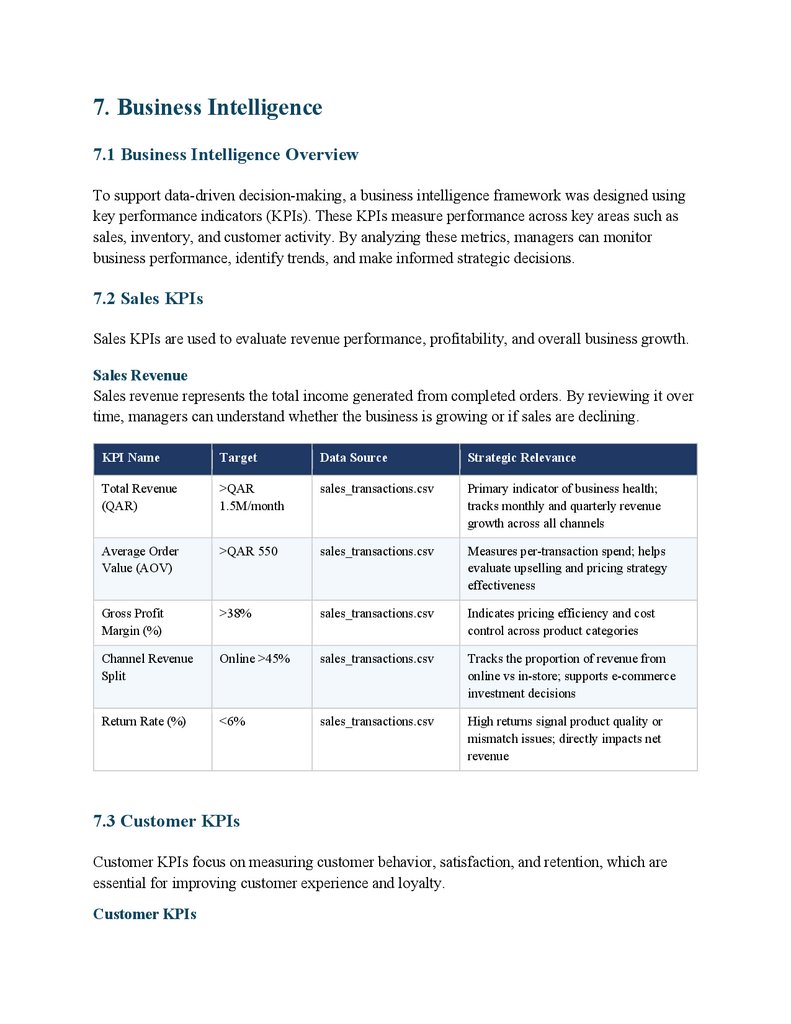
Sales KPIs are used to evaluate revenue performance, profitability, and overall business growth.
Sales Revenue
Sales revenue represents the total income generated from completed orders. By reviewing it over
time, managers can understand whether the business is growing or if sales are declining.
KPI Name
Target
Data Source
Strategic Relevance
Total Revenue
(QAR)
>QAR
1.5M/month
sales_transactions.csv
Primary indicator of business health;
tracks monthly and quarterly revenue
growth across all channels
Average Order
Value (AOV)
>QAR 550
sales_transactions.csv
Measures per-transaction spend; helps
evaluate upselling and pricing strategy
effectiveness
Gross Profit
Margin (%)
>38%
sales_transactions.csv
Indicates pricing efficiency and cost
control across product categories
Channel Revenue
Split
Online >45%
sales_transactions.csv
Tracks the proportion of revenue from
online vs in-store; supports e-commerce
investment decisions
Return Rate (%)
<6%
sales_transactions.csv
High returns signal product quality or
mismatch issues; directly impacts net
revenue
7.3 Customer KPIs
Customer KPIs focus on measuring customer behavior, satisfaction, and retention, which are
essential for improving customer experience and loyalty.
Customer KPIs
12.
KPI NameTarget
Data Source
Strategic Relevance
Customer Retention
Rate (%)
>75%
customers.csv + sales
Measures the ability to retain
existing customers; lower churn
means higher lifetime value
New Customer
Acquisition
>80/month
customers.csv
Tracks growth in customer base;
essential for market share expansion
Customer Satisfaction
Score (CSAT)
>4.2 / 5.0
kpi_summary.csv
Reflects overall service quality and
customer experience across all
touchpoints
Net Promoter Score
(NPS)
>50
kpi_summary.csv
Gauges customer loyalty and wordof-mouth potential; critical for
brand growth in Qatar's social
market
Loyalty Program
Engagement (%)
>60%
customers.csv
Measures active participation in
loyalty schemes; drives repeat
purchases
7.4 Inventory and Supply Chain KPIs
Inventory and supply chain KPIs help monitor stock availability, supplier performance, and
operational efficiency.
Inventory & Supply Chain KPIs
KPI Name
Target
Data Source
Strategic Relevance
Inventory Turnover
Ratio
>5x / year
inventory_log.csv
Measures how quickly stock is sold and
replenished; low turnover signals
overstocking
Stockout Rate (%)
<4%
inventory_log.csv
Tracks product unavailability events;
stockouts directly reduce revenue and
customer satisfaction
Supplier Reliability
Score
>90%
suppliers.csv
Evaluates vendor on-time delivery and
quality; critical for maintaining supply
continuity
Average Lead Time
(days)
<12 days
suppliers.csv
Shorter lead times improve responsiveness to
demand; impacts inventory planning
13.
7.5 Marketing and E-commerce KPIsMarketing KPIs evaluate campaign effectiveness, customer engagement, and conversion
performance.
Marketing & E-commerce KPIs
KPI Name
Target
Data Source
Strategic Relevance
Campaign ROI (%)
>250%
marketing_campaigns.csv
Measures the financial return on
marketing investment; identifies
highest-performing channels
Campaign Conversion
Rate (%)
>20%
marketing_campaigns.csv
Tracks the percentage of reached
customers who make a purchase;
measures campaign effectiveness
Website Conversion
Rate (%)
>5%
kpi_summary.csv
Measures the percentage of site visitors
that complete a purchase; key for ecommerce optimization
7.6 Data Visualizations for Decision-Making
To make the KPIs easier to interpret, dashboards and visualizations are used to present the data
in a clear and structured way. These dashboards allow different users, such as managers and
executives, to quickly understand system performance and identify areas for improvement.
Dashboard
Primary User
Key Visualizations
Executive Overview
C-Suite / Management
Revenue trend, gross margin, NPS, top categories,
YoY comparison
Sales & Channel Analysis
Sales Manager
Revenue by channel, AOV trend, discount impact,
top products, return rate
Customer & Loyalty
CRM / Marketing
Segment breakdown, retention funnel, loyalty tier
distribution, city map
14.
Inventory & Supply ChainOperations
Stockout heatmap, turnover by category, supplier
reliability, lead time
7.7 Visualization Types and Rationale
Dashboard 1: Executive Overview
Line Chart — Monthly Revenue Trend (2023 vs 2024): Displays month-by-month
revenue across two years, enabling management to identify seasonal peaks, growth
periods, and year-over-year performance for strategic forecasting.
Card Visuals — Total Revenue, Total Orders, AOV, Total Customers: Provides instant
at-a-glance KPI status for board-level reporting without requiring deep analysis.
Donut Chart — Revenue by Category: Visualizes the proportional contribution of each
product category to total revenue, supporting procurement and inventory investment
decisions.
Dashboard 2: Sales & Channel Analysis
Bar Chart — Revenue by Category: Compares absolute revenue performance across all
five product categories, identifying top-performing and underperforming segments for
resource allocation.
Bar Chart — Campaign ROI (%): Ranks all marketing campaigns by return on
investment, enabling the marketing team to identify the most cost-effective campaigns
and replicate their success.
Table — Campaign Performance Details: Presents a comprehensive breakdown of each
campaign's budget, revenue generated, conversion rate, and ROI in a single view,
supporting detailed marketing review and planning.
Dashboard 3: Customer & Loyalty
15.
Donut Chart — Customer Segments: Shows the proportional split between Premium,
Regular, and Occasional customers, helping identify which segments drive the most
value and where retention efforts should be focused.
Donut Chart — Loyalty Tier Distribution: Visualizes the spread of customers across
Bronze, Silver, Gold, and Platinum tiers, tracking loyalty program effectiveness and
identifying opportunities to move customers up the tier ladder.
Bar Chart — Customers by City: Maps customer concentration across Qatar’s cities,
supporting location-based marketing campaigns and decisions related to store placement
or delivery expansion.
Line Chart — Online Sales Share (%): Tracks the monthly shift toward online
purchasing, measuring the progress of QataRetail’s digital transformation over time.
Dashboard 4: Inventory & Supply Chain
Bar Chart — Inventory Turnover by Category: Compares how quickly each product
category sells through its stock, highlighting slow-moving categories that risk
overstocking and fast-moving ones that require frequent replenishment.
Donut Chart — Suppliers by Country: Visualizes the geographic distribution of suppliers,
helping assess supply chain risk and dependency on specific regions.
Clustered Bar Chart — KPI vs Target: Directly compares actual performance against
target values across key supply chain metrics, making it clear where improvements are
needed.
7.8 Suggested Tools for Dashboard Creation
Several tools can be used to create and implement dashboards for the QataRetail system:
Tableau: Used for creating interactive and visually clear dashboards.
Microsoft Power BI: Supports real-time data analysis and integration with databases.
Odoo Built-in Reports: Provides reporting capabilities directly within the ERP system.
16.
8. ConclusionThe proposed Information System for QataRetail provides an effective solution for managing
retail operations across both physical and online platforms. It supports key functions such as
customer management, inventory tracking, and order processing while improving overall
efficiency.
The use of ERP and CRM functionalities, along with well-defined workflows and business
intelligence tools, enables better decision-making and enhances customer experience.