


 psychology
Similar presentations:


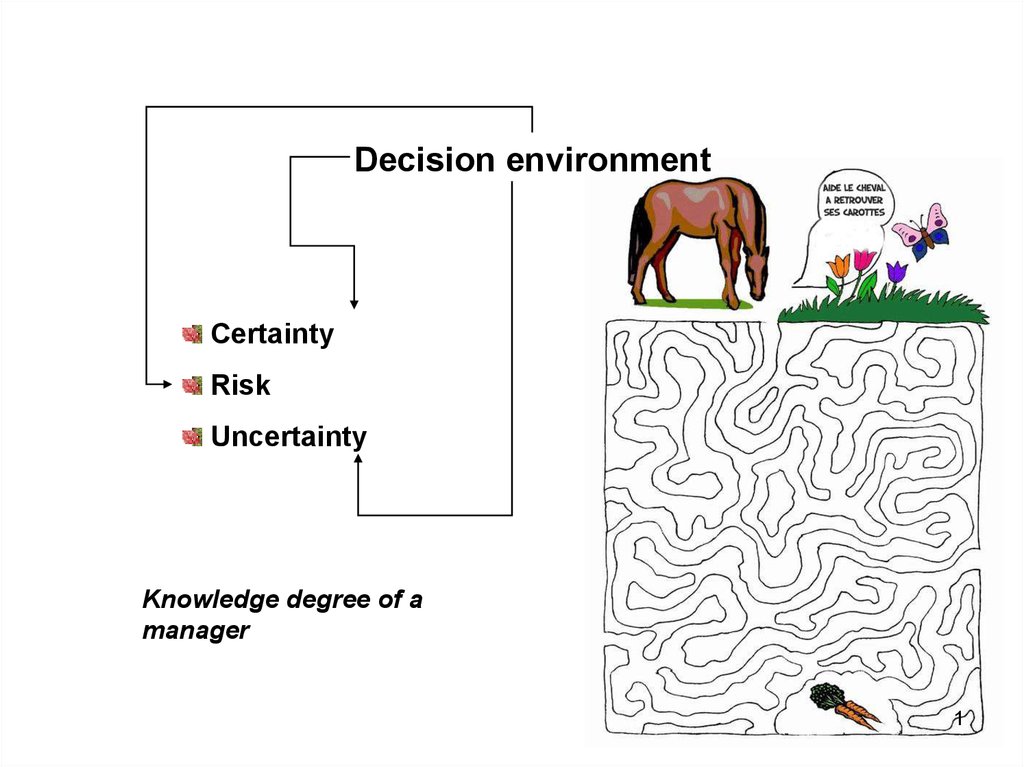
Decision environment
1.
Decision environmentCertainty
Risk
Uncertainty
Knowledge degree of a
manager
1
2.
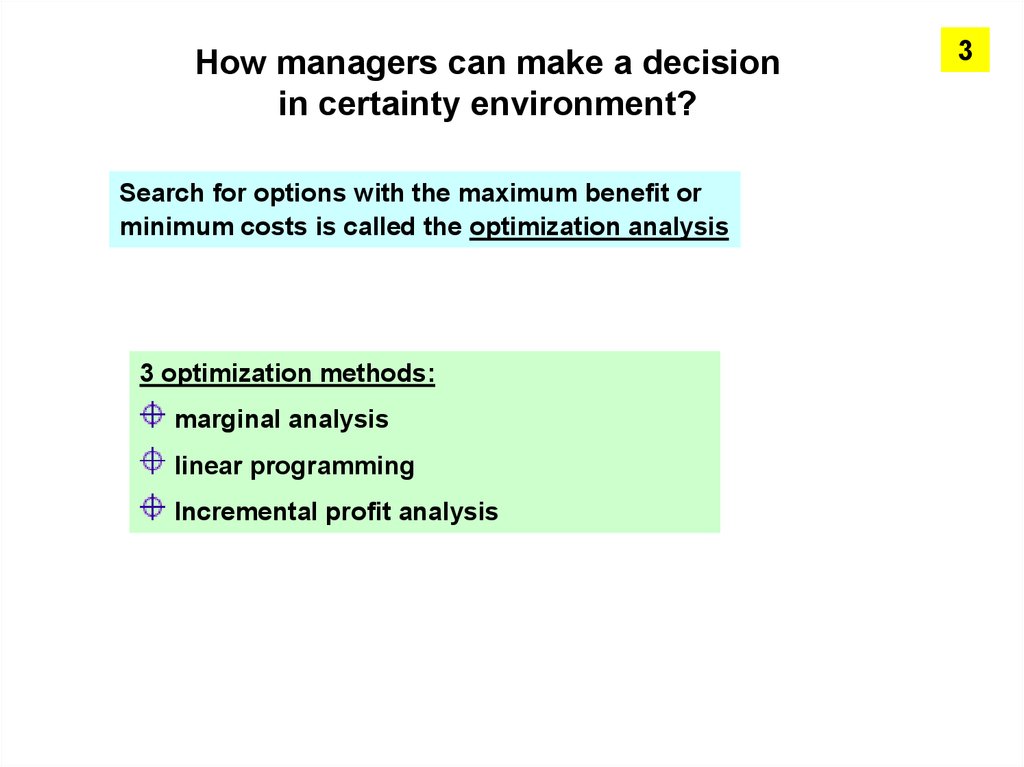
How managers can make a decisionin certainty environment?
Search for options with the maximum benefit or
minimum costs is called the optimization analysis
3 optimization methods:
marginal analysis
linear programming
Incremental profit analysis
3
3.
4How managers can make a decision
in risk – and uncertainty
environment?
4.
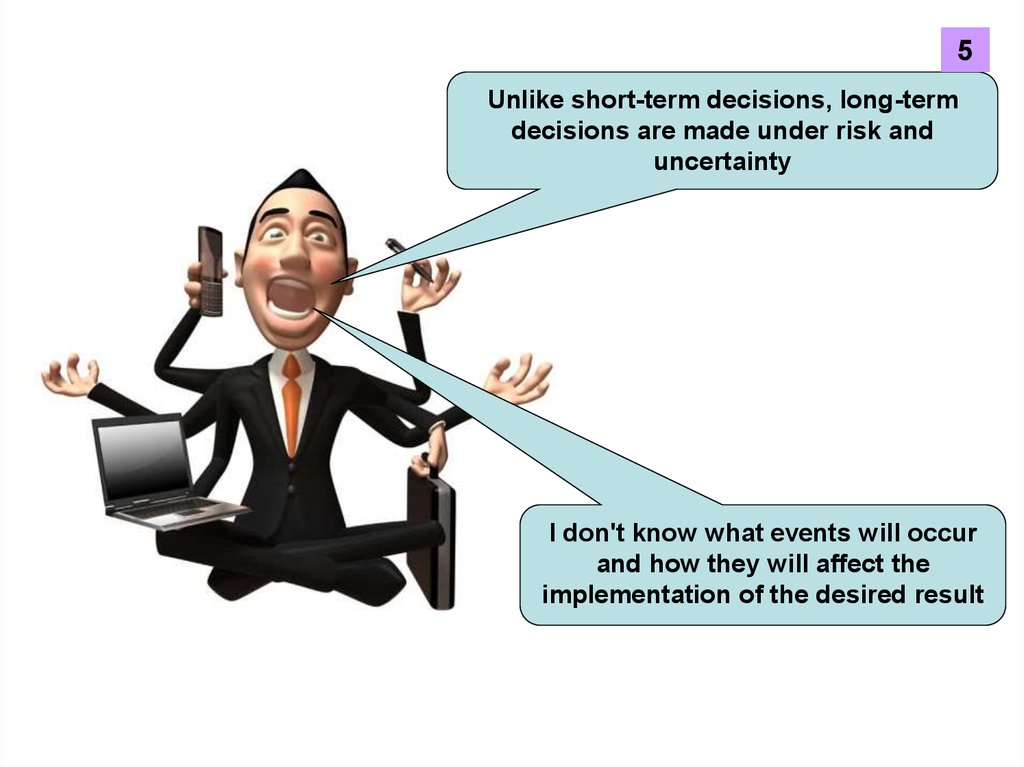
5Unlike short-term decisions, long-term
decisions are made under risk and
uncertainty
I don't know what events will occur
and how they will affect the
implementation of the desired result
5.
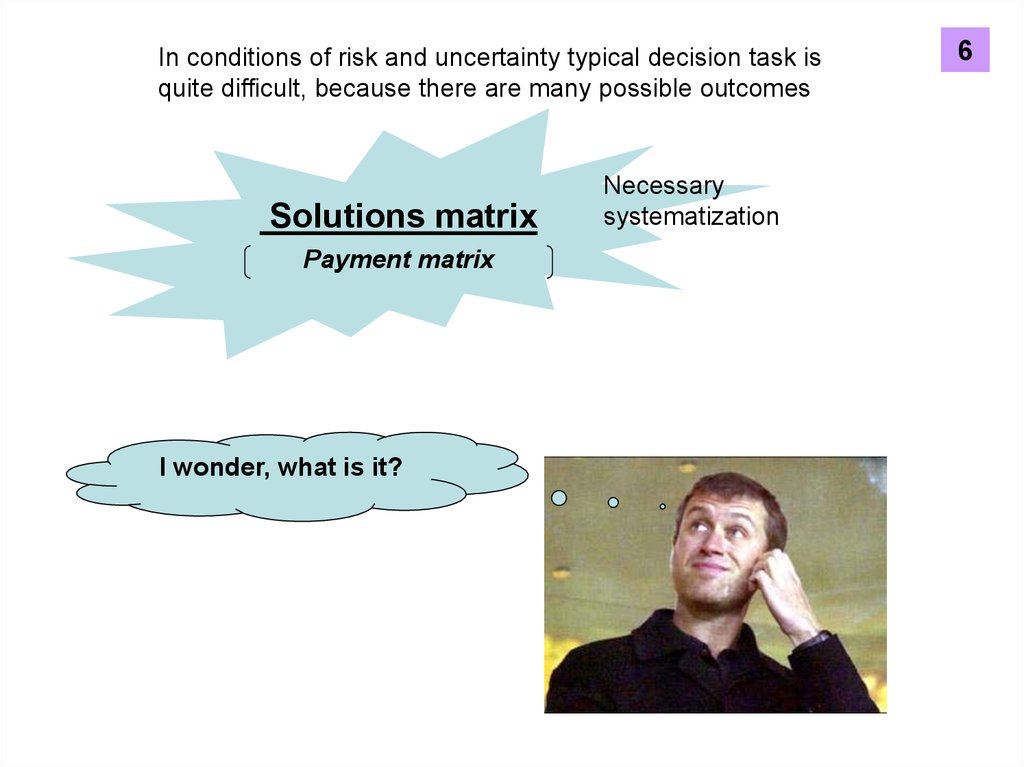
In conditions of risk and uncertainty typical decision task isquite difficult, because there are many possible outcomes
Solutions matrix
Payment matrix
I wonder, what is it?
Necessary
systematization
6
6.
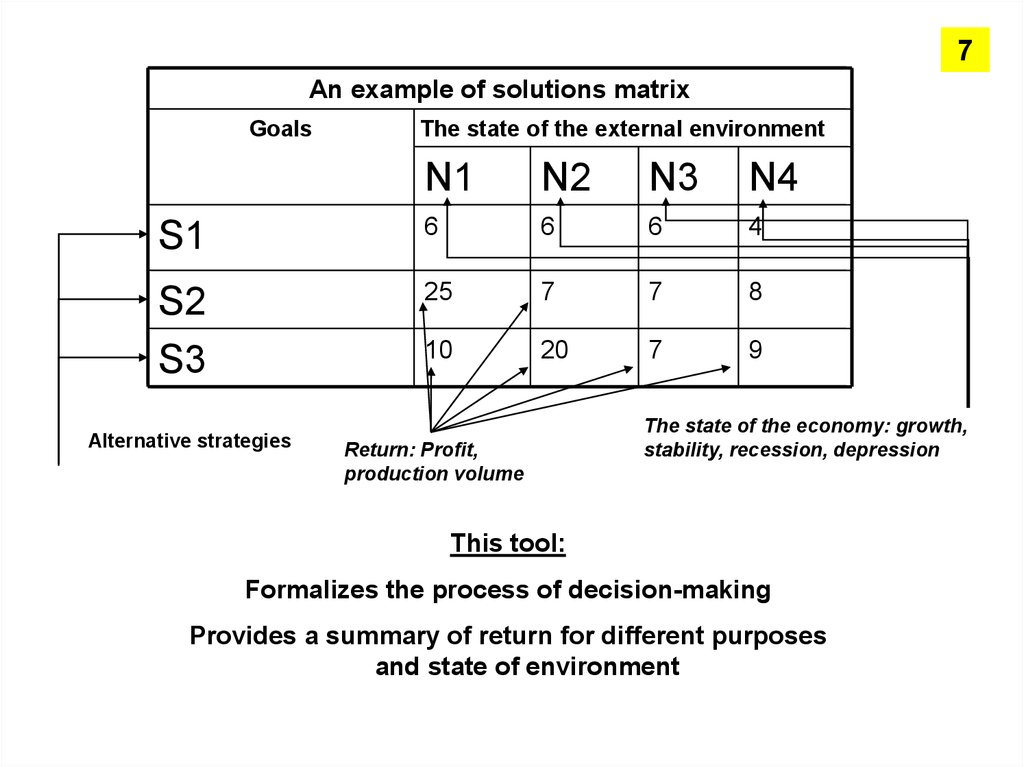
7An example of solutions matrix
Goals
The state of the external environment
N1
N2
N3
N4
S1
6
6
6
4
S2
S3
25
7
7
8
10
20
7
9
Alternative strategies
Return: Profit,
production volume
The state of the economy: growth,
stability, recession, depression
This tool:
Formalizes the process of decision-making
Provides a summary of return for different purposes
and state of environment
7.
Decision-making in terms of risk8.
(Risk – probability of undesiredoccurense)
Methods of
risk
evaluation:
9
9.
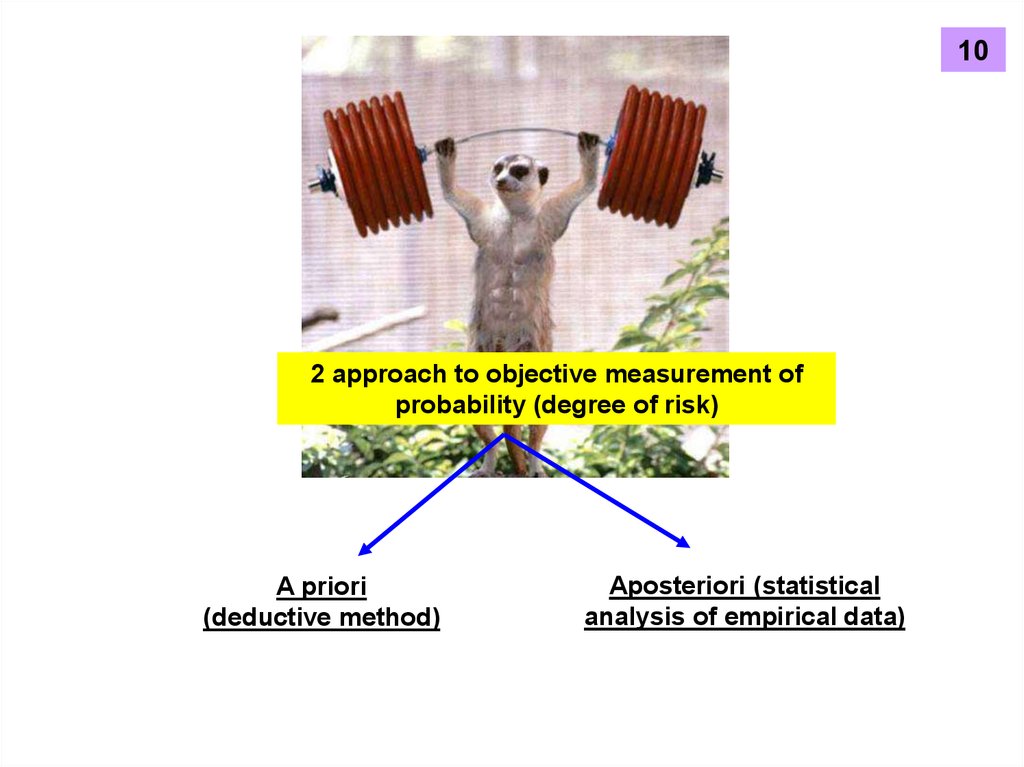
102 approach to objective measurement of
probability (degree of risk)
A priori
(deductive method)
Aposteriori (statistical
analysis of empirical data)
10.
11A priori
(deductive method)
No experiment and analysis of past experience
Ex:
characteristics of possible cases
are known in advance
11.
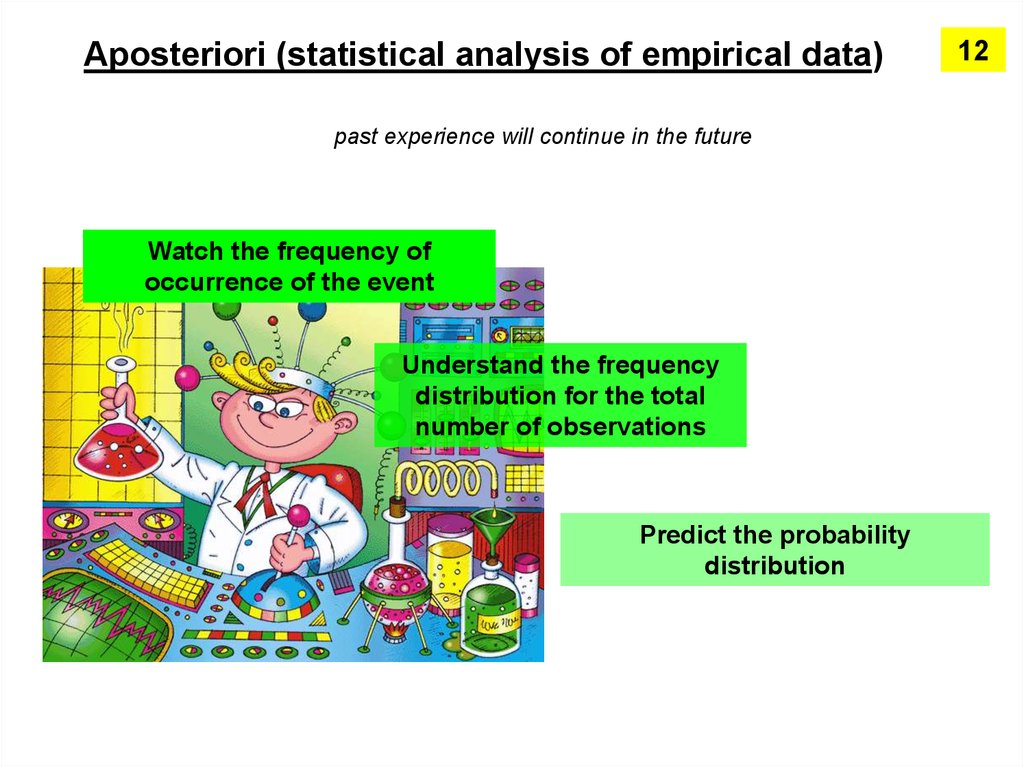
Aposteriori (statistical analysis of empirical data)past experience will continue in the future
Watch the frequency of
occurrence of the event
Understand the frequency
distribution for the total
number of observations
Predict the probability
distribution
12
12.
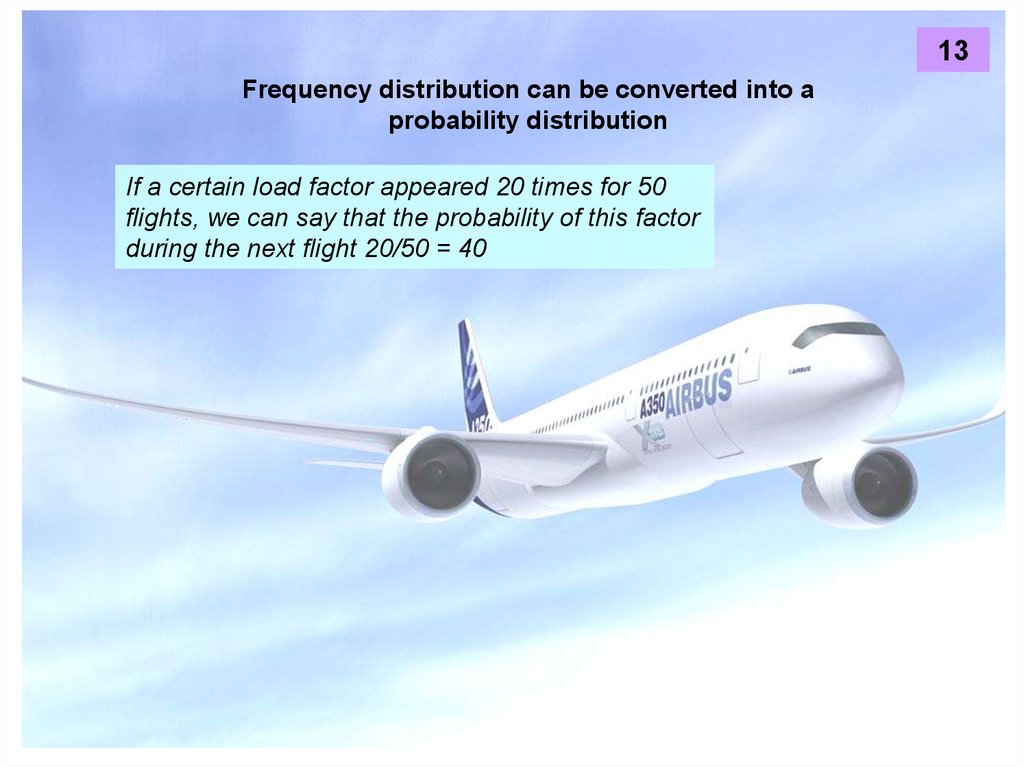
13Frequency distribution can be converted into a
probability distribution
If a certain load factor appeared 20 times for 50
flights, we can say that the probability of this factor
during the next flight 20/50 = 40
13.
14Determine and minimize the
risks inherent to a particular
project
One of the methods: the calculation of
the probability distribution of possible
outcomes, then the calculation of
expected value
14.
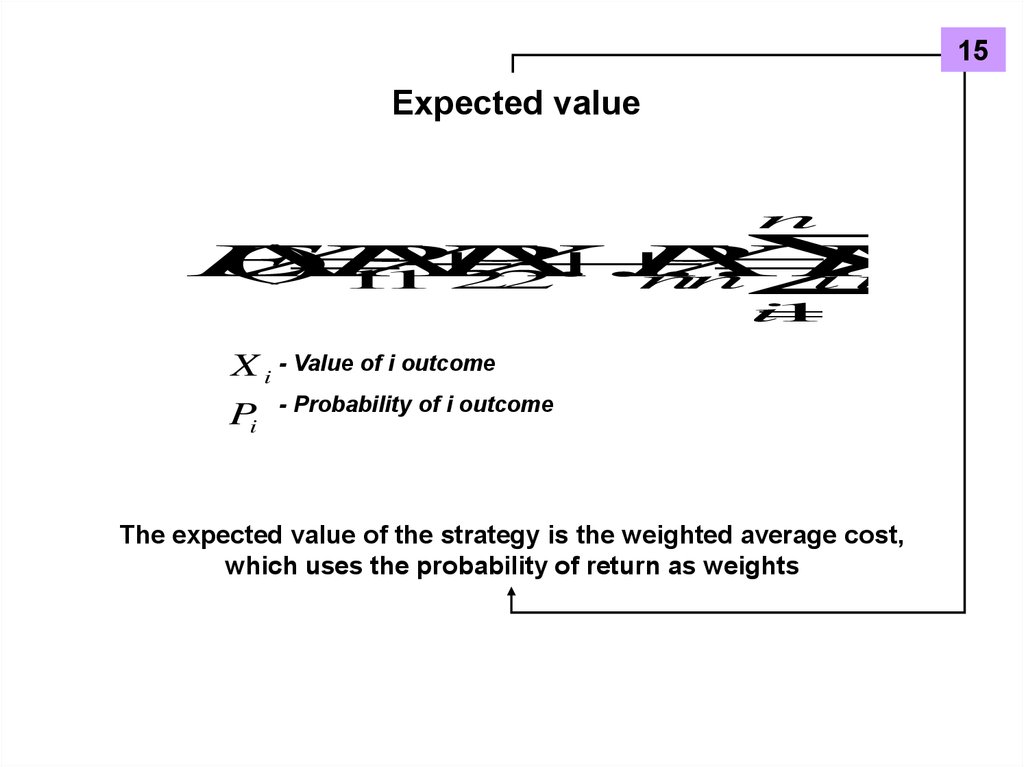
15Expected value
n
E
(
X
)
P
X
P
X
....
P
X
P
X
1
1
2
2
n
n
i
i
i
1
X i - Value of i outcome
Pi
- Probability of i outcome
The expected value of the strategy is the weighted average cost,
which uses the probability of return as weights
15.
16Manager choose strategy with the highest
expected value
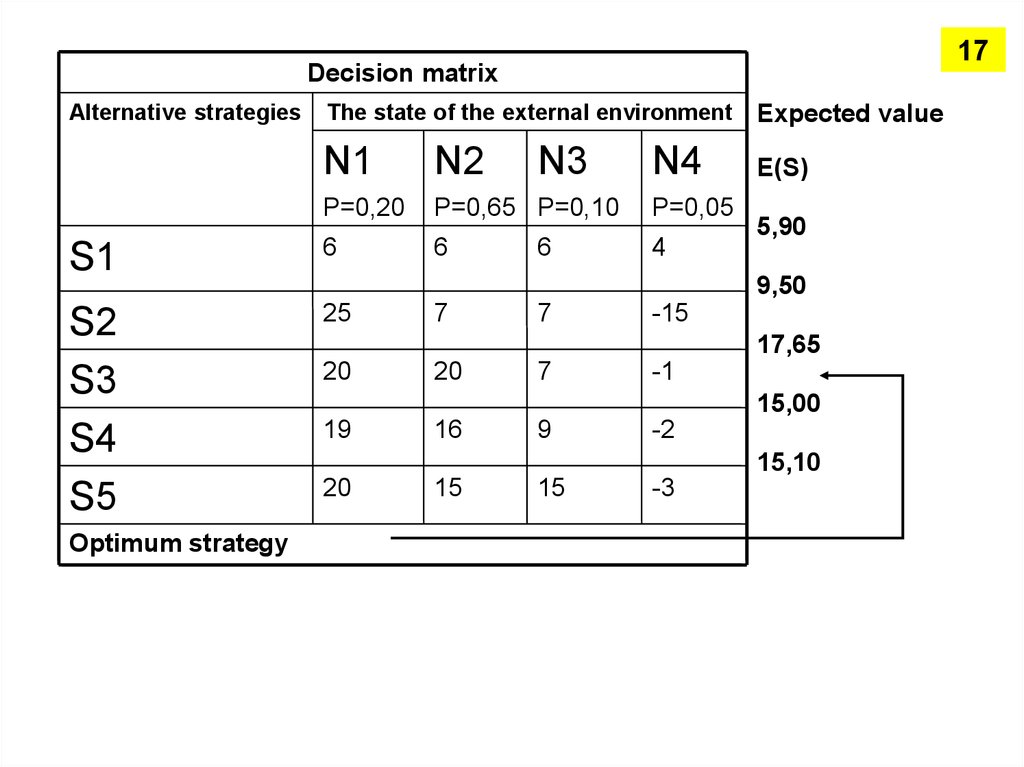
16.
17Decision matrix
Alternative strategies
The state of the external environment
Expected value
N1
N2
E(S)
P=0,20
P=0,65 P=0,10
P=0,05
S1
6
6
4
S2
S3
S4
S5
25
Optimum strategy
N3
6
N4
5,90
9,50
7
7
-15
17,65
20
20
7
-1
15,00
19
16
9
-2
15,10
20
15
15
-3
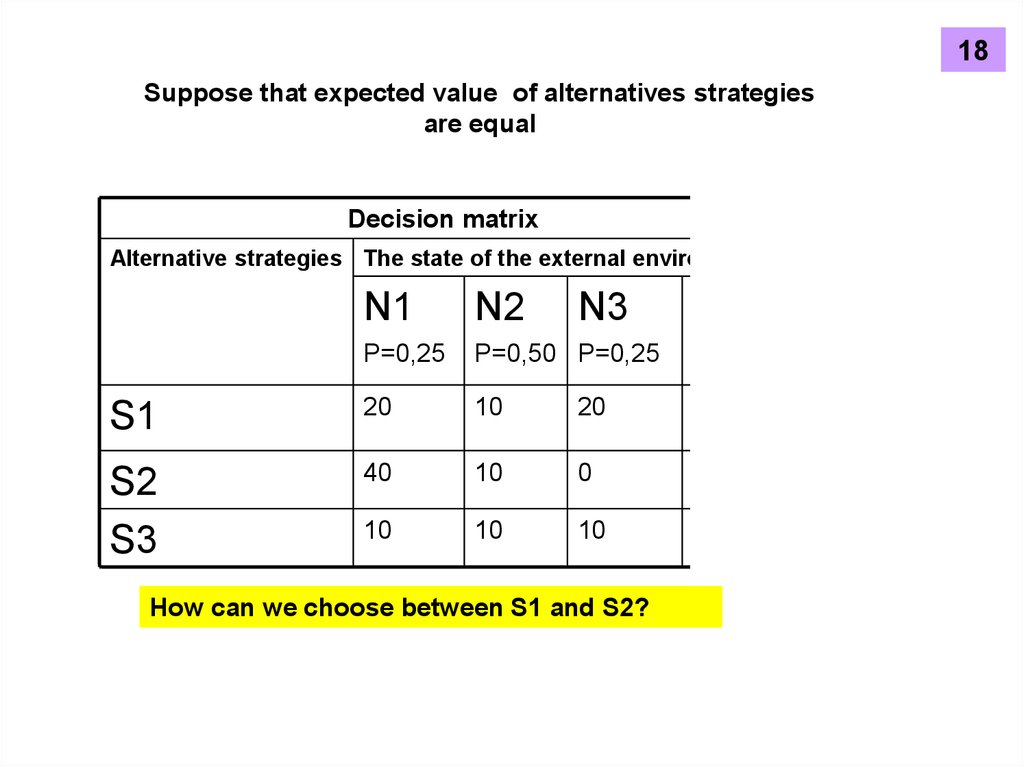
17.
18Suppose that expected value of alternatives strategies
are equal
Decision matrix
Alternative strategies The state of the external environment
N3
Предпола
гаемая
стоимость
N1
N2
P=0,25
P=0,50 P=0,25
S1
20
10
20
15
S2
S3
40
10
0
15
10
10
10
10
How can we choose between S1 and S2?
E(S)
18.
19New criteria – degree of risk
May be determined as deviation scope of probable
outcome from expected value
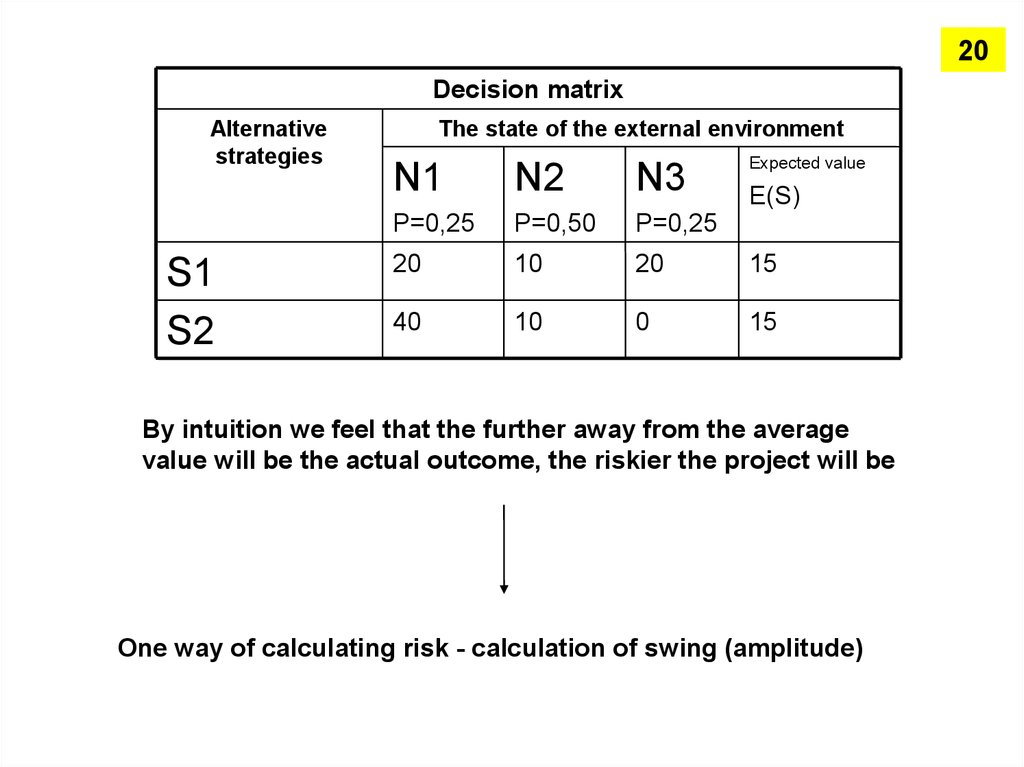
19.
20Decision matrix
Alternative
strategies
S1
S2
The state of the external environment
Expected value
N1
N2
N3
P=0,25
P=0,50
P=0,25
20
10
20
15
40
10
0
15
E(S)
By intuition we feel that the further away from the average
value will be the actual outcome, the riskier the project will be
One way of calculating risk - calculation of swing (amplitude)
20.
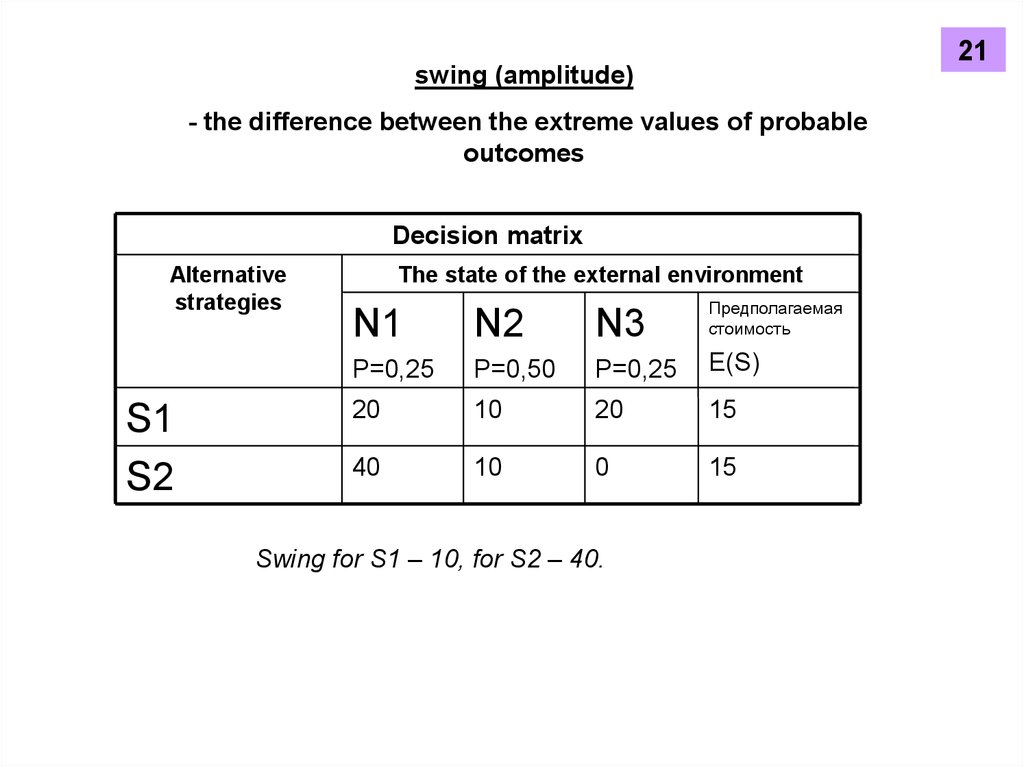
21swing (amplitude)
- the difference between the extreme values of probable
outcomes
Decision matrix
Alternative
strategies
S1
S2
The state of the external environment
N1
N2
N3
Предполагаемая
стоимость
P=0,25
P=0,50
P=0,25
E(S)
20
10
20
15
40
10
0
15
Swing for S1 – 10, for S2 – 40.
21.
22root-mean-square deviation
The higher root-mean-square
deviation - the higher risk
22.
23Calculation of the root-mean-square deviation:
23.
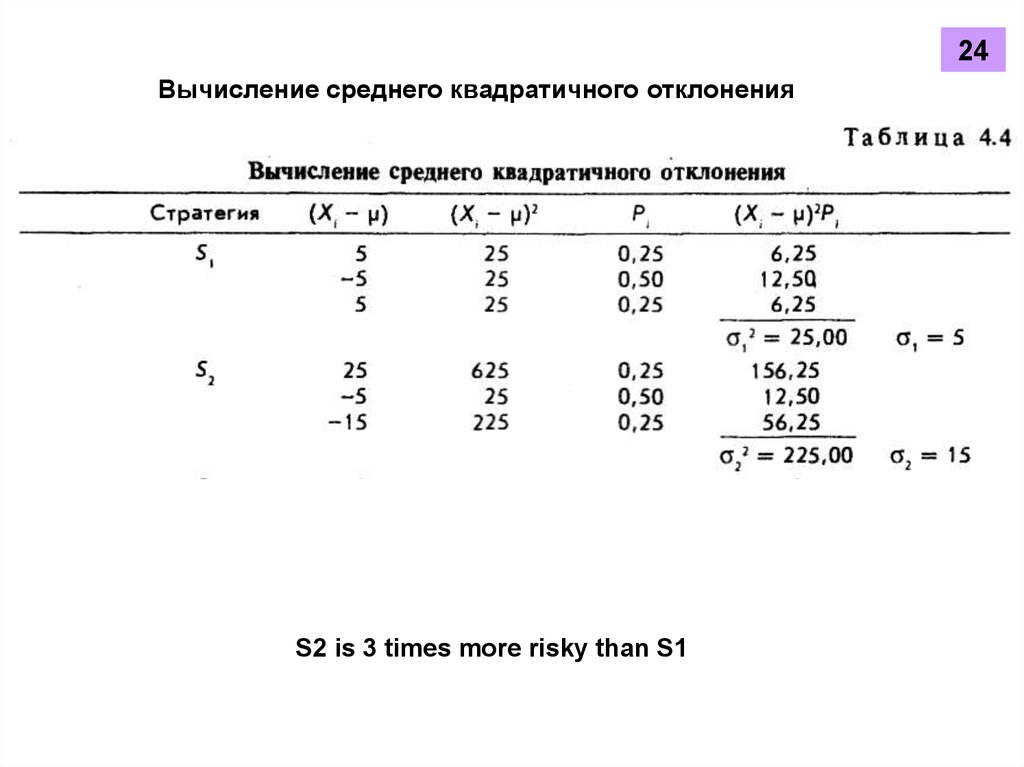
24Вычисление среднего квадратичного отклонения
Матрица решения
Альтернативные
стратегии
S1
S2
Состояние экономики
N1
N2
N3
Предполагаемая
стоимость
P=0,25
P=0,50
P=0,25
E(S)
20
10
20
15
40
10
0
15
S2 is 3 times more risky than S1