 education
Similar presentations:


Your name company projects
1.
YOUR NAMECOMPANY
PROJECTS
DD/MM/20X
X
Here is where your presentation begins
MINIMAL
GRADIENT
PITCH DECK
2.
CONTENTS OF THIS TEMPLATEFonts
Colors
Thanks slide
Icons and
infographics
To view this template
correctly in PowerPoint,
download and install the
fonts we used
You can see on the link all
the colors used in this
presentation
You must keep it so that
proper credits for our design
are given
These can be used in the
template, and their size and
color can be edited
For more info:
SLIDESGO | SLIDESGO AI TOOLS | BLOG | FAQs
You can visit our sister projects:
FREEPIK AI TOOLS | FREEPIK LIBRARY RESOURCES
You can edit the master slides easily.
For more info, click here
You can delete this slide when you’re
done editing the presentation
3.
THIS IS THETABLE OF
CONTENTS
01
04
OVERVIEW AND
INTRODUCTION
DEMO TO EXPLAIN
PRODUCT VALUE
02
05
UNDERSTANDING THE
PROBLEM AND
SOLUTION
OUR TEAM AND
TIMELINE OVERVIEW
03
06
IDENTIFYING THE
MARKET OPPORTUNITY
KEY FINANCIALS AND
PERFORMANCE METRICS
4.
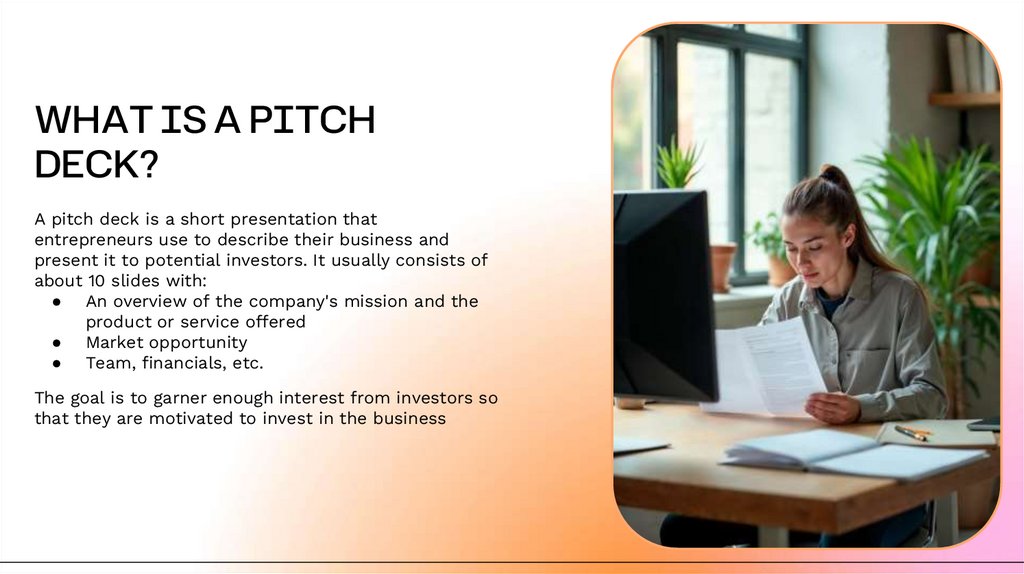
WHAT IS A PITCHDECK?
A pitch deck is a short presentation that
entrepreneurs use to describe their business and
present it to potential investors. It usually consists of
about 10 slides with:
● An overview of the company's mission and the
product or service offered
● Market opportunity
● Team, financials, etc.
The goal is to garner enough interest from investors so
that they are motivated to invest in the business
5.
You can enter a subtitle here if you need itOVERVIEW AND
INTRODUCTION
01
6.
USE THE OVERVIEW TOPROVIDE A CLEAR
INTRODUCTION
The overview section of a pitch deck provides a concise summary of the
project, its purpose, and its potential impact. It should clearly state what the
project is about and highlight the problem it aims to solve. The overview
should outline the target audience, the key value propositions, and why this
project stands out in the market. It’s important to convey the project's vision
and its relevance in a way that captures attention. A well-crafted overview
helps the audience quickly understand the project’s potential and its
alignment with market needs, laying the foundation for the details to follow
7.
INTRODUCTIONAN OVERVIEW OF OUR COMPANY AND ITS MISSION
The introduction of your company in the pitch deck should include a brief overview of
who you are and what you do. It should also include a brief description of why your
product or service is unique and the value it provides to customers
UNDERSTANDING THE CORE OF OUR IDEA
The “our idea” part of a pitch deck should include an explanation of your
product/service, how it works, and what the customer value is. You should also
explain the market opportunity for your product/service
8.
MAIN IDEASOF THE
PITCH DECK
PRESENTATION
OUTLINING OUR
VISION
A great presentation for a pitch deck
should be concise, clear and easy to
understand. Visual elements such as
charts, graphs, images, and videos can
help to make the presentation engaging
THE VALUE WE
BRING TO OUR
INVESTORS
When it comes to picking investors for
a pitch deck, it's important to research
potential investors and understand
their preferences, goals and interests
UNDERSTANDING
THE VALUE OF OUR
SOLUTION
The value of a product is determined
by how much customers are willing to
pay for it. It's a combination of factors,
including the quality of the product, its
features, and how well it meets our
customer needs
9.
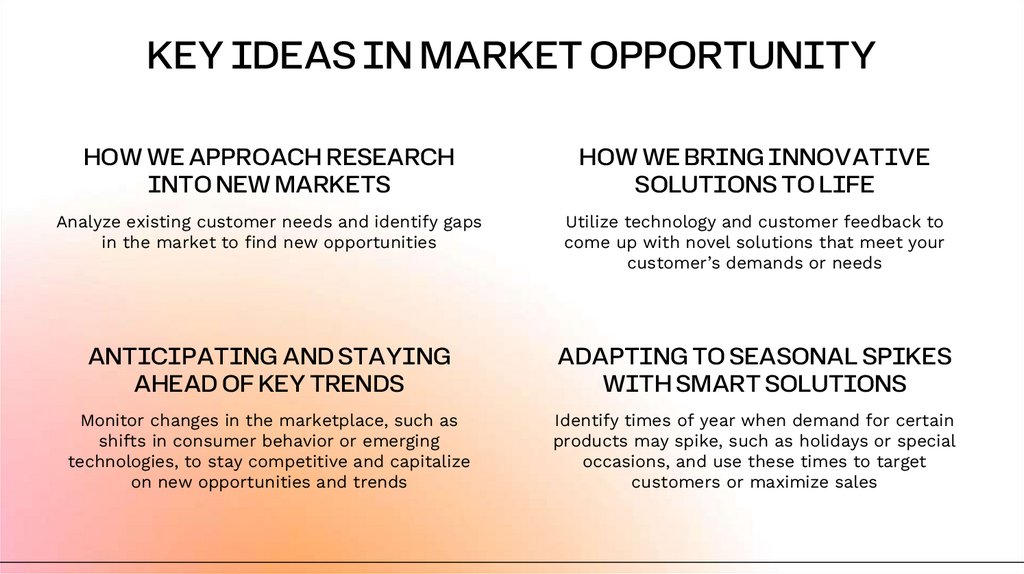
KEY IDEAS IN MARKET OPPORTUNITYHOW WE APPROACH RESEARCH
INTO NEW MARKETS
HOW WE BRING INNOVATIVE
SOLUTIONS TO LIFE
Analyze existing customer needs and identify gaps
in the market to find new opportunities
Utilize technology and customer feedback to
come up with novel solutions that meet your
customer’s demands or needs
ANTICIPATING AND STAYING
AHEAD OF KEY TRENDS
ADAPTING TO SEASONAL SPIKES
WITH SMART SOLUTIONS
Monitor changes in the marketplace, such as
shifts in consumer behavior or emerging
technologies, to stay competitive and capitalize
on new opportunities and trends
Identify times of year when demand for certain
products may spike, such as holidays or special
occasions, and use these times to target
customers or maximize sales
10.
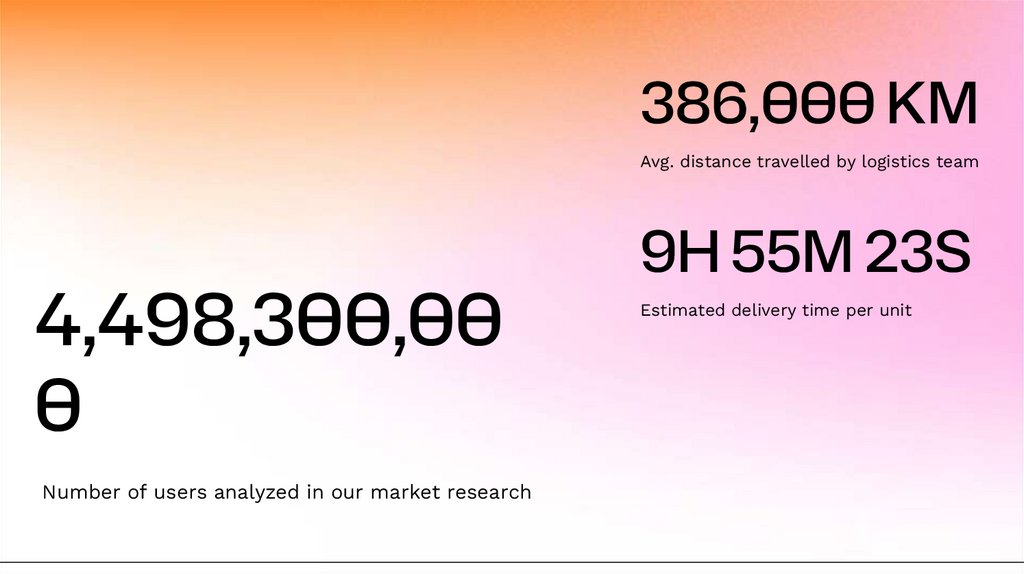
386,000 KMAvg. distance travelled by logistics team
4,498,300,00
0
Number of users analyzed in our market research
9H 55M 23S
Estimated delivery time per unit
11.
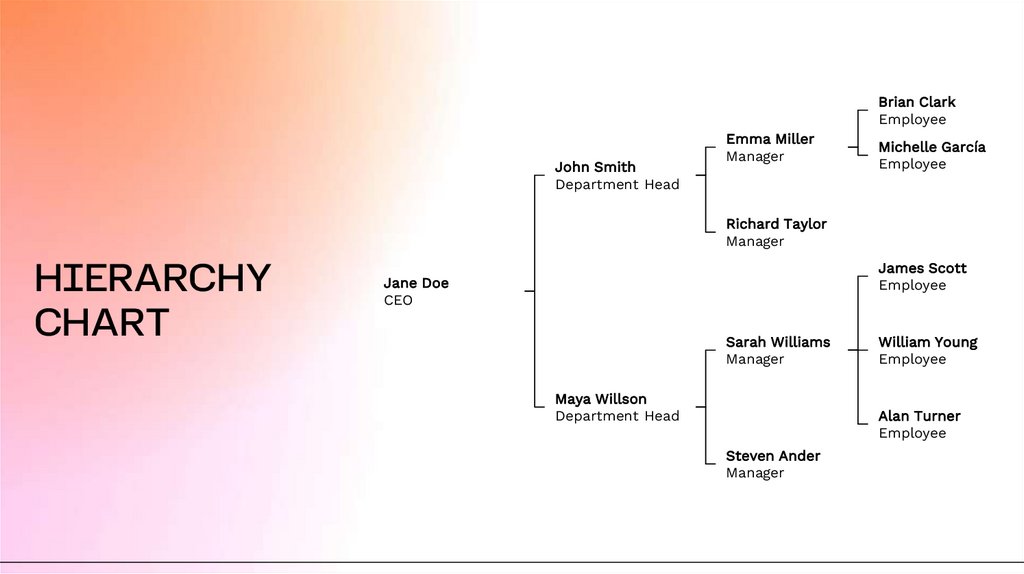
Brian ClarkEmployee
John Smith
Department Head
Emma Miller
Manager
Michelle García
Employee
Richard Taylor
Manager
HIERARCHY
CHART
James Scott
Employee
Jane Doe
CEO
Sarah Williams
Manager
Maya Willson
Department Head
William Young
Employee
Alan Turner
Employee
Steven Ander
Manager
12.
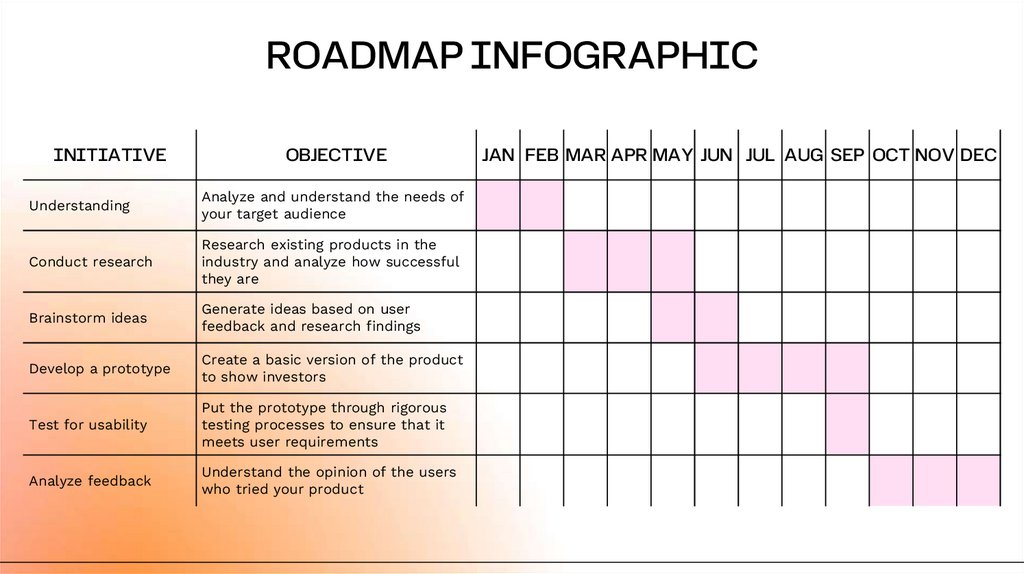
ROADMAP INFOGRAPHICINITIATIVE
OBJECTIVE
Understanding
Analyze and understand the needs of
your target audience
Conduct research
Research existing products in the
industry and analyze how successful
they are
Brainstorm ideas
Generate ideas based on user
feedback and research findings
Develop a prototype
Create a basic version of the product
to show investors
Test for usability
Put the prototype through rigorous
testing processes to ensure that it
meets user requirements
Analyze feedback
Understand the opinion of the users
who tried your product
JAN FEB MAR APR MAY JUN JUL AUG SEP OCT NOV DEC
13.
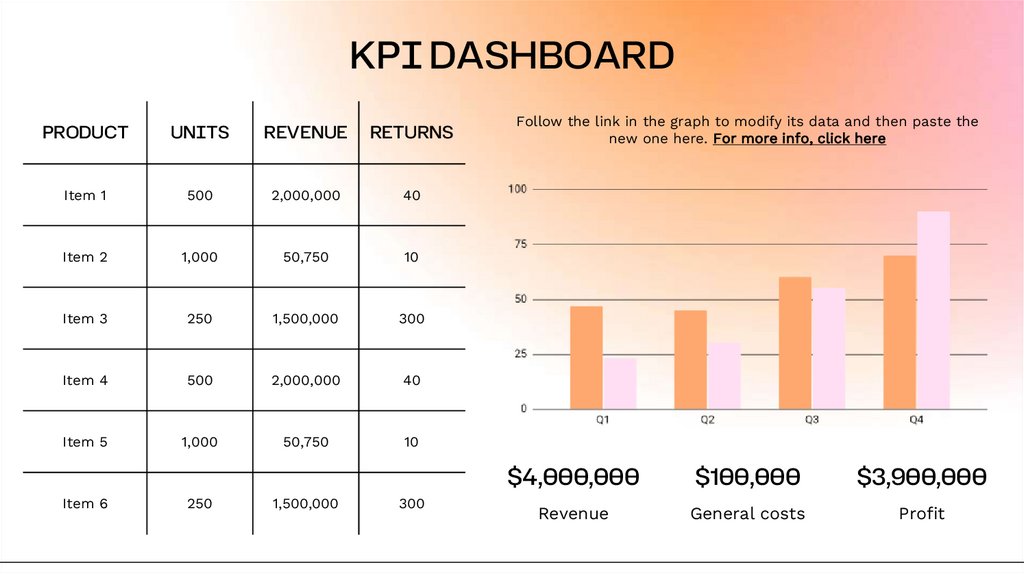
KPI DASHBOARDPRODUCT
UNITS
REVENUE
RETURNS
Item 1
500
2,000,000
40
Item 2
1,000
50,750
10
Item 3
250
1,500,000
300
Item 4
500
2,000,000
40
Item 5
1,000
50,750
10
Item 6
250
1,500,000
300
Follow the link in the graph to modify its data and then paste the
new one here. For more info, click here
$4,000,000
$100,000
$3,900,000
Revenue
General costs
Profit
14.
CREDITS: This presentation templatewas created by Slidesgo, and
includes icons, infographics & images
by Freepik
Please keep this slide for attribution
THANK YOU
Do you have any questions?
youremail@freepik.com
+00 000 000 000
yourwebsite.com
15.
Instructions for useIf you have a free account, in order to use this template, you must credit Slidesgo by keeping the Thanks slide
As a Free user, you are allowed to:
Modify this template
You are not allowed to:
Sublicense, sell or rent any of
Slidesgo Content
Include Slidesgo Content in an
online or offline database or file
Use it for both personal and commercial projects
Distribute Slidesgo Content unless it has been
expressly authorized by Slidesgo
Offer Slidesgo templates (or modified versions of
Slidesgo templates) for download
Acquire the copyright of
Slidesgo Content
For more information about editing slides, please read our FAQs or visit our blog
16.
Instructions for use (premium users)As a Premium user, you can use this template without attributing Slidesgo or keeping the Thanks slide
You are allowed to:
Modify this template
Use it for both personal and commercial projects
Share this template in an
editable format
Hide or delete the “Thanks” slide and the mention
to Slidesgo in the credits
You are not allowed to:
Sublicense, sell or rent any of
Slidesgo Content
Use any of the elements that are
part in a separated way
Distribute Slidesgo Content unless it has been
expressly authorized by Slidesgo
Register any of the elements as a trademark or logo
in an intellectual property registry
For more information about editing slides, please read our FAQs or visit our blog
17.
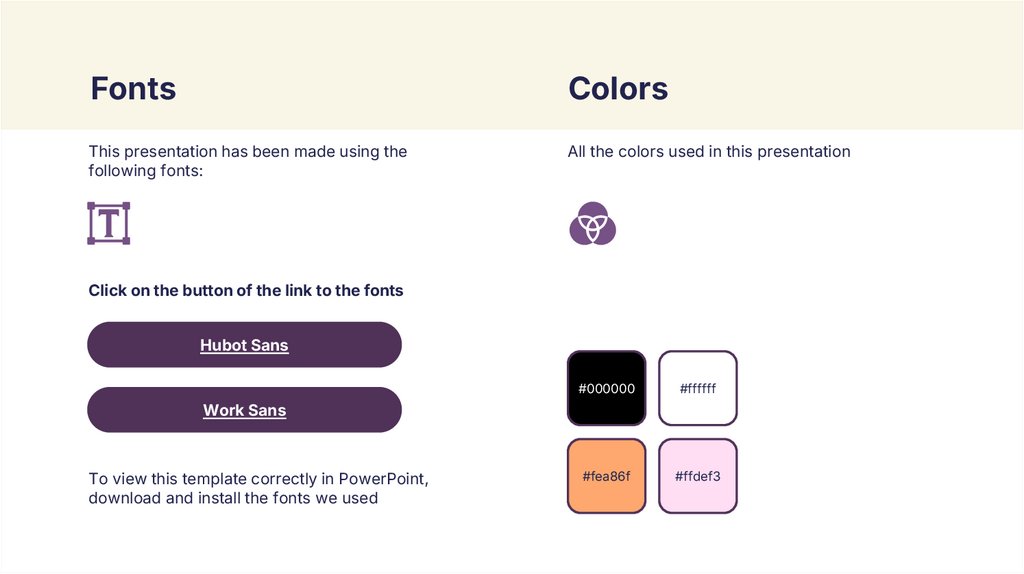
FontsColors
This presentation has been made using the
following fonts:
All the colors used in this presentation
Click on the button of the link to the fonts
Hubot Sans
#000000
#ffffff
#fea86f
#ffdef3
Work Sans
To view this template correctly in PowerPoint,
download and install the fonts we used
18.
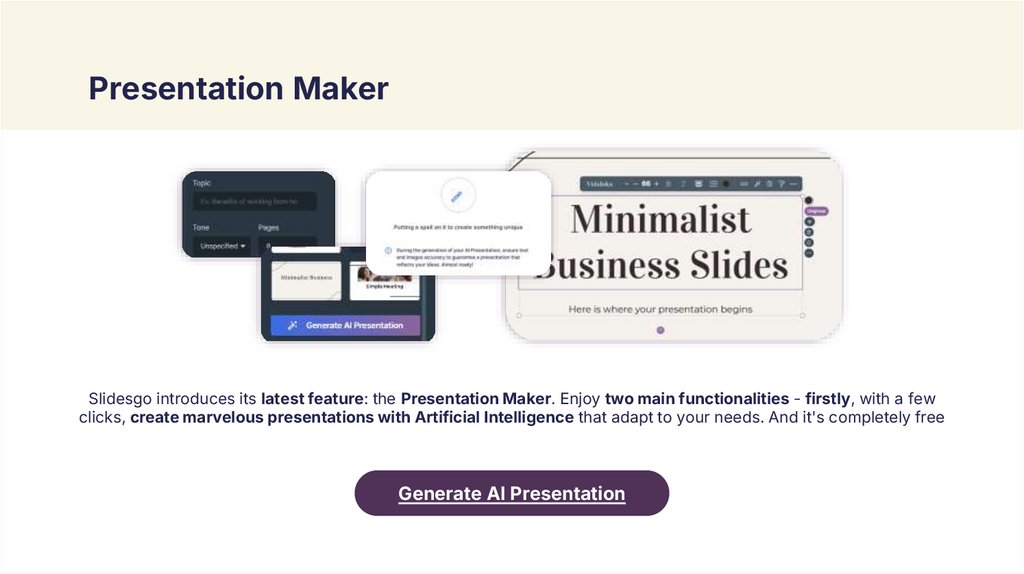
Presentation MakerSlidesgo introduces its latest feature: the Presentation Maker. Enjoy two main functionalities - firstly, with a few
clicks, create marvelous presentations with Artificial Intelligence that adapt to your needs. And it's completely free
Generate AI Presentation
19.
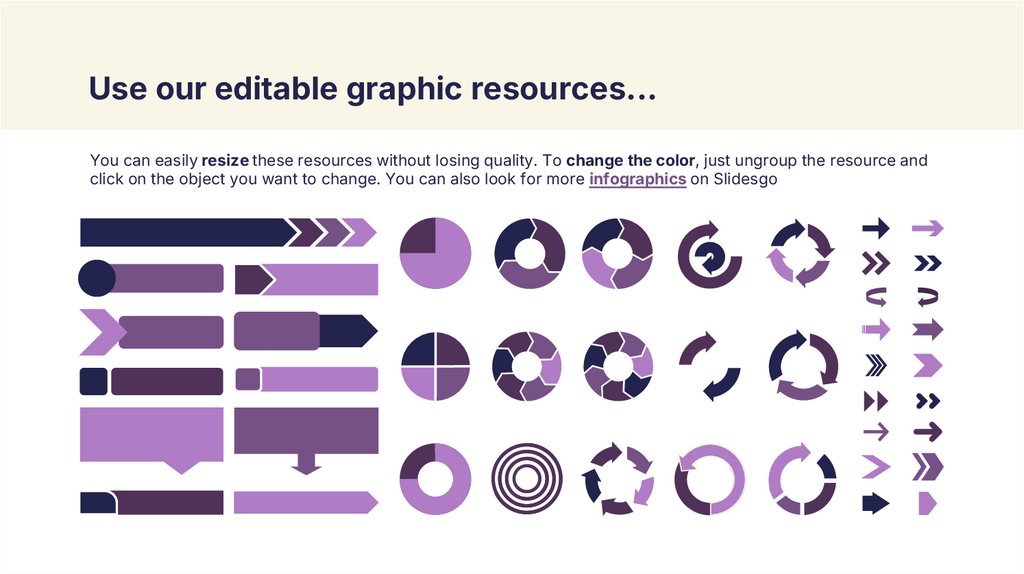
Use our editable graphic resources...You can easily resize these resources without losing quality. To change the color, just ungroup the resource and
click on the object you want to change. You can also look for more infographics on Slidesgo
20.
21.
22.
JanFeb
Mar
Apr
Jun
Task 1
Task 2
Task 3
Jan
No
Yes
Yes
No
Yes
Task 1
Yes
No
Yes
No
Yes
Task 2
Yes
Yes
No
Yes
No
Task 3
Feb
Mar
Apr
Jun
23.
24.
6/108/10
7/10
4/10
25.
...and our sets of editable iconsYou can resize these icons without losing quality
You can change the stroke and fill color; just select the icon and click on the paint bucket/pen
In Google Slides, you can also use Flaticon’s extension, allowing you to customize and add even more icons
26.
Educational iconsMedical icons
27.
Business iconsTeamwork icons
28.
Help & support iconsAvatar icons
29.
Creative process iconsPerforming arts icons
30.
Nature icons31.
SEO & marketing icons32.
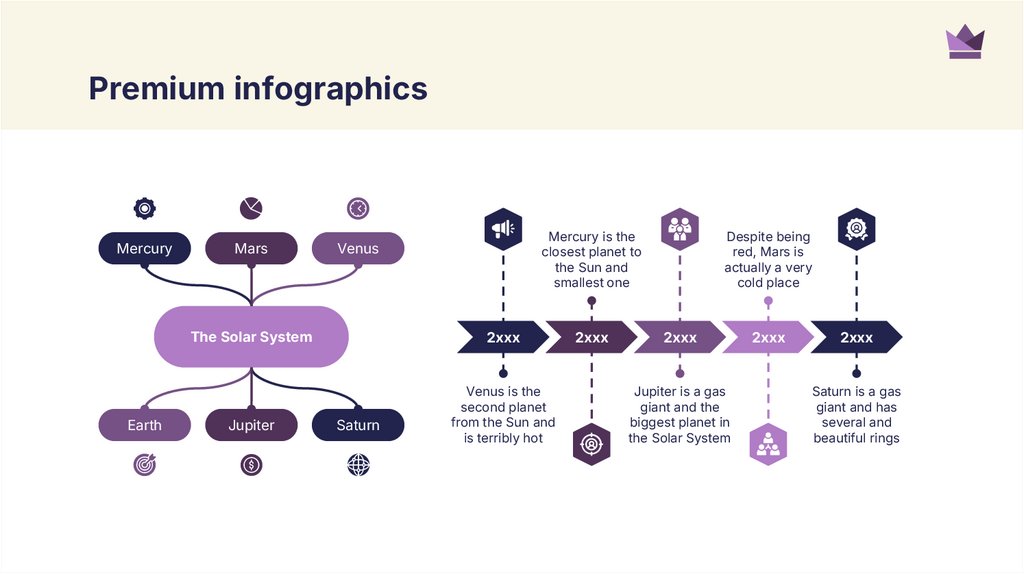
Premium infographicsMercury
Mars
The Solar System
Earth
Jupiter
Mercury is the
closest planet to
the Sun and
smallest one
Venus
2xxx
Saturn
Venus is the
second planet
from the Sun and
is terribly hot
2xxx
Despite being
red, Mars is
actually a very
cold place
2xxx
Jupiter is a gas
giant and the
biggest planet in
the Solar System
2xxx
2xxx
Saturn is a gas
giant and has
several and
beautiful rings
33.
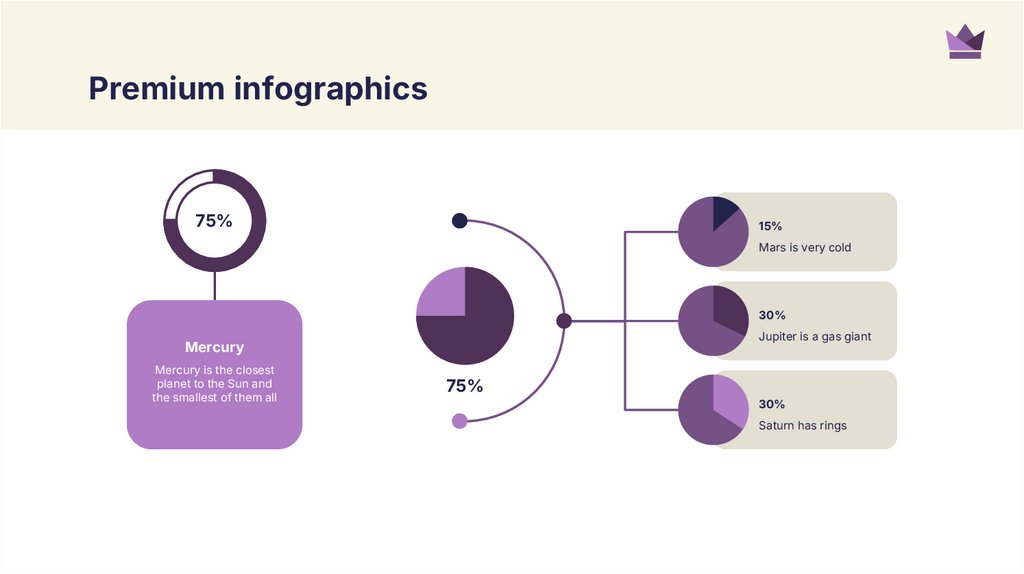
Premium infographics75%
15%
Mars is very cold
30%
Jupiter is a gas giant
Mercury
Mercury is the closest
planet to the Sun and
the smallest of them all
75%
30%
Saturn has rings
34.
Premium iconsDigital marketing
35.
Premium iconsOnline learning
36.
Premium iconsLaboratory
37.
Premium iconsGoals & results
38.
Premium iconsInfographic elements