

 biology
 chemistry
Similar presentations:


Biological neuron model
1.
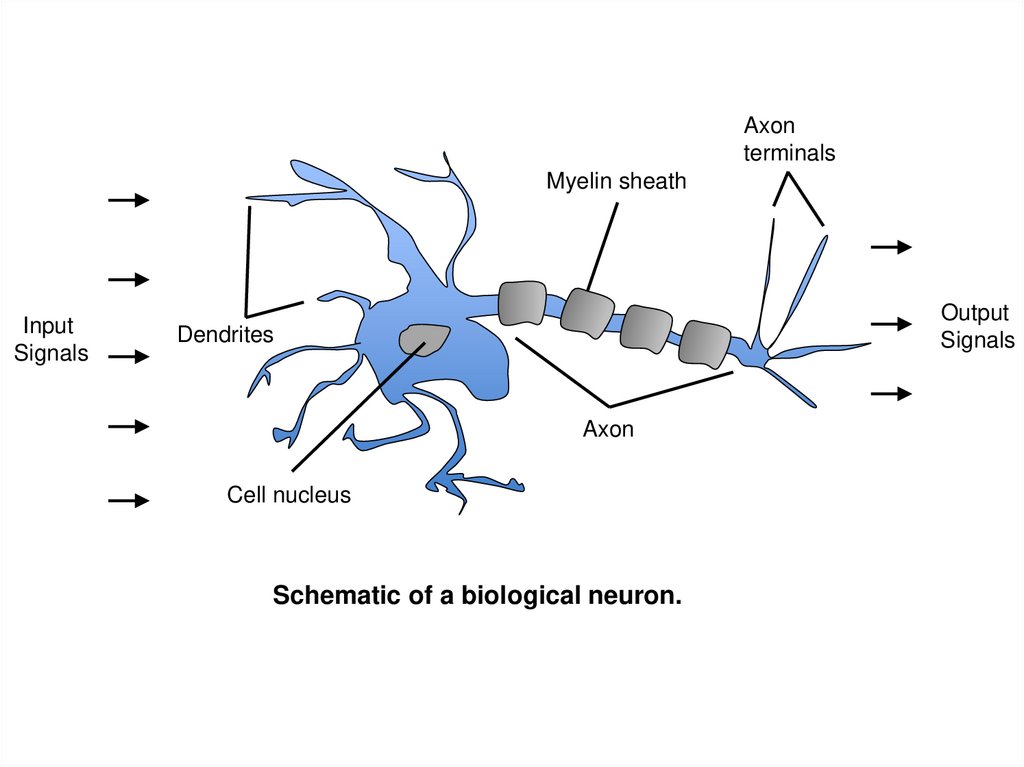
Axonterminals
Myelin sheath
Input
Signals
Output
Signals
Dendrites
Axon
Cell nucleus
Schematic of a biological neuron.
2.
3.
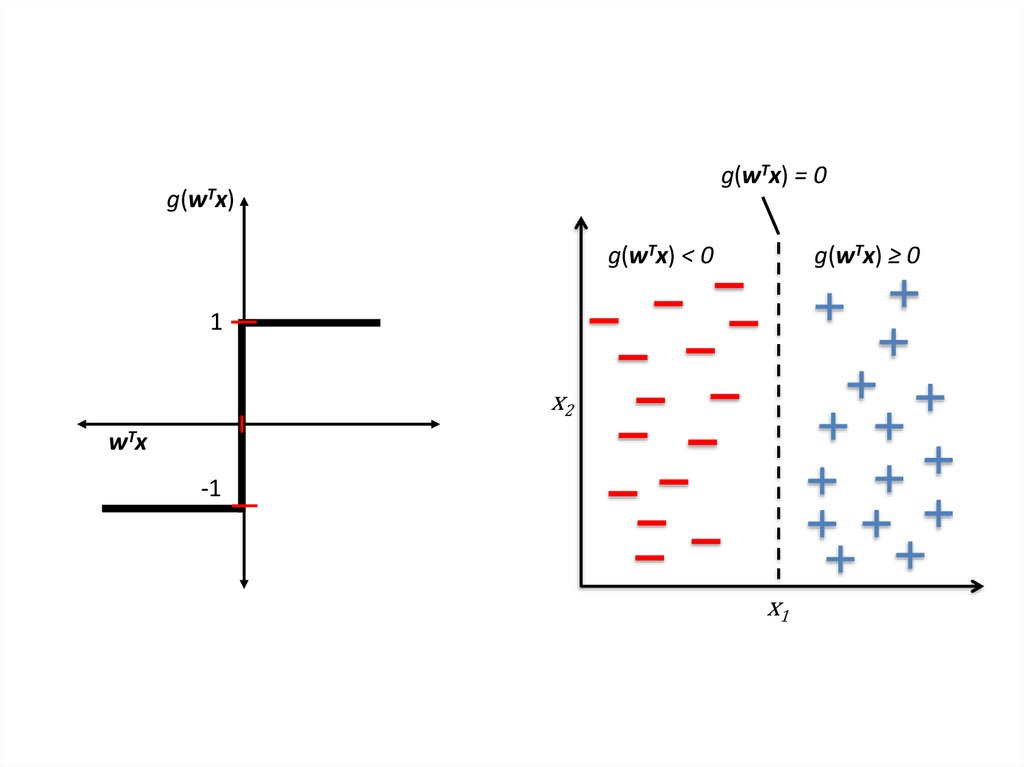
g(wTx) = 0g(wTx)
g(wTx) < 0
g(wTx) ≥ 0
1
x2
wTx
-1
x1
4.
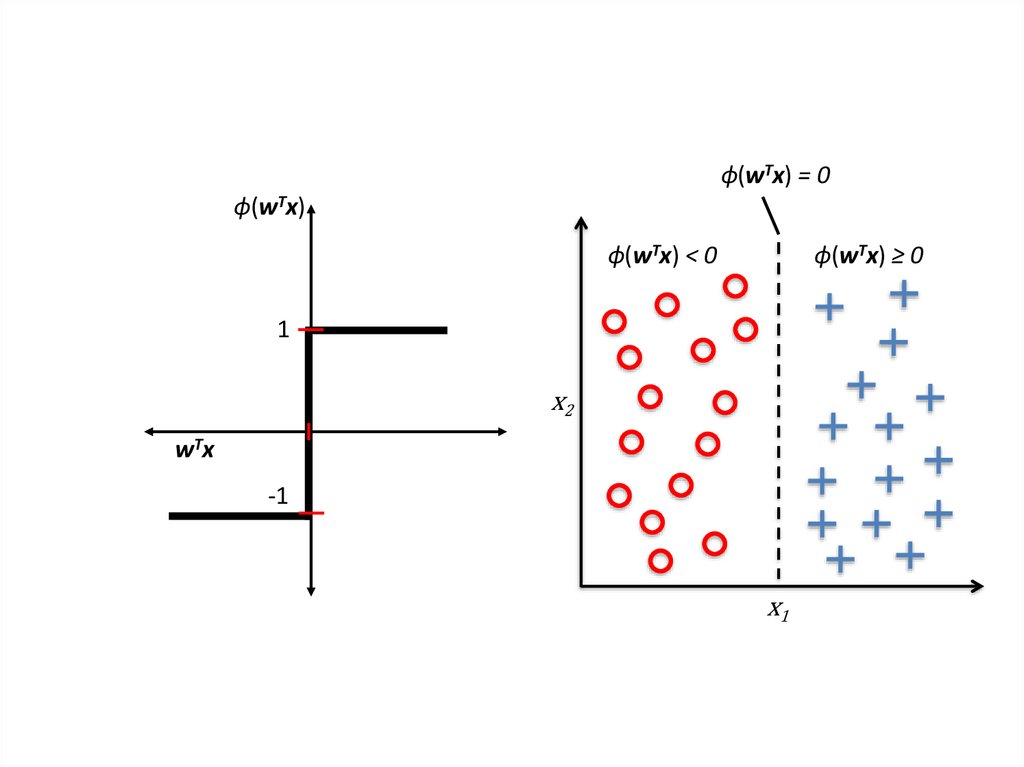
ϕ(wTx) = 0ϕ(wTx)
ϕ(wTx) < 0
ϕ(wTx) ≥ 0
1
x2
wTx
-1
x1
5.
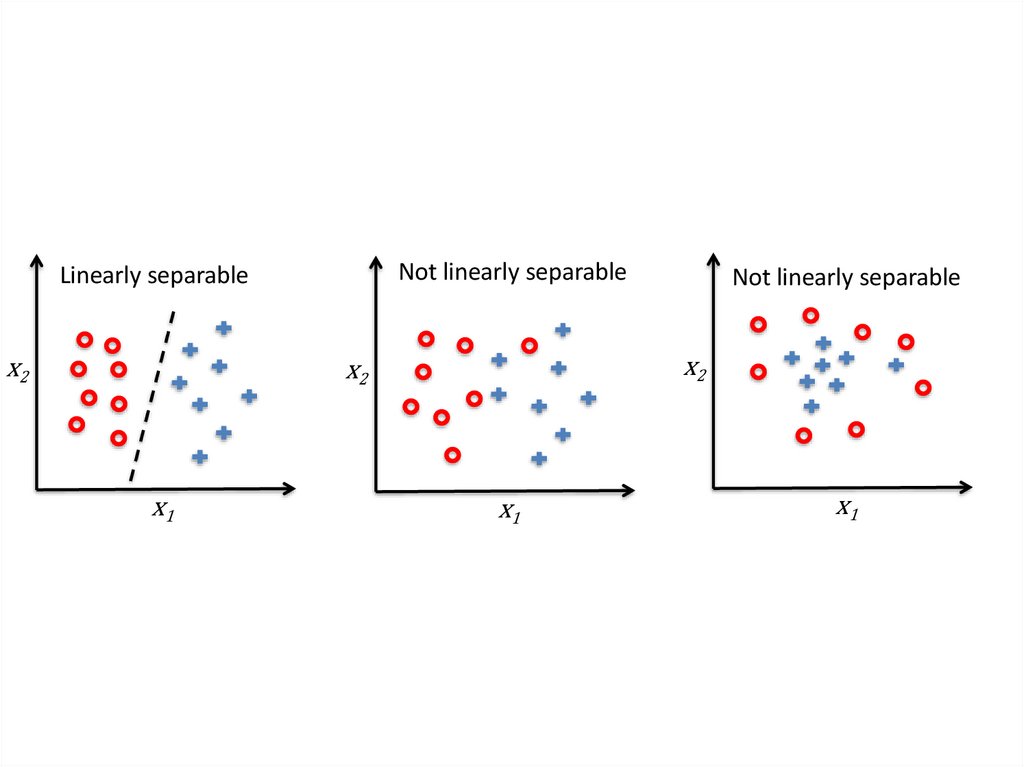
Not linearly separableLinearly separable
x2
x2
x2
x1
Not linearly separable
x1
x1
6.
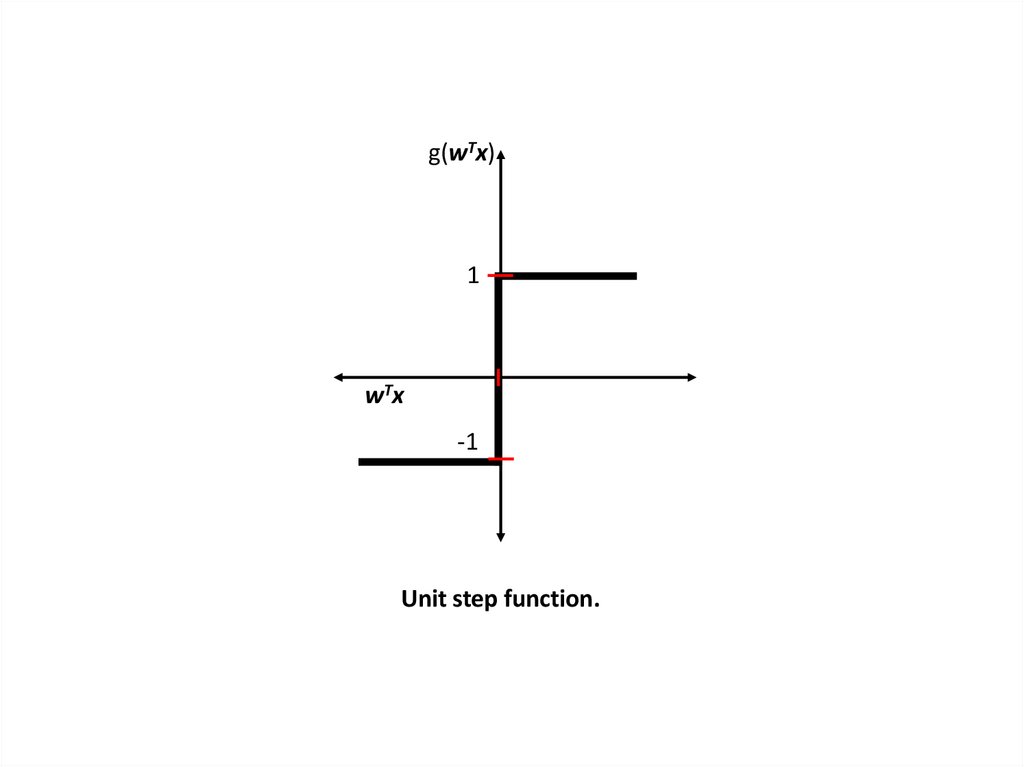
g(wTx)1
wTx
-1
Unit step function.
7.
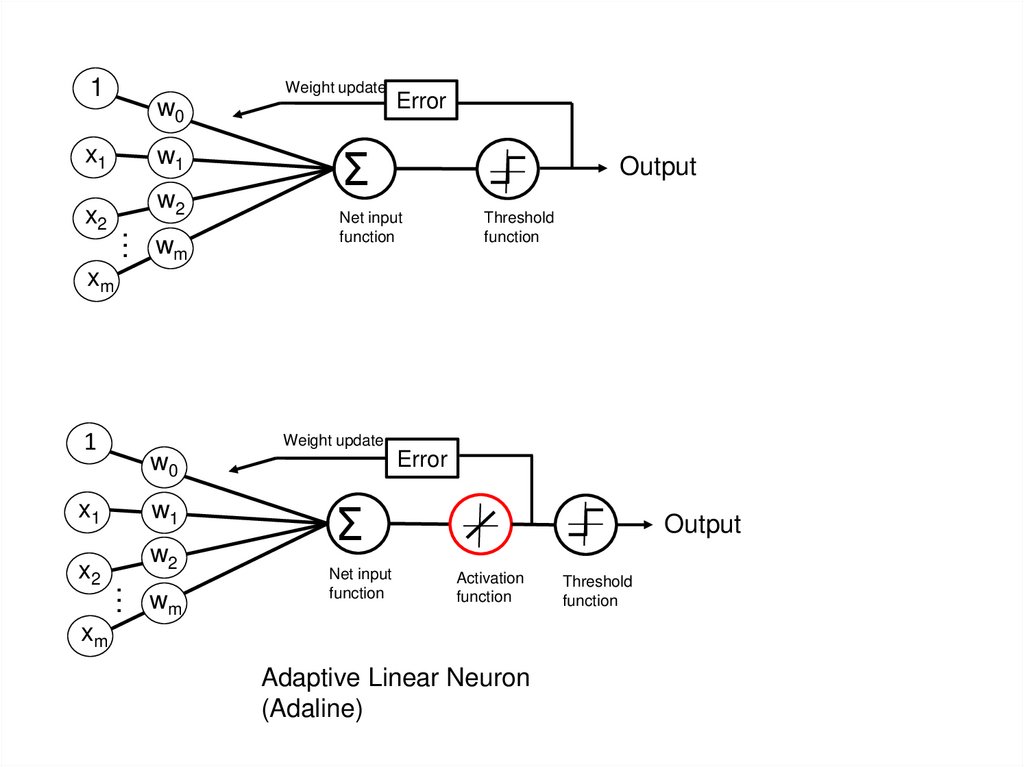
1Weight update
w0
x1
w1
x2 .
w2
.. wm
Error
Σ
Output
Net input
function
Threshold
function
xm
1
Weight update
Error
w0
x1
w1
x2 .
w2
.. wm
Σ
Net input
function
Output
Activation
function
xm
Adaptive Linear Neuron
(Adaline)
Threshold
function
8.
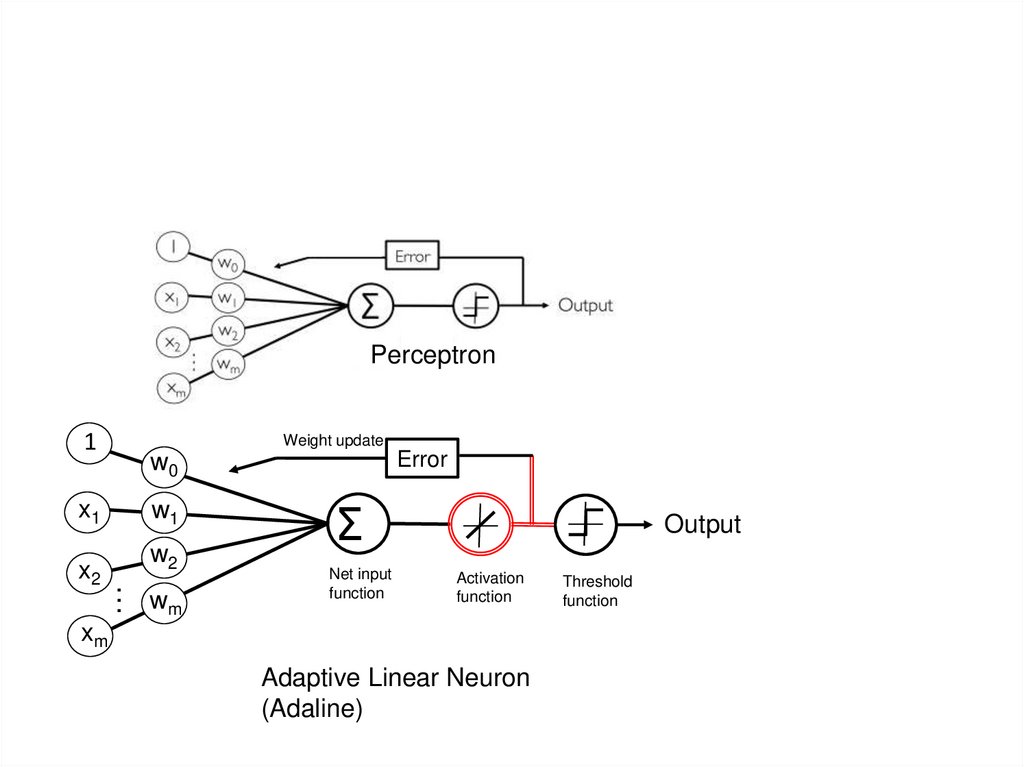
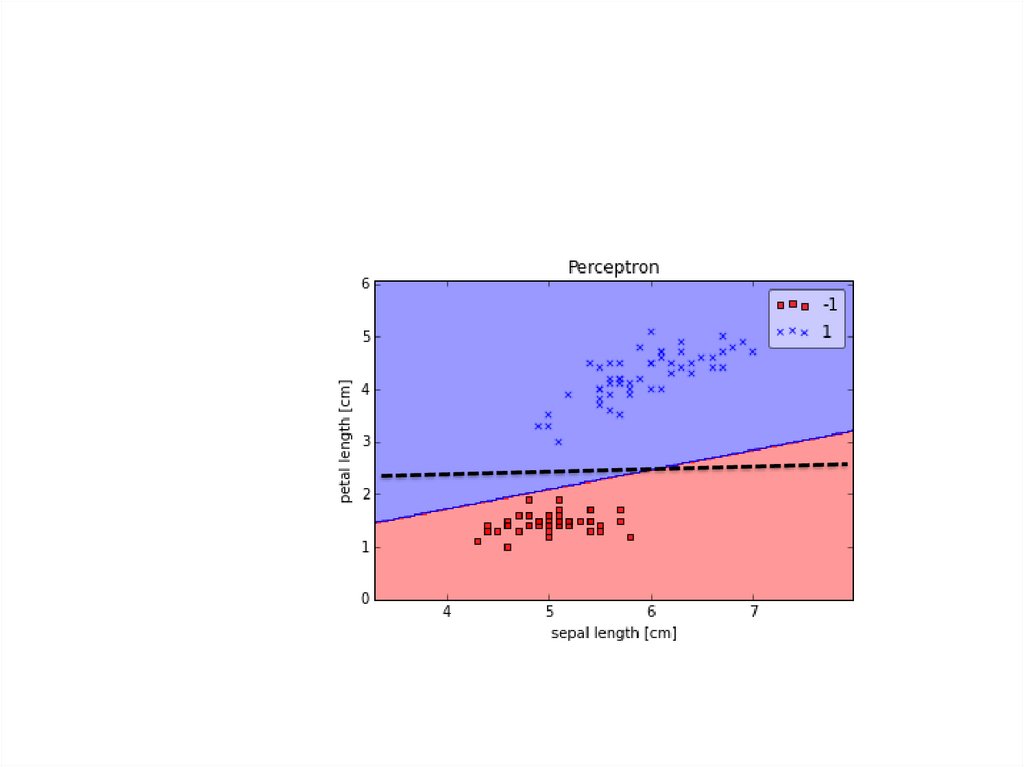
Perceptron1
Weight update
Error
w0
x1
w1
x2 .
w2
.. wm
Σ
Net input
function
Output
Activation
function
xm
Adaptive Linear Neuron
(Adaline)
Threshold
function
9.
10.
11.
12.
13.
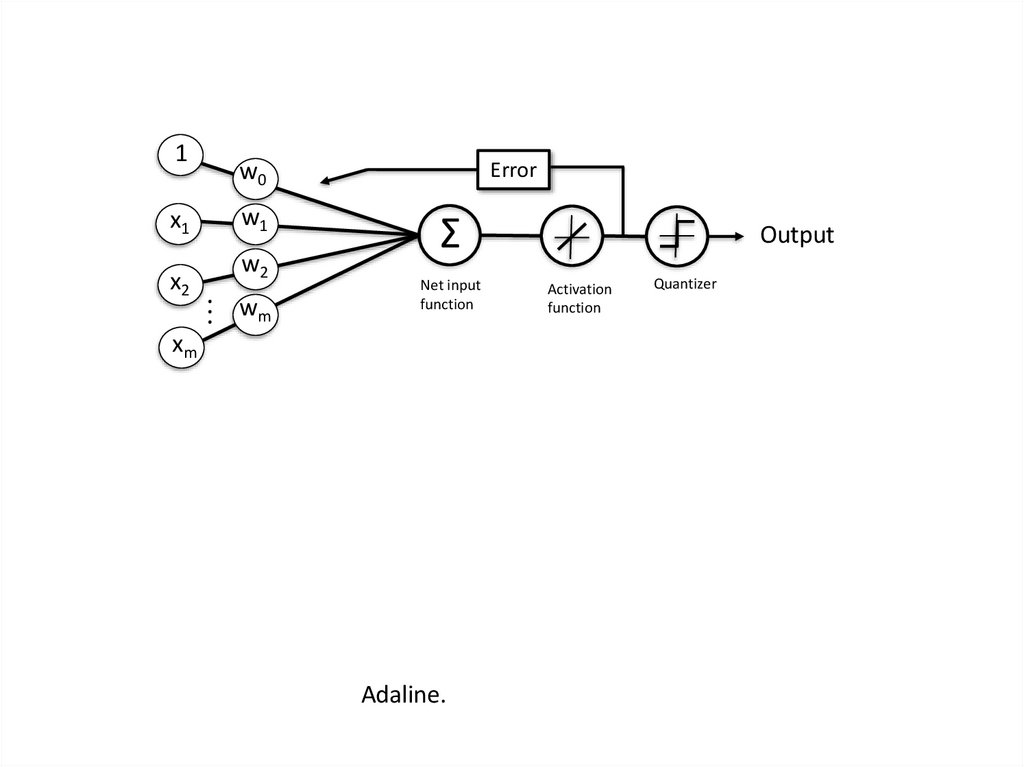
1x1
x2
w0
w1
w2
.. w
m
.
Error
Σ
Net input
function
xm
Adaline.
Output
Activation
function
Quantizer
14.
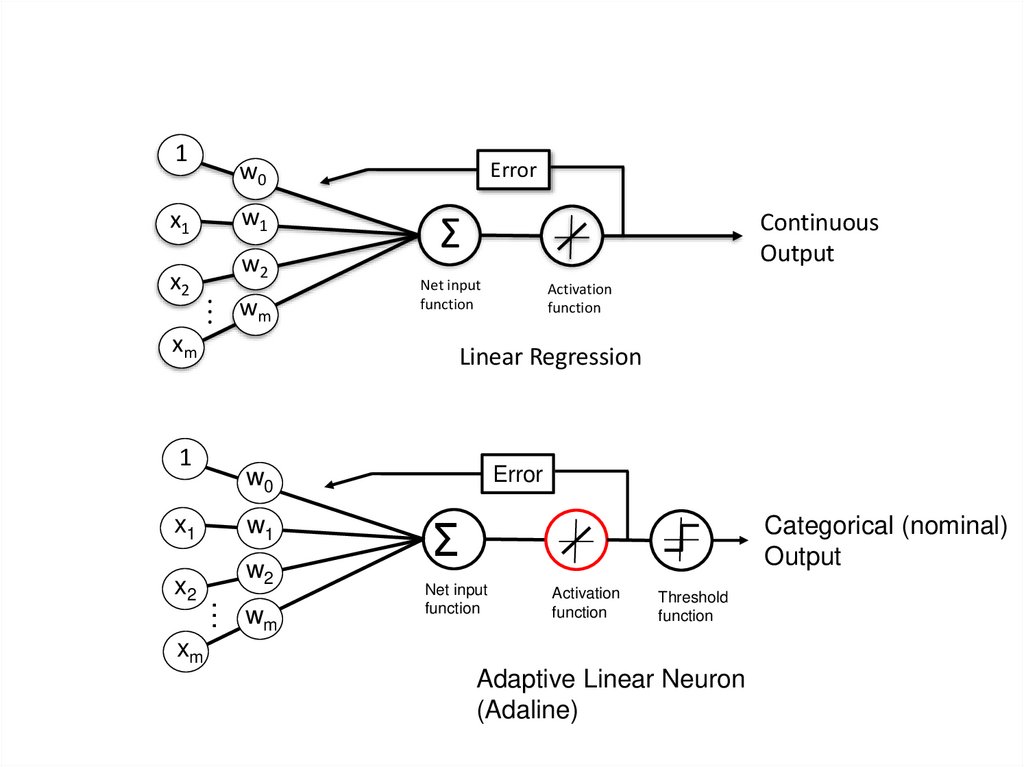
1w0
w1
x1
x2
w2
.. w
m
.
xm
Error
Continuous
Output
Σ
Net input
function
Activation
function
Linear Regression
1
Error
w0
x1
w1
x2 .
w2
.. wm
Σ
Categorical (nominal)
Output
Net input
function
Activation
function
Threshold
function
xm
Adaptive Linear Neuron
(Adaline)
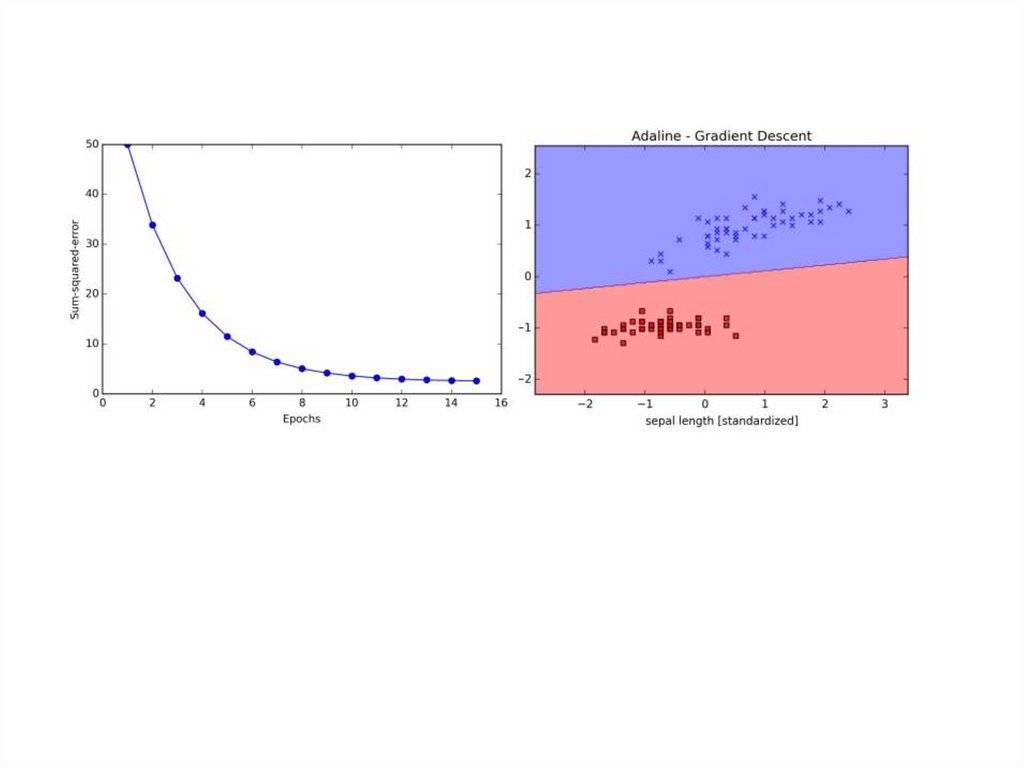
15.
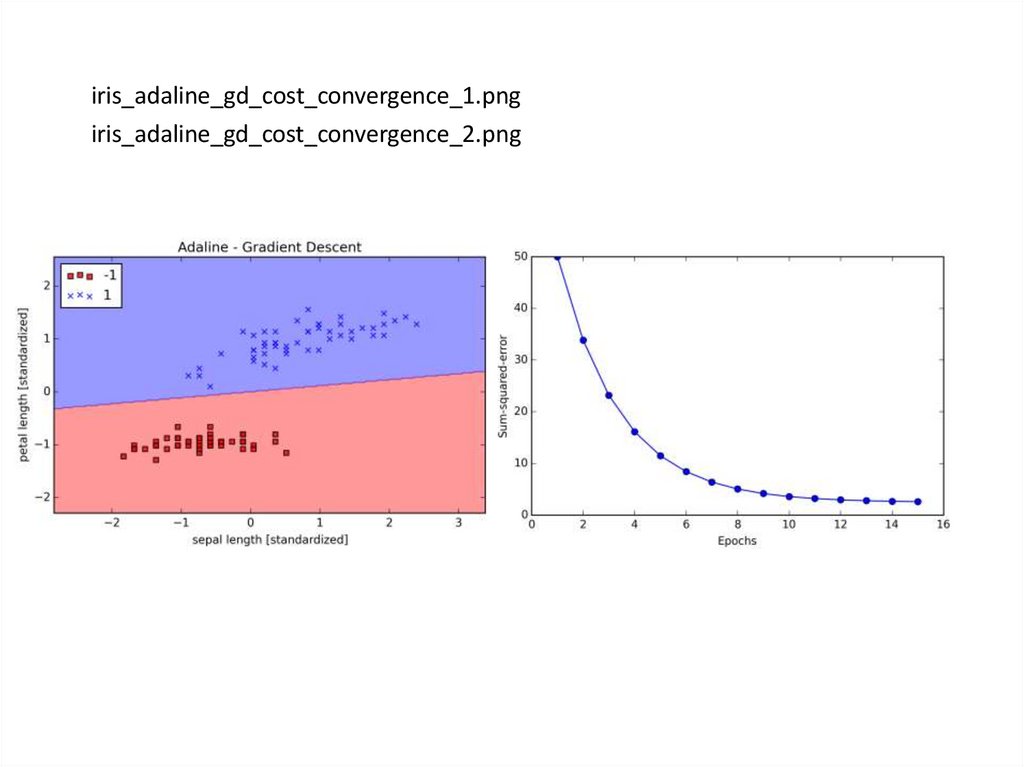
iris_adaline_gd_cost_convergence_1.pngiris_adaline_gd_cost_convergence_2.png
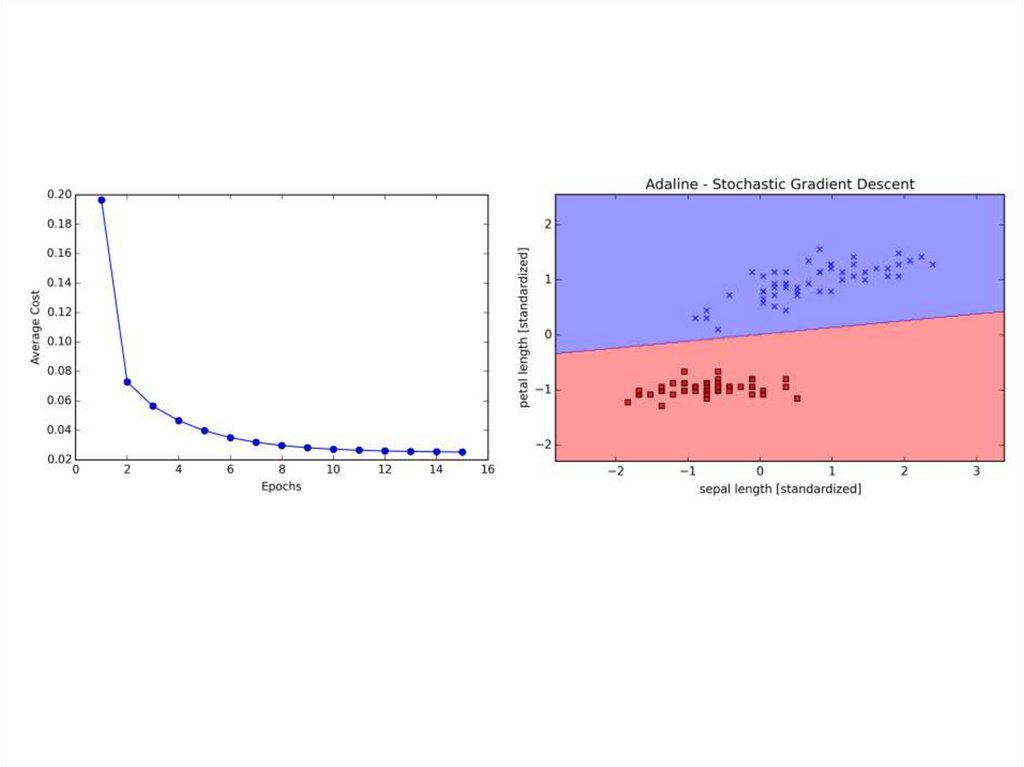
16.
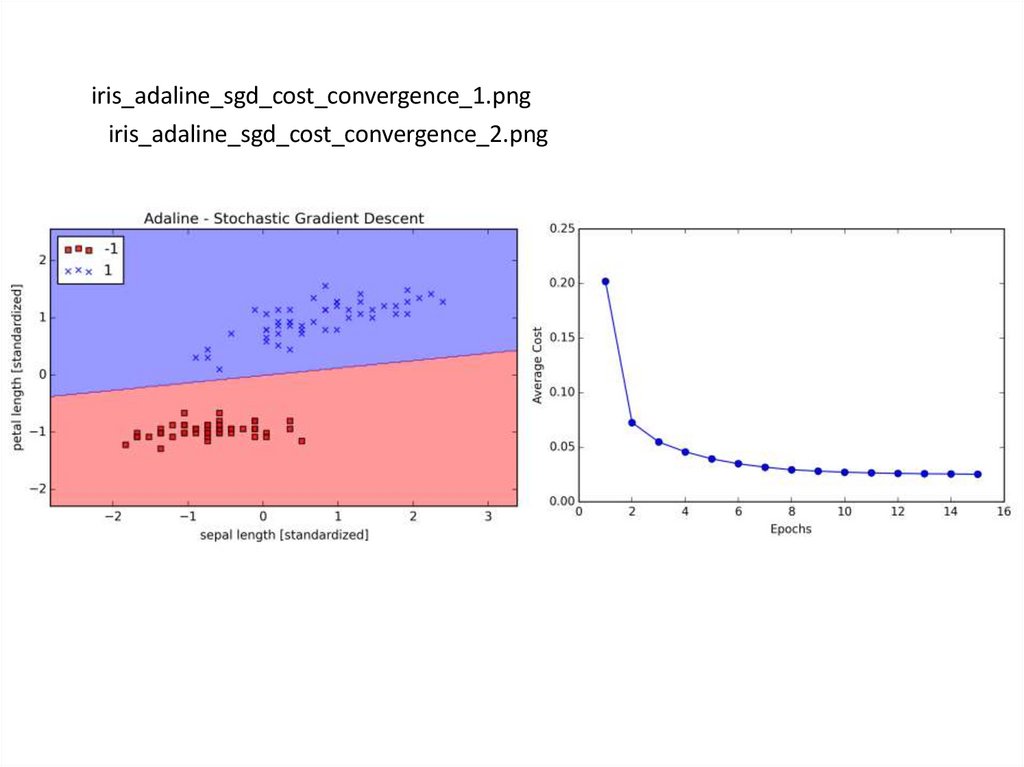
iris_adaline_sgd_cost_convergence_1.pngiris_adaline_sgd_cost_convergence_2.png
17.
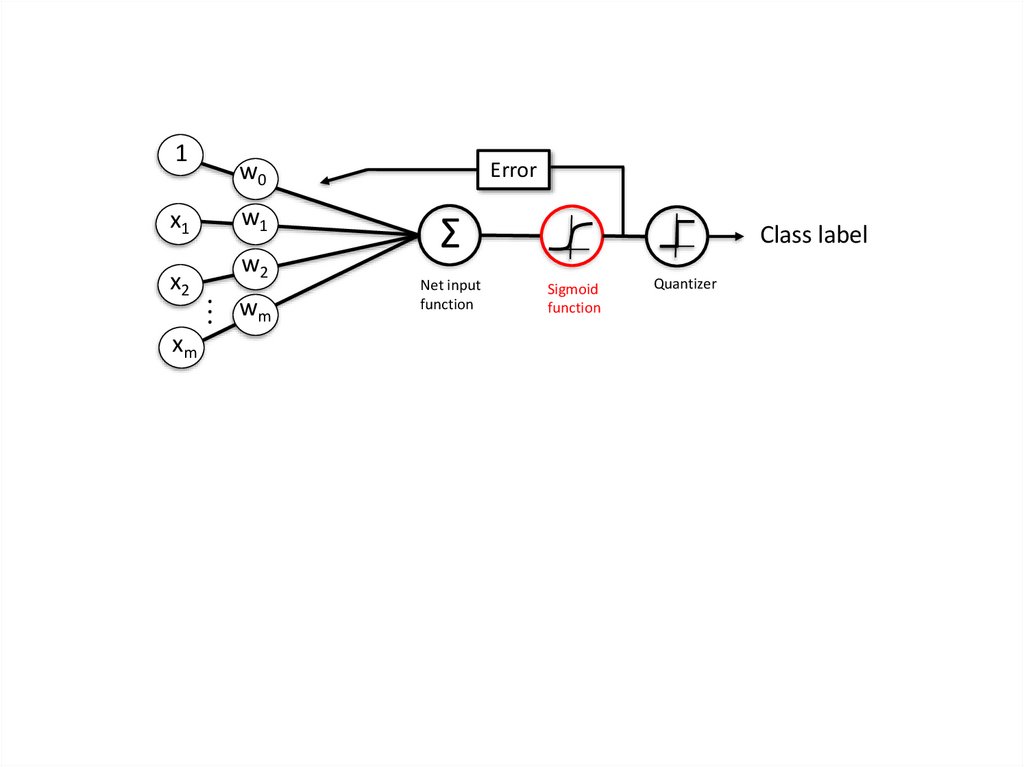
1x1
x2
xm
w0
w1
w2
.. w
m
.
Error
Σ
Net input
function
Class label
Sigmoid
function
Quantizer
18.
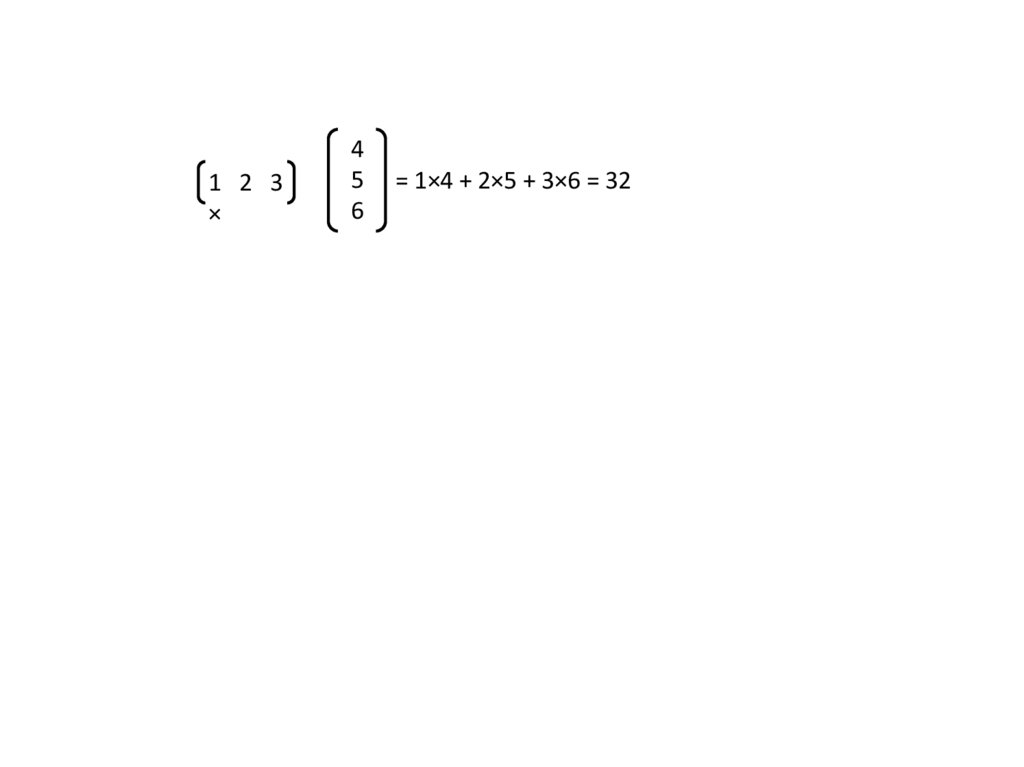
1 2 3×
4
5
6
= 1×4 + 2×5 + 3×6 = 32
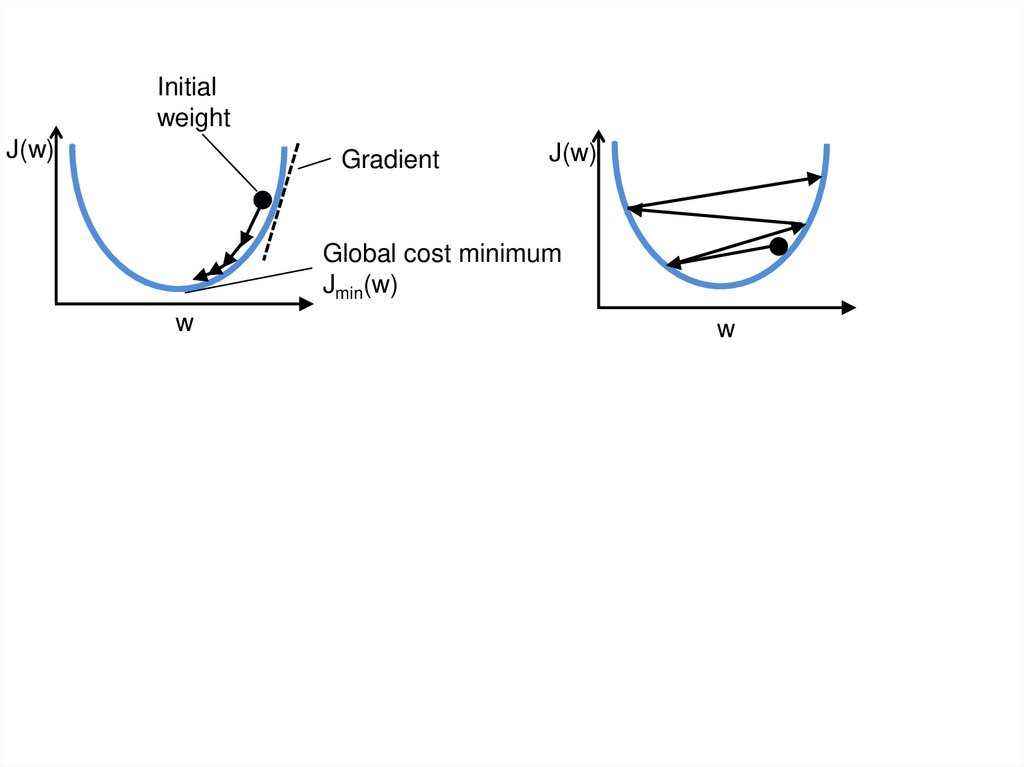
19.
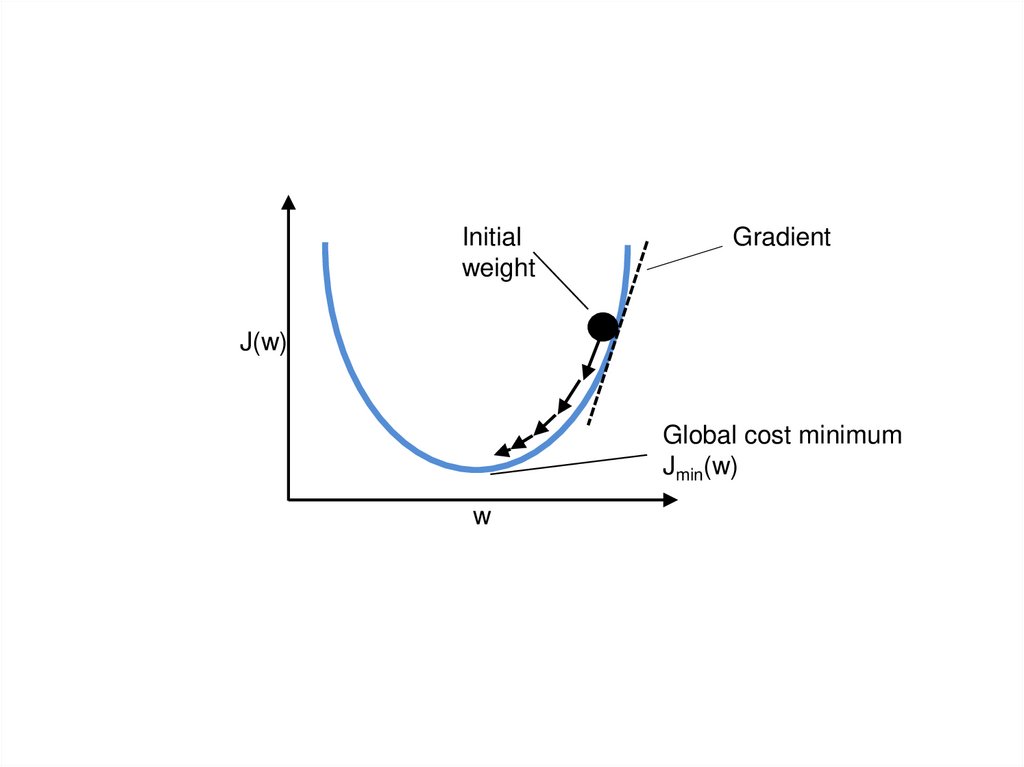
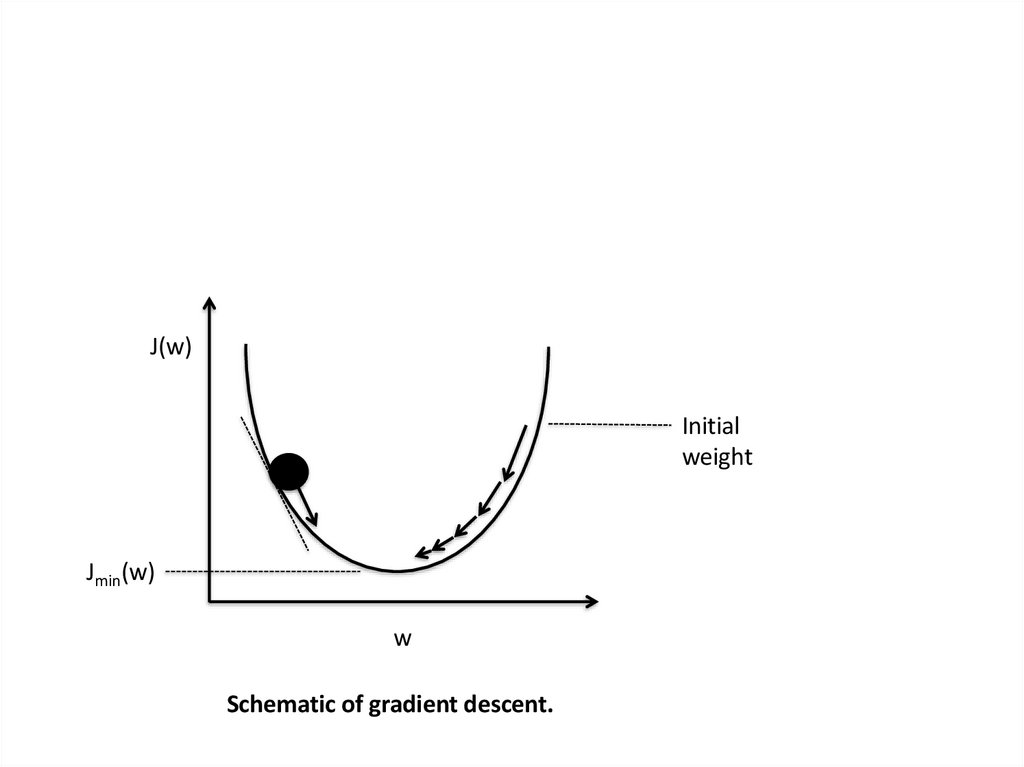
Initialweight
Gradient
J(w)
Global cost minimum
Jmin(w)
w
20.
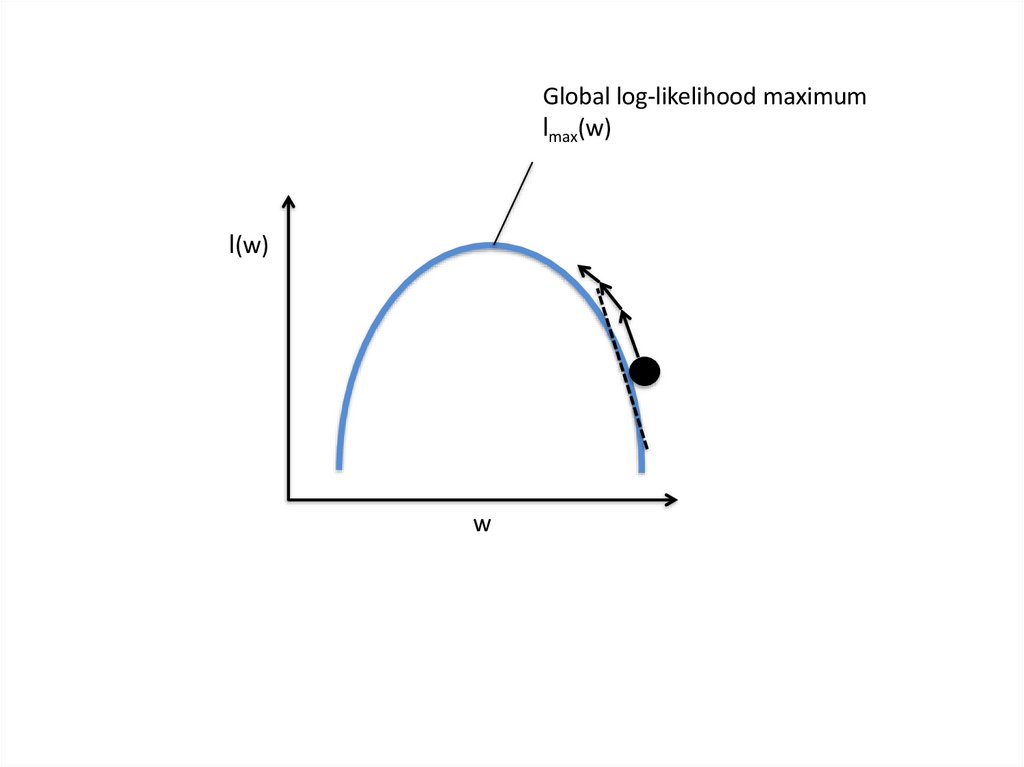
Global log-likelihood maximumlmax(w)
l(w)
w
21.
Initialweight
J(w)
Gradient
J(w)
Global cost minimum
Jmin(w)
w
w
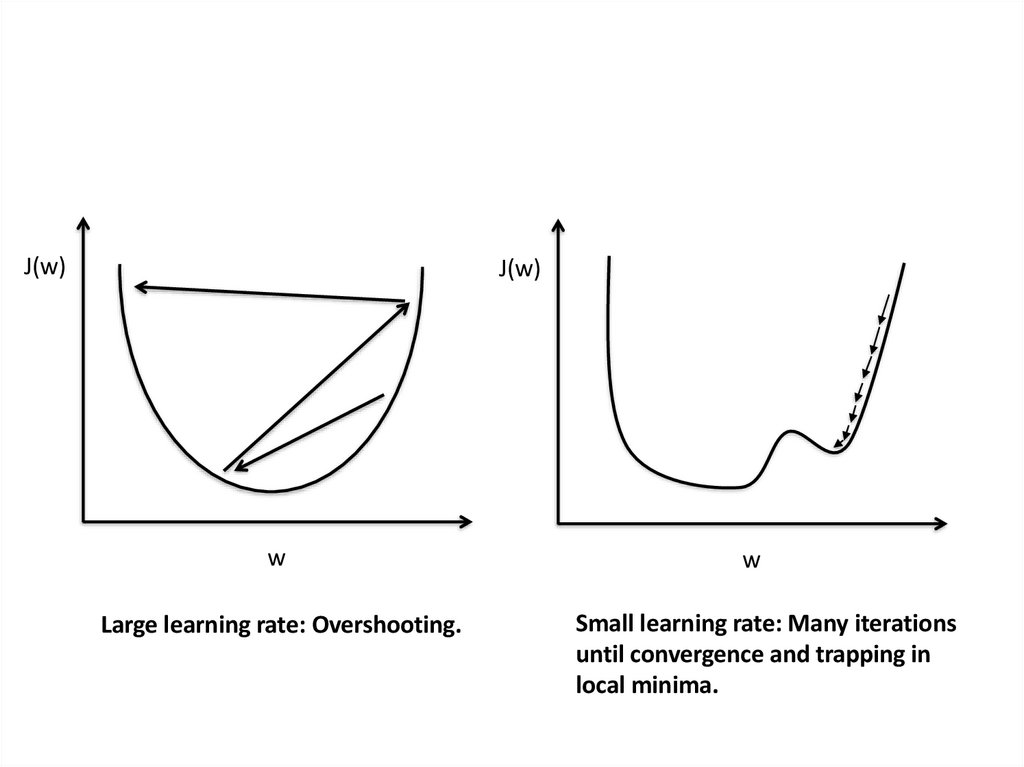
22.
J(w)J(w)
w
w
Large learning rate: Overshooting.
Small learning rate: Many iterations
until convergence and trapping in
local minima.
23.
24.
25.
26.
27.
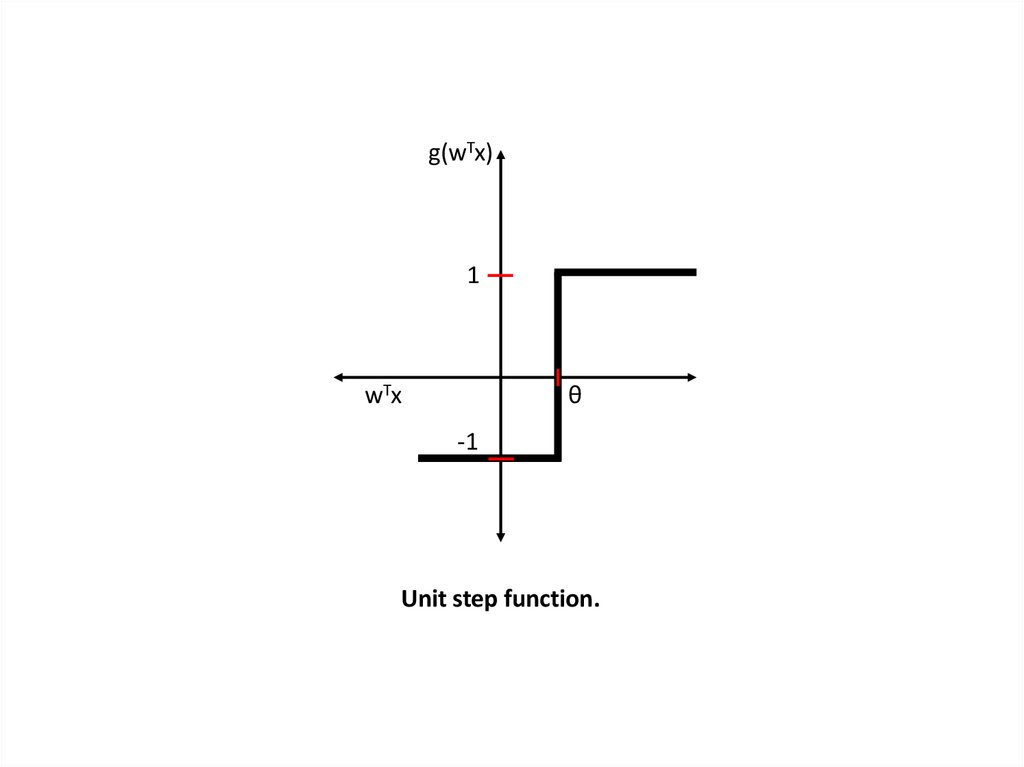
g(wTx)1
wTx
θ
-1
Unit step function.
28.
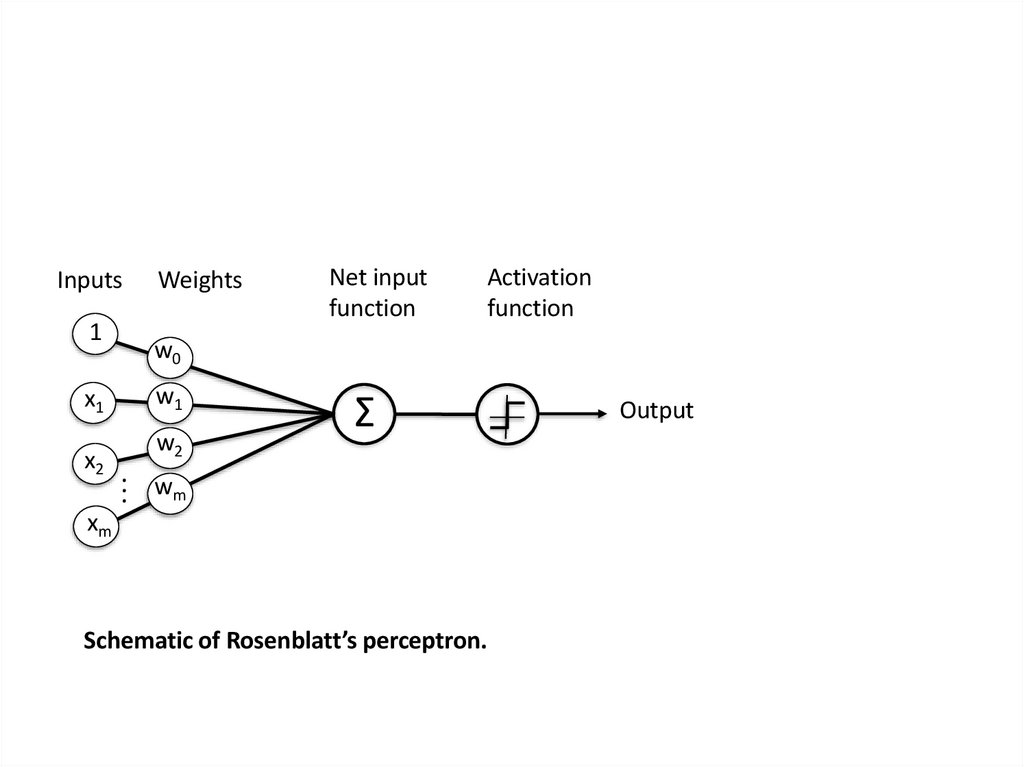
Inputs1
x1
x2
Weights
Net input
function
Activation
function
w0
w1
w2
Σ
.. w
m
.
xm
Schematic of Rosenblatt’s perceptron.
Output
29.
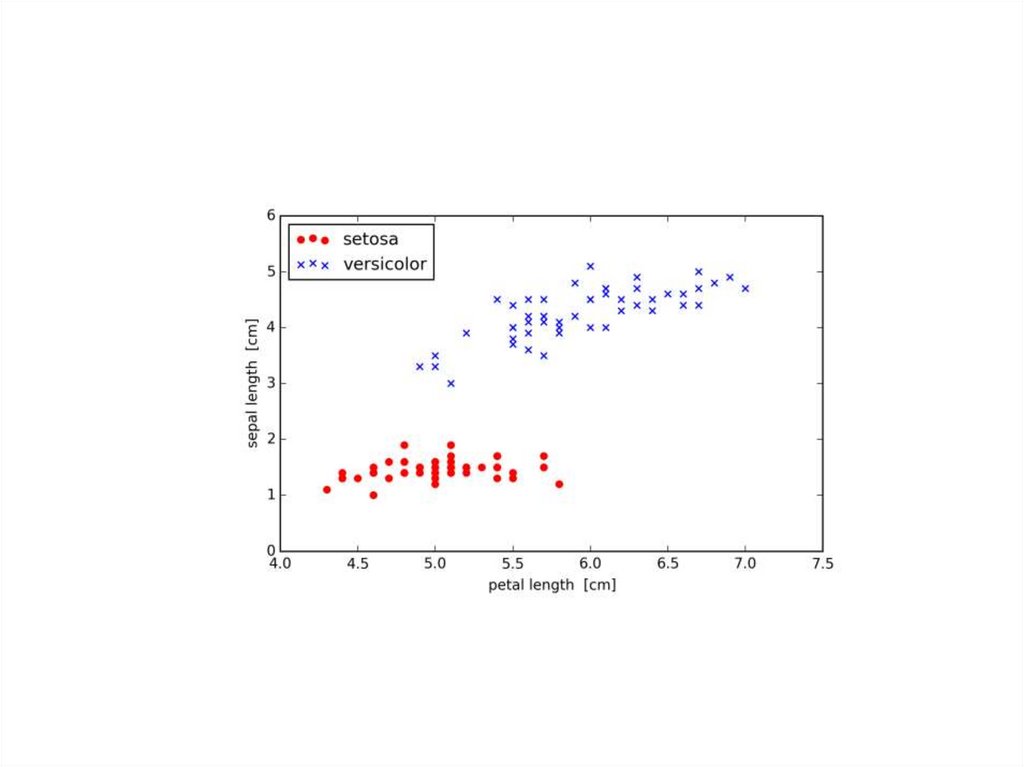
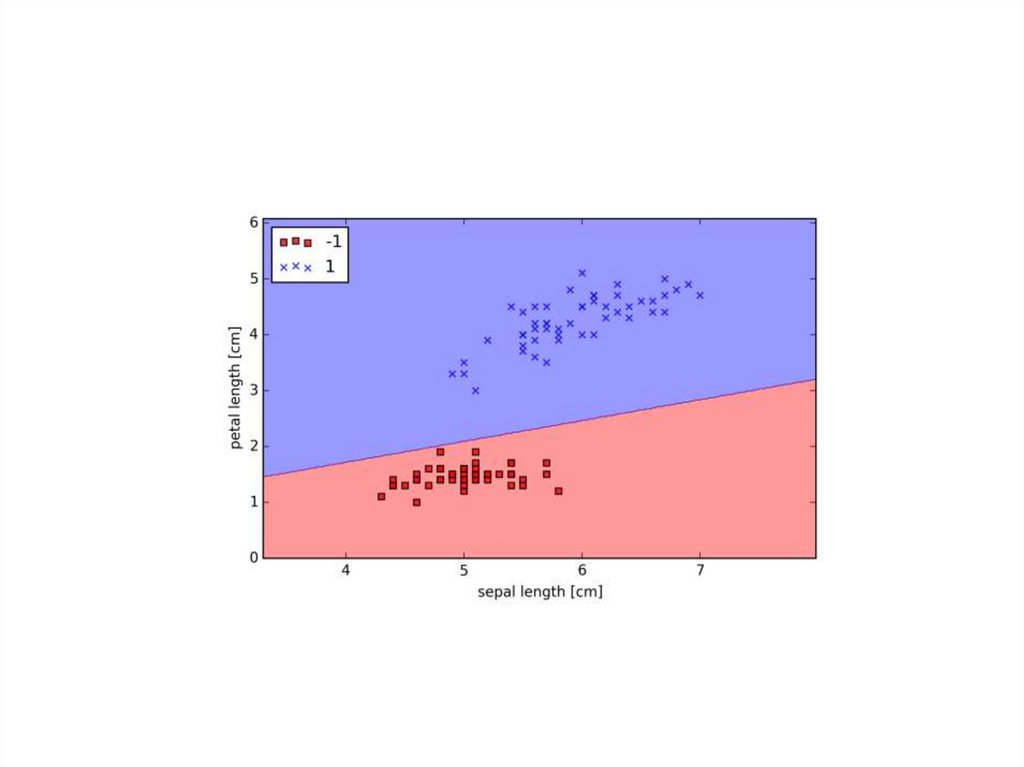
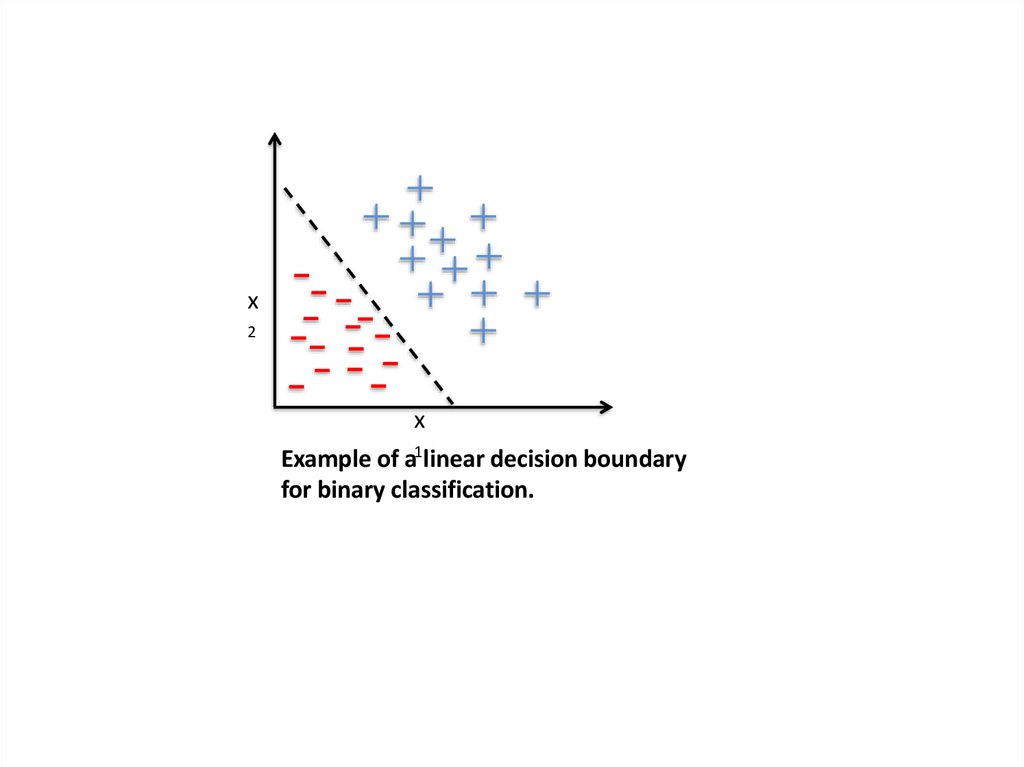
x2
x
Example of a1linear decision boundary
for binary classification.
30.
31.
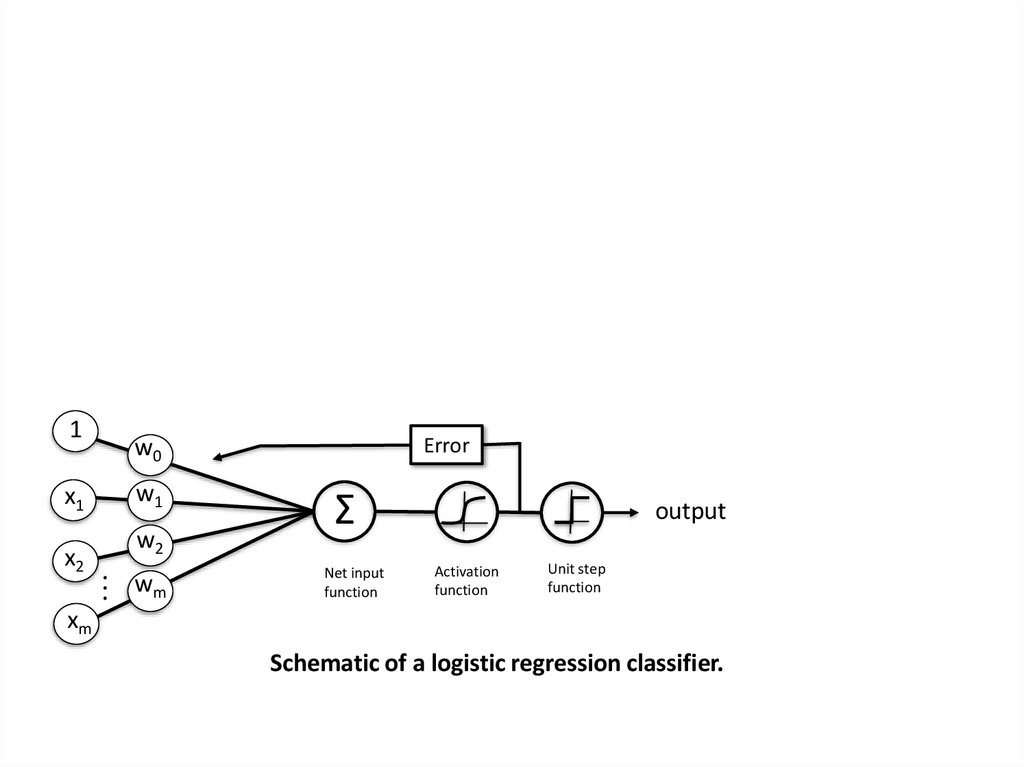
1x1
x2
Error
w0
w1
w2
.. w
m
.
Σ
Net input
function
output
Activation
function
Unit step
function
xm
Schematic of a logistic regression classifier.
32.
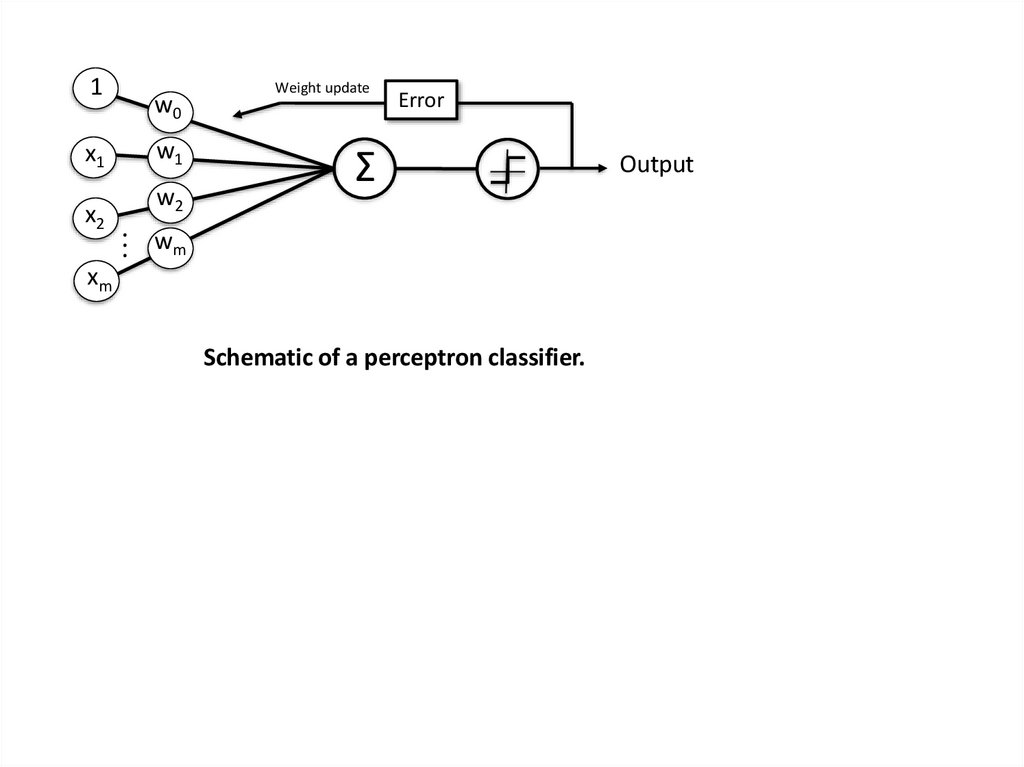
1x1
x2
w0
w1
w2
Weight update
Error
Σ
.. w
m
.
xm
Schematic of a perceptron classifier.
Output
33.
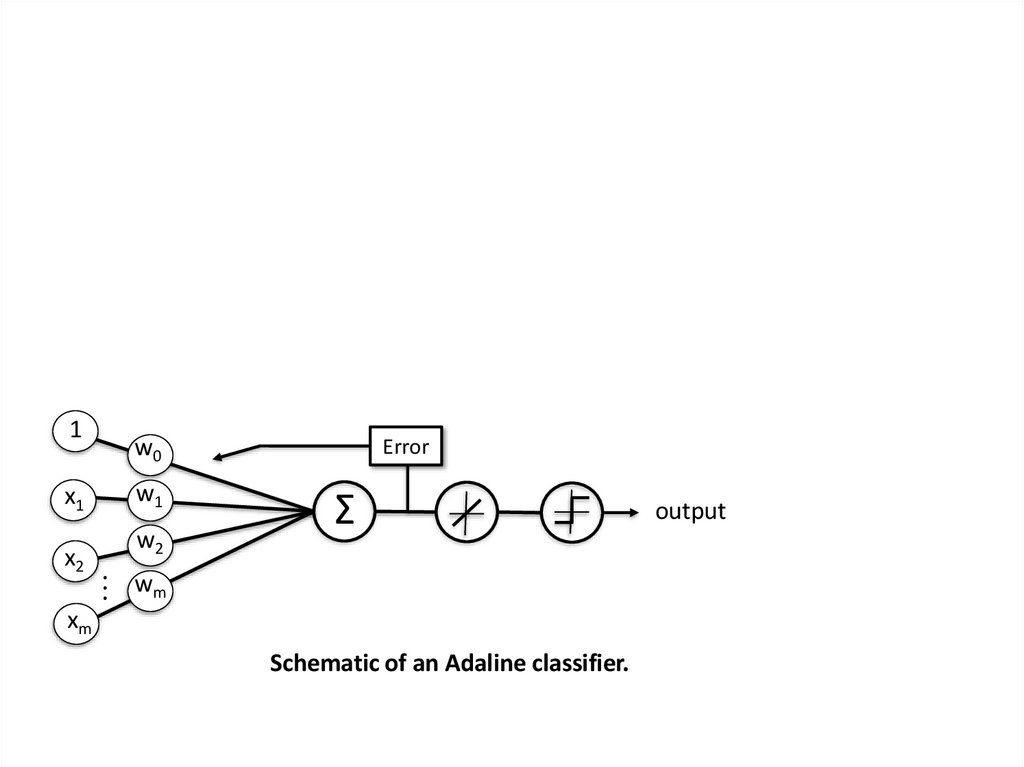
1x1
x2
w0
w1
w2
Error
Σ
.. w
m
.
xm
Schematic of an Adaline classifier.
output
34.
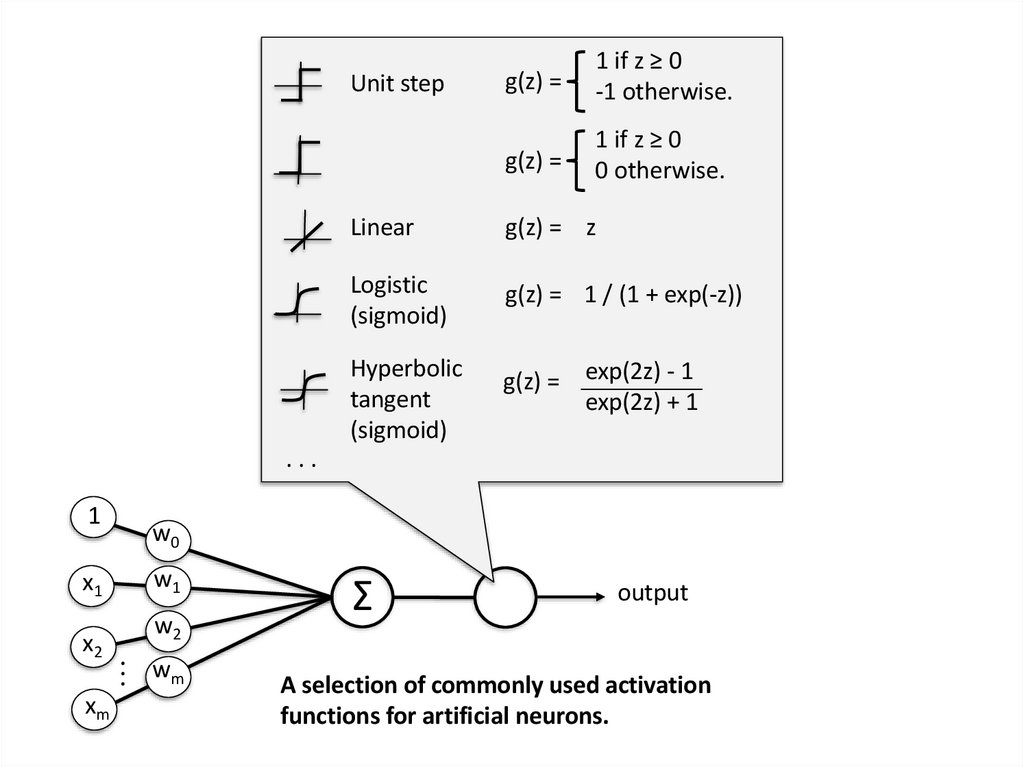
Unit stepg(z) =
1 if z ≥ 0
-1 otherwise.
g(z) =
1 if z ≥ 0
0 otherwise.
Linear
g(z) = z
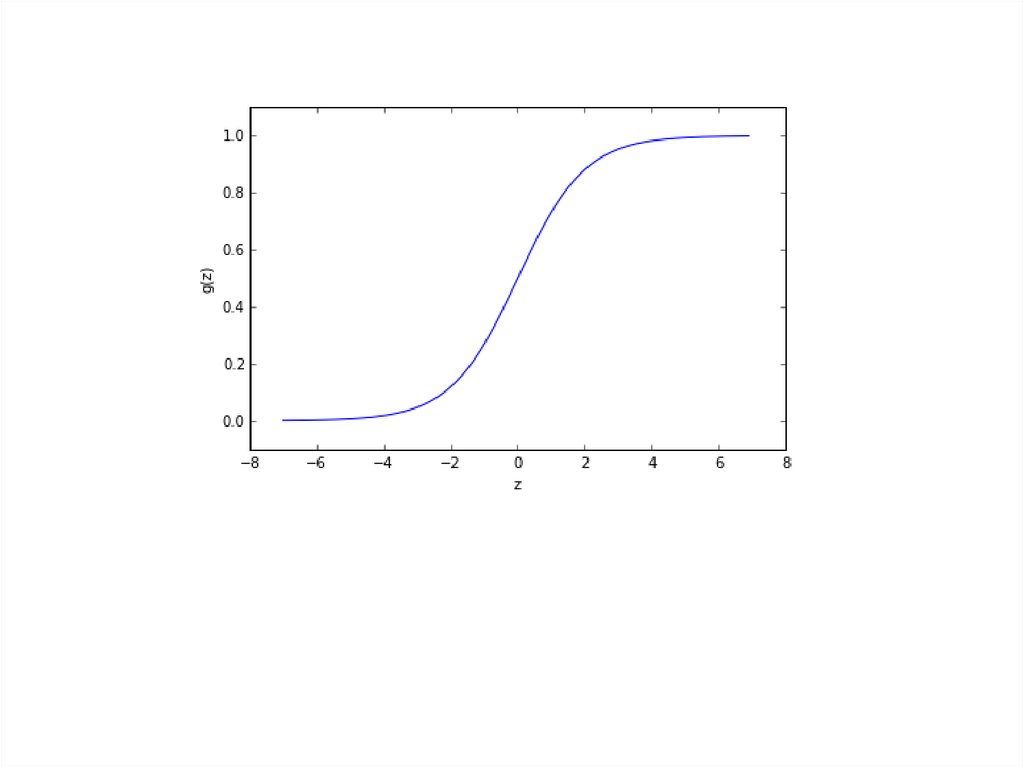
Logistic
(sigmoid)
g(z) = 1 / (1 + exp(-z))
Hyperbolic
tangent
(sigmoid)
g(z) = exp(2z) - 1
exp(2z) + 1
...
1
x1
x2
xm
w0
w1
w2
.. w
m
.
Σ
output
A selection of commonly used activation
functions for artificial neurons.
35.
36.
J(w)Initial
weight
Jmin(w)
w
Schematic of gradient descent.
37.
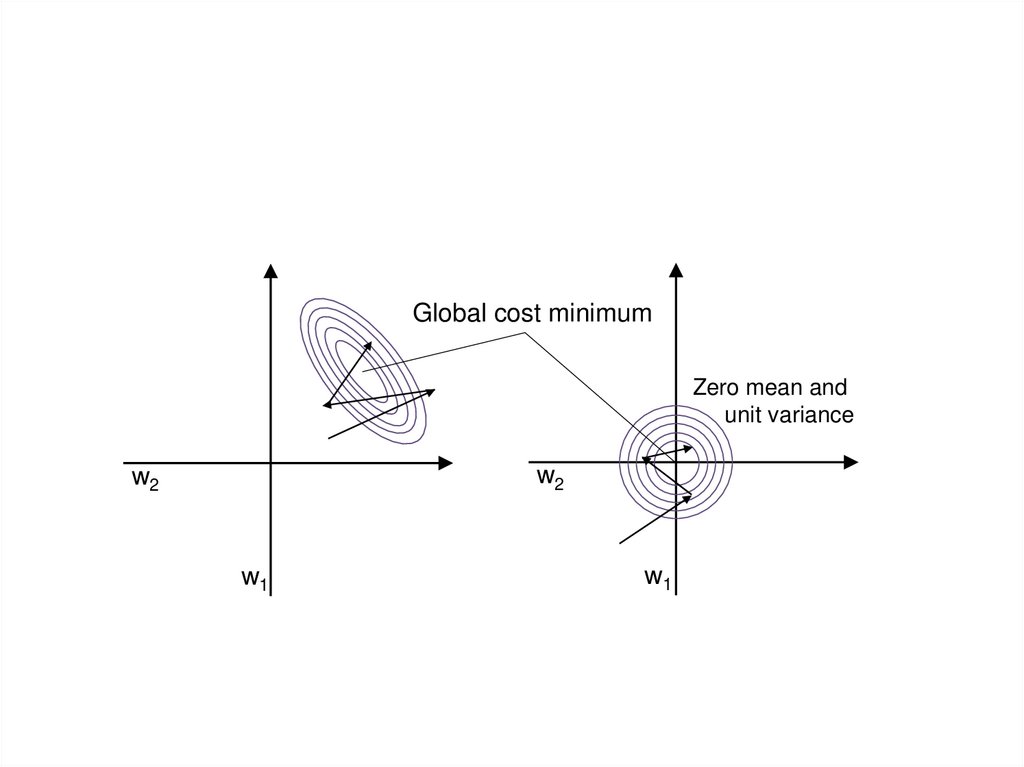
Global cost minimumZero mean and
unit variance
w2
w2
w1
w1