
 mathematics
Similar presentations:


")


")
Describing comparative graphs
1.
Describing comparativegraphs.
2.
Assessment criteria:• Task achievement
• Coherence and cohesion
• Lexical resource
• Grammatical range and accuracy
3.
Task 1 structure:• Introduction – what is the graph about?
• Overview – what are the main features of the graph?
• Detail paragraph 1
• Detail paragraph 2
• Detail paragraph 3 (if needed)
4.
What to consider before starting towrite?
• 1. what to include in the overview.
• 2. how to group data.
• 3. how to organize each paragraph.
5.
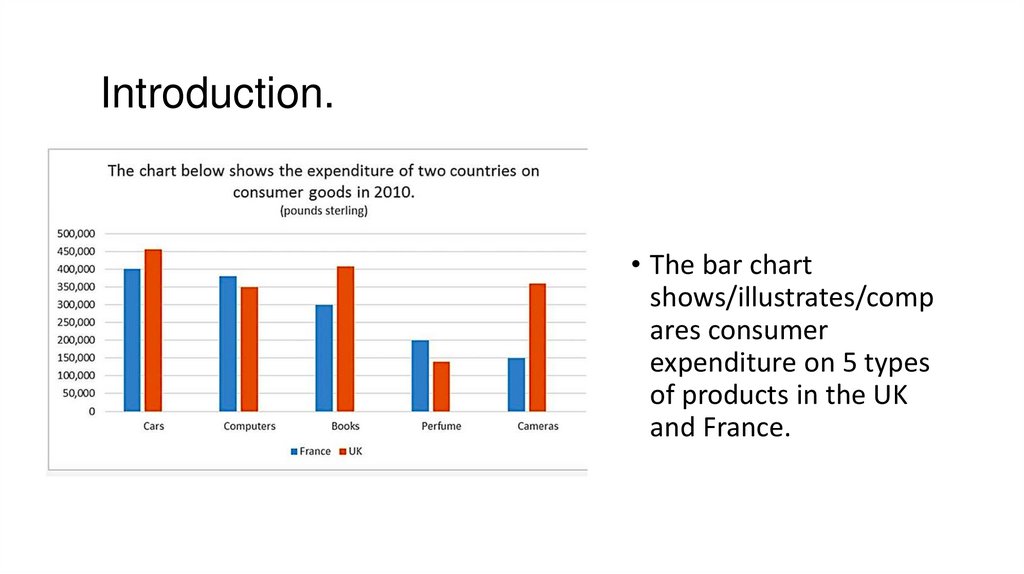
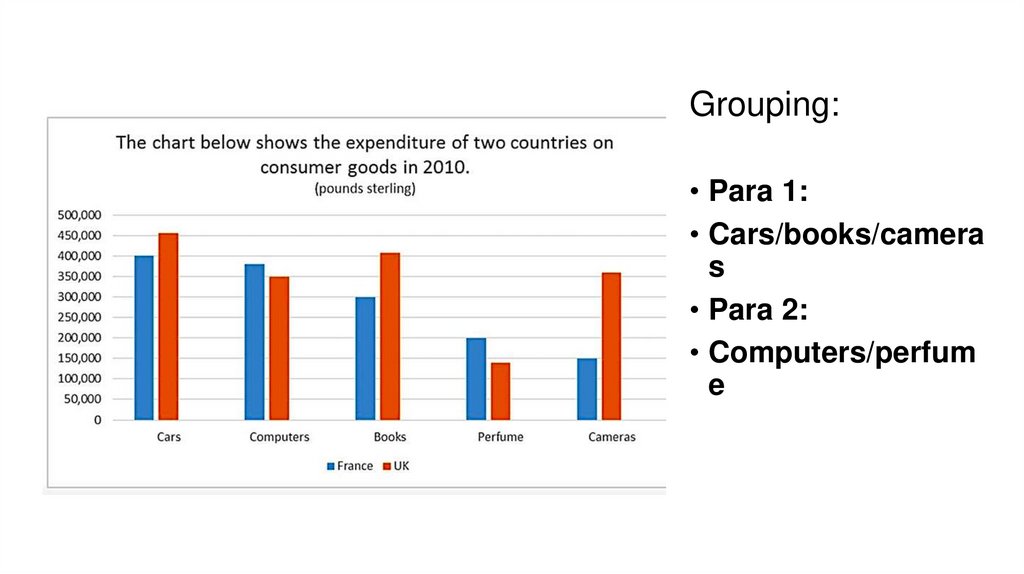
Introduction.• The bar chart
shows/illustrates/comp
ares consumer
expenditure on 5 types
of products in the UK
and France.
6.
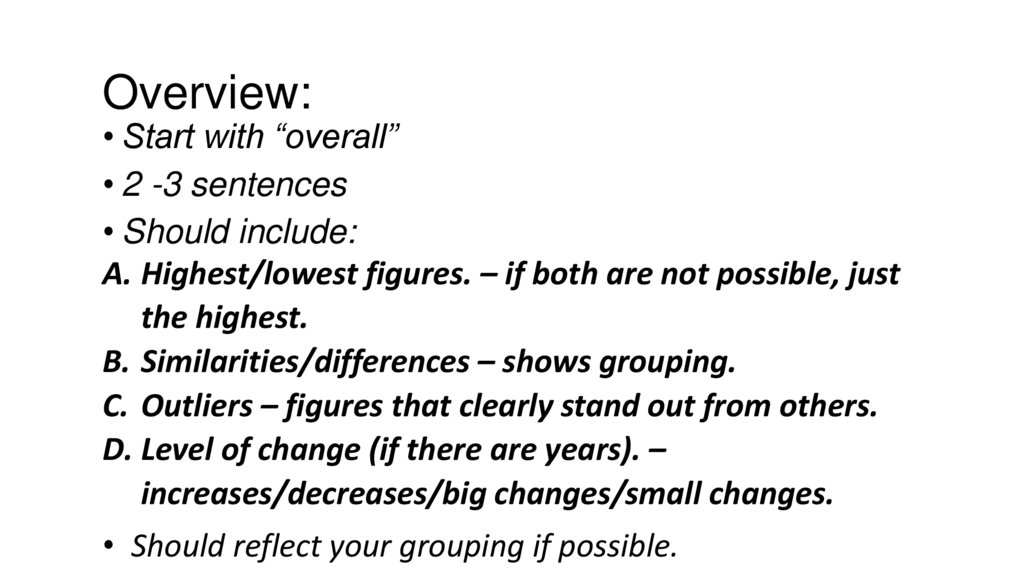
Overview:• Start with “overall”
• 2 -3 sentences
• Should include:
A. Highest/lowest figures. – if both are not possible, just
the highest.
B. Similarities/differences – shows grouping.
C. Outliers – figures that clearly stand out from others.
D. Level of change (if there are years). –
increases/decreases/big changes/small changes.
• Should reflect your grouping if possible.
7.
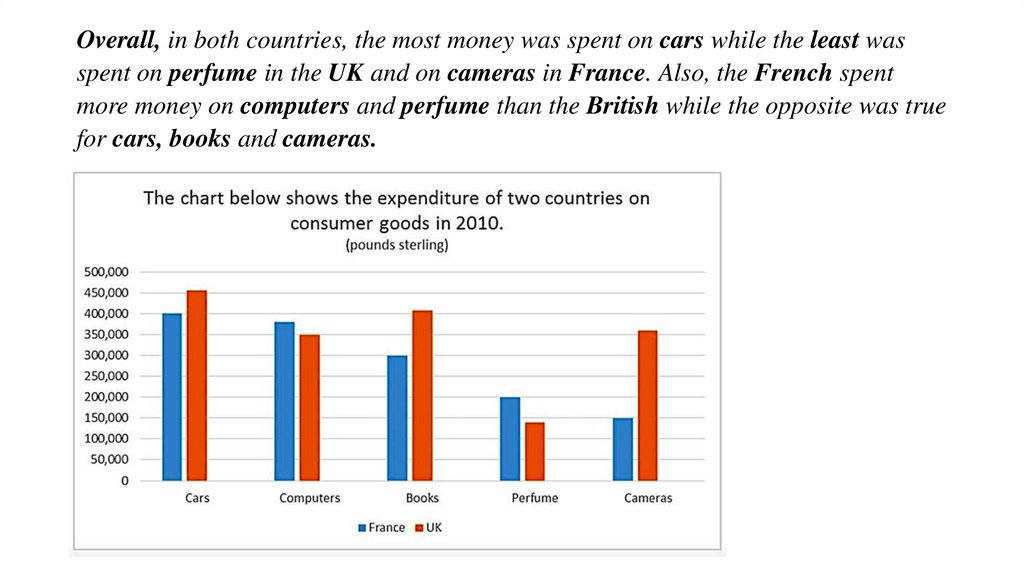
Overall, in both countries, the most money was spent on cars while the least wasspent on perfume in the UK and on cameras in France. Also, the French spent
more money on computers and perfume than the British while the opposite was true
for cars, books and cameras.
8.
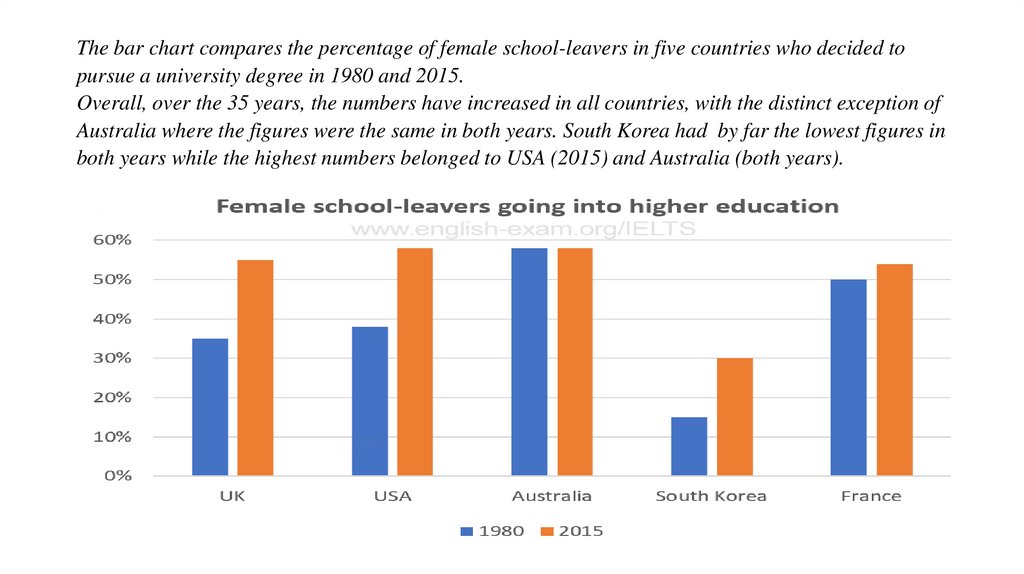
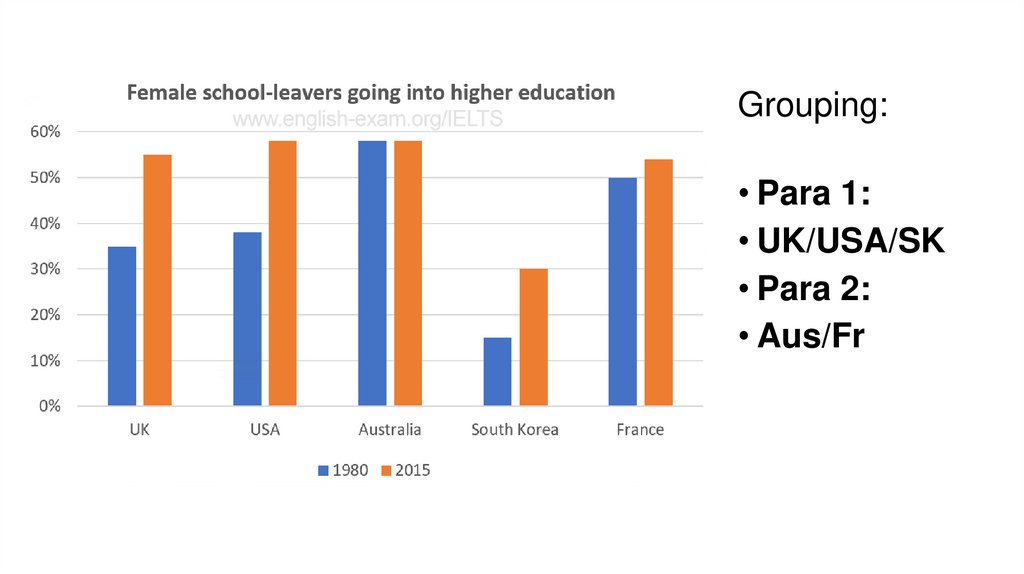
The bar chart compares the percentage of female school-leavers in five countries who decided topursue a university degree in 1980 and 2015.
Overall, over the 35 years, the numbers have increased in all countries, with the distinct exception of
Australia where the figures were the same in both years. South Korea had by far the lowest figures in
both years while the highest numbers belonged to USA (2015) and Australia (both years).
9.
Grouping:• Para 1:
• Cars/books/camera
s
• Para 2:
• Computers/perfum
e
10.
Grouping:• Para 1:
• UK/USA/SK
• Para 2:
• Aus/Fr
11.
Organization within a paragraph.• General (topic) sentence? – optional
• Describe similar figures together.
• Describe different figures separately in order of
degree. (biggest to smallest or vice verse)
12.
What is the problem with the followingparagraph?
•The UK spent $ 450 000 on cars while
France spent $ 400 000. The spending on
books was $400 000 in the UK and $ 300
000 in France. Finally, the expenditure on
cameras was $350 000 and $150 000
respectively.
13.
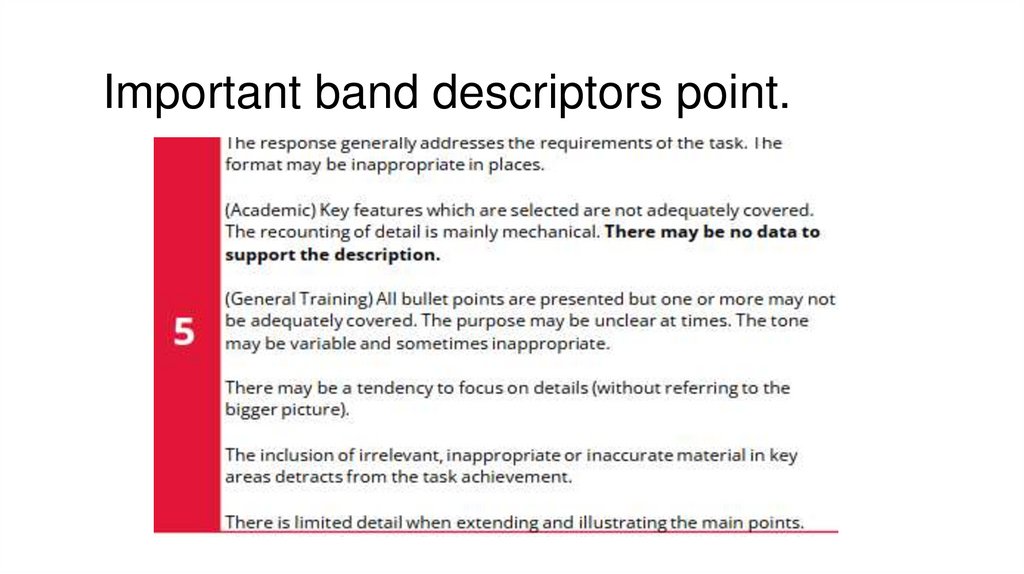
Important band descriptors point.14.
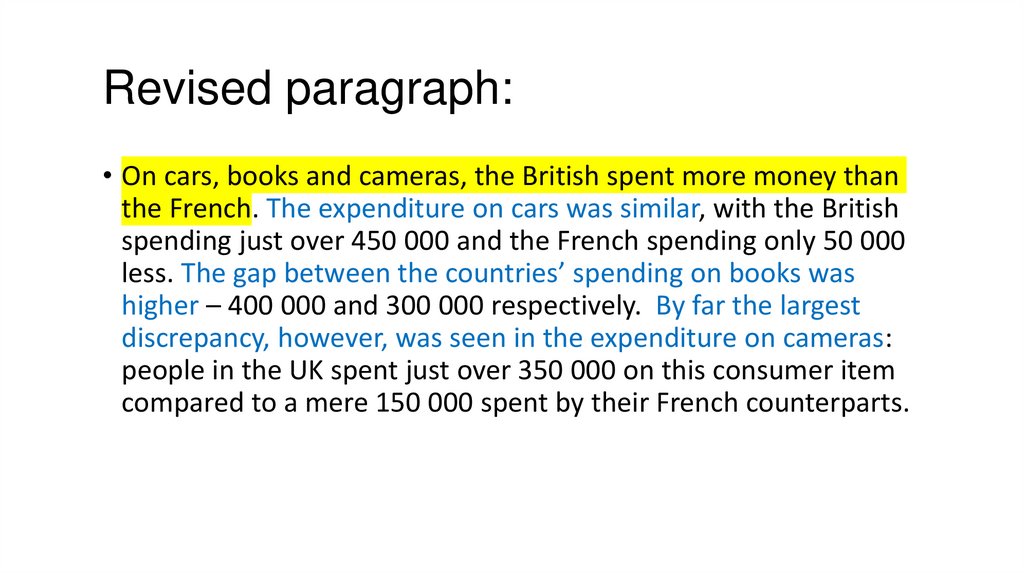
Revised paragraph:• On cars, books and cameras, the British spent more money than
the French. The expenditure on cars was similar, with the British
spending just over 450 000 and the French spending only 50 000
less. The gap between the countries’ spending on books was
higher – 400 000 and 300 000 respectively. By far the largest
discrepancy, however, was seen in the expenditure on cameras:
people in the UK spent just over 350 000 on this consumer item
compared to a mere 150 000 spent by their French counterparts.
15.
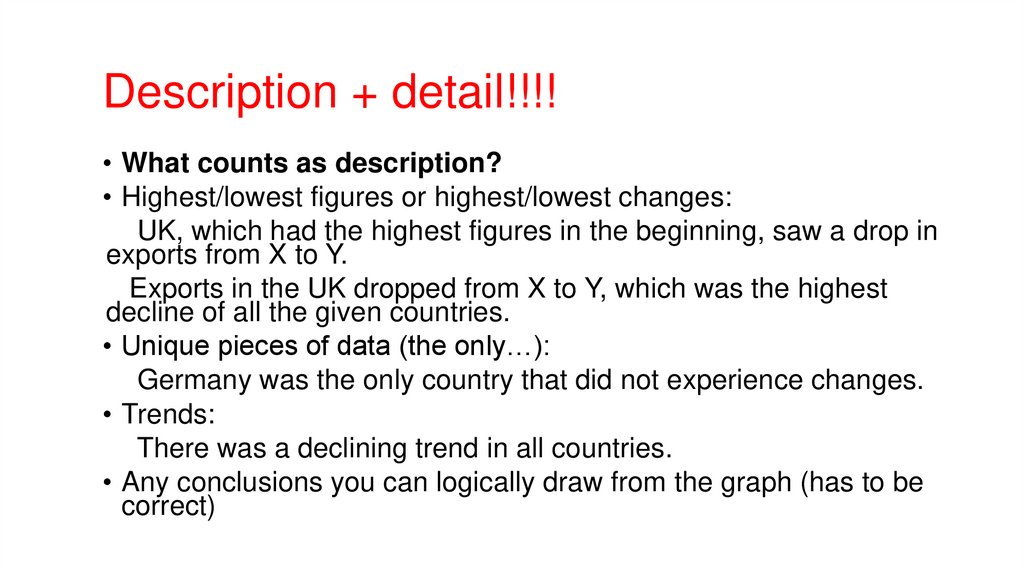
Description + detail!!!!• What counts as description?
• Highest/lowest figures or highest/lowest changes:
UK, which had the highest figures in the beginning, saw a drop in
exports from X to Y.
Exports in the UK dropped from X to Y, which was the highest
decline of all the given countries.
• Unique pieces of data (the only…):
Germany was the only country that did not experience changes.
• Trends:
There was a declining trend in all countries.
• Any conclusions you can logically draw from the graph (has to be
correct)
16.
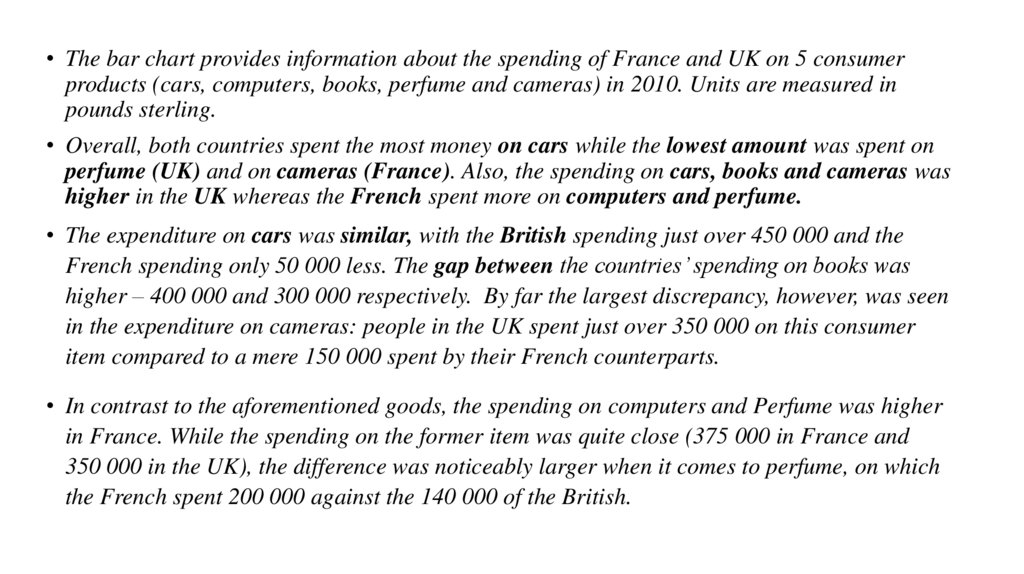
• The bar chart provides information about the spending of France and UK on 5 consumerproducts (cars, computers, books, perfume and cameras) in 2010. Units are measured in
pounds sterling.
• Overall, both countries spent the most money on cars while the lowest amount was spent on
perfume (UK) and on cameras (France). Also, the spending on cars, books and cameras was
higher in the UK whereas the French spent more on computers and perfume.
• The expenditure on cars was similar, with the British spending just over 450 000 and the
French spending only 50 000 less. The gap between the countries’ spending on books was
higher – 400 000 and 300 000 respectively. By far the largest discrepancy, however, was seen
in the expenditure on cameras: people in the UK spent just over 350 000 on this consumer
item compared to a mere 150 000 spent by their French counterparts.
• In contrast to the aforementioned goods, the spending on computers and Perfume was higher
in France. While the spending on the former item was quite close (375 000 in France and
350 000 in the UK), the difference was noticeably larger when it comes to perfume, on which
the French spent 200 000 against the 140 000 of the British.
17.
Lesson recap:• How to write introductions.
• How to write overview and select the main features.
• How to group data.
• To organize detail paragraphs.
• The importance of details and descriptions.