
 informatics
Similar presentations:


Common Mistakes in Data Interpretation
1.
Common Mistakes in DataInterpretation
Data interpretation is crucial for informed decisions. Understanding common
pitfalls can improve accuracy. This presentation highlights frequent errors in
data analysis. We'll explore practical examples and solutions.
by S AIDIS L OM S ultonov
2.
Introduction: Why Data InterpretationMatters
Accurate data interpretation leads to better strategies. Avoid flawed conclusions and wasted resources. Solid analysis informs
impactful decisions. E ffective interpretation fosters innovation and insights. It transforms raw data into actionable knowledge.
E nhance your analytical skills.
3.
Mistake #1: IgnoringContext and Assumptions
Failing to acknowledge background information skews results.
Understanding data origin and limitations is essential. Always question your
assumptions.
4.
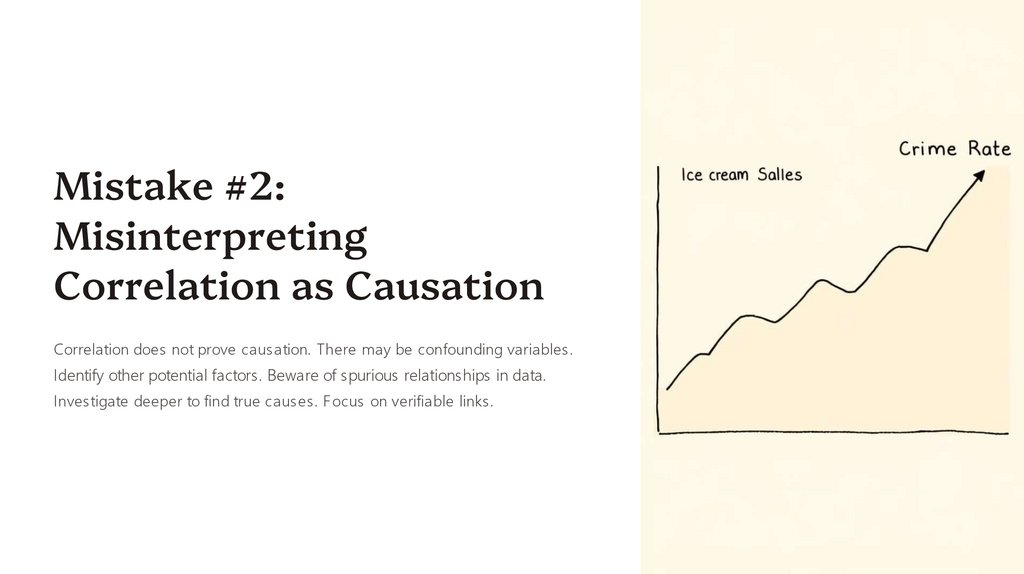
Mistake #2:Misinterpreting
Correlation as Causation
Correlation does not prove causation. There may be confounding variables.
Identify other potential factors. Beware of spurious relationships in data.
Investigate deeper to find true causes. Focus on verifiable links.
5.
Mistake #3: OverfittingModels to Data
Overfitting leads to poor generalization on new data. Keep models simple
and validate rigorously. Strive for robust predictions.
6.
Mistake #4: CherryPicking Data to Support aPreconceived Notion
Selecting data to confirm bias distorts reality. Objectivity is key to sound
interpretation. E xamine all available data. Avoid confirmation bias by
challenging your own hypotheses. Seek evidence that contradicts your
assumptions. Promote unbiased results.
7.
Mistake #5: Failing to Consider Sample Sizeand Bias
Small sample sizes yield unreliable conclusions. Account for sampling bias and its impact. Ensure sufficient data for analysis.
Understand how bias affects the representativeness of the sample. Evaluate the generalizability of your findings. Verify sample
validity.
8.
Mistake #6: NeglectingVisualizations and Data
Storytelling
Visualizations enhance understanding and reveal patterns. Data storytelling
makes insights accessible and engaging. Choose the best charts.
9.
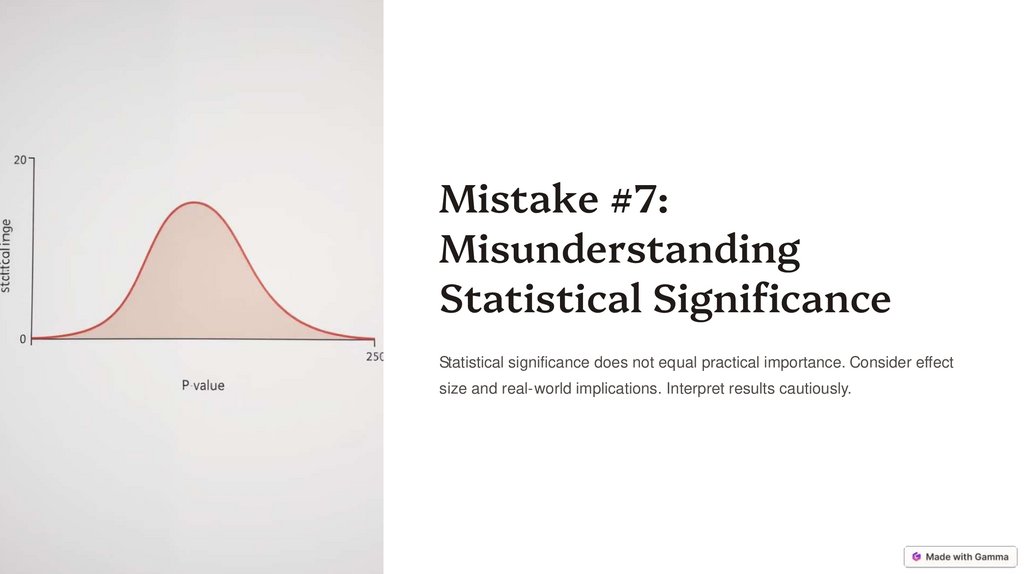
Mistake #7:Misunderstanding
Statistical Significance
Statistical significance does not equal practical importance. Consider effect
size and real-world implications. Interpret results cautiously.
10.
Mistake #8: DrawingConclusions Beyond the
Scope of the Data
E xtrapolating beyond the data's limits risks incorrect judgments. Stay within
the validated range of your analysis. Be humble about your findings.
Conclusions must be grounded in evidence and reasonable scope.
Overgeneralization leads to misleading interpretations. E nsure data
relevance.