
 economics
Similar presentations:


Oil market report
1.
Title of the ReportHighlights
Methodology Notes
Oil Industry and Markets Division
July 2022
The Oil Industry and Markets Division of the International Energy Agency has published
refinery margins since June 1992 in its monthly Oil Market Report. This note details our
new methodology for calculating refinery margins starting from July 2022.
Historical
margins
are
available
http://www.oilmarketreport.org/refinerysp.asp
to
subscribers
on
Comments and suggestions are welcome and will be considered. Please contact
http://www.oilmarketreport.org/contacts.asp
In the event of significant changes to our assumptions and methodology this note will be
updated and replaced by a new document.
2.
REFINING MARGIN DOCUMENTATIONINTERNATIONAL ENERGY AGENCY - OIL MARKET REPORT
Contents
Introduction ........................................................................................................................................................ 3
Refining hubs ...................................................................................................................................................... 3
Refinery configuration and product yields ............................................................................................................ 4
Crude grades ....................................................................................................................................................... 5
Energy use 5
Hydrogen costs ................................................................................................................................................... 6
Emission costs ..................................................................................................................................................... 7
Petrochemical margins ........................................................................................................................................ 8
2
3.
REFINING MARGIN DOCUMENTATIONINTERNATIONAL ENERGY AGENCY - OIL MARKET REPORT
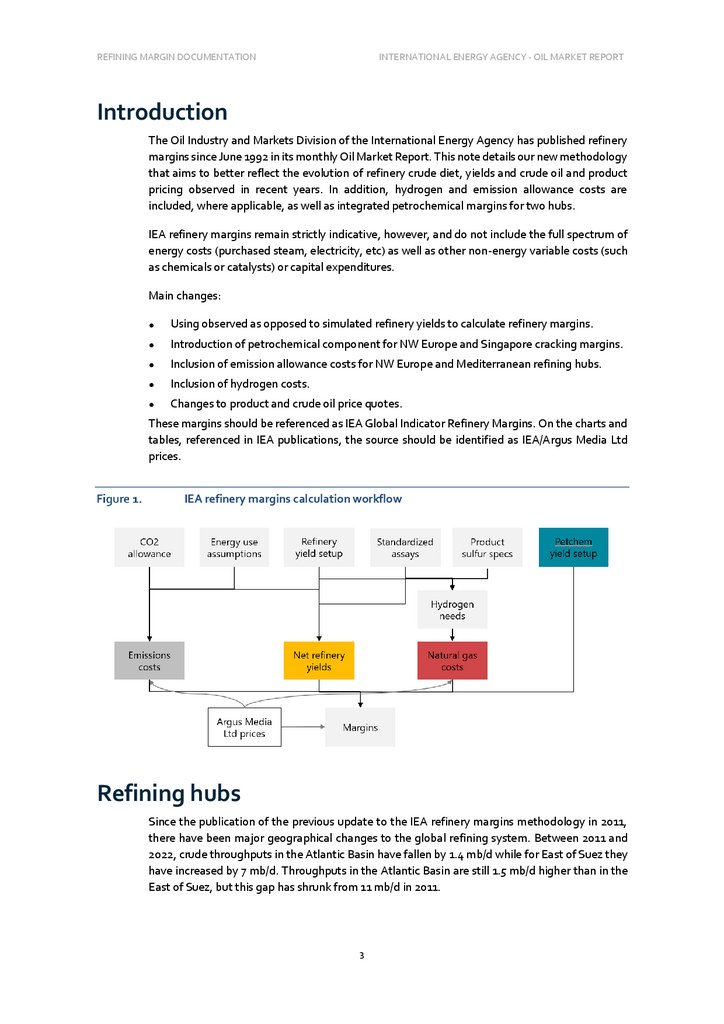
Introduction
The Oil Industry and Markets Division of the International Energy Agency has published refinery
margins since June 1992 in its monthly Oil Market Report. This note details our new methodology
that aims to better reflect the evolution of refinery crude diet, yields and crude oil and product
pricing observed in recent years. In addition, hydrogen and emission allowance costs are
included, where applicable, as well as integrated petrochemical margins for two hubs.
IEA refinery margins remain strictly indicative, however, and do not include the full spectrum of
energy costs (purchased steam, electricity, etc) as well as other non-energy variable costs (such
as chemicals or catalysts) or capital expenditures.
Main changes:
Using observed as opposed to simulated refinery yields to calculate refinery margins.
Introduction of petrochemical component for NW Europe and Singapore cracking margins.
Inclusion of emission allowance costs for NW Europe and Mediterranean refining hubs.
Inclusion of hydrogen costs.
Changes to product and crude oil price quotes.
These margins should be referenced as IEA Global Indicator Refinery Margins. On the charts and
tables, referenced in IEA publications, the source should be identified as IEA/Argus Media Ltd
prices.
IEA refinery margins calculation workflow
Refining hubs
Since the publication of the previous update to the IEA refinery margins methodology in 2011,
there have been major geographical changes to the global refining system. Between 2011 and
2022, crude throughputs in the Atlantic Basin have fallen by 1.4 mb/d while for East of Suez they
have increased by 7 mb/d. Throughputs in the Atlantic Basin are still 1.5 mb/d higher than in the
East of Suez, but this gap has shrunk from 11 mb/d in 2011.
3
4.
REFINING MARGIN DOCUMENTATIONINTERNATIONAL ENERGY AGENCY - OIL MARKET REPORT
Nevertheless, the most liquid product trading hubs and well-established price assessments
continue to be limited mostly to the Atlantic Basin, in addition to having no or only minimal
regulatory constraints such as import and export quotas and taxes. For now, the IEA will continue
assessing refinery margins for five regions, including only Singapore from East of Suez refining
hubs.
Northwest Europe
Mediterranean Europe
US Gulf Coast
US Midcontinent
Singapore
Refinery configuration and product yields
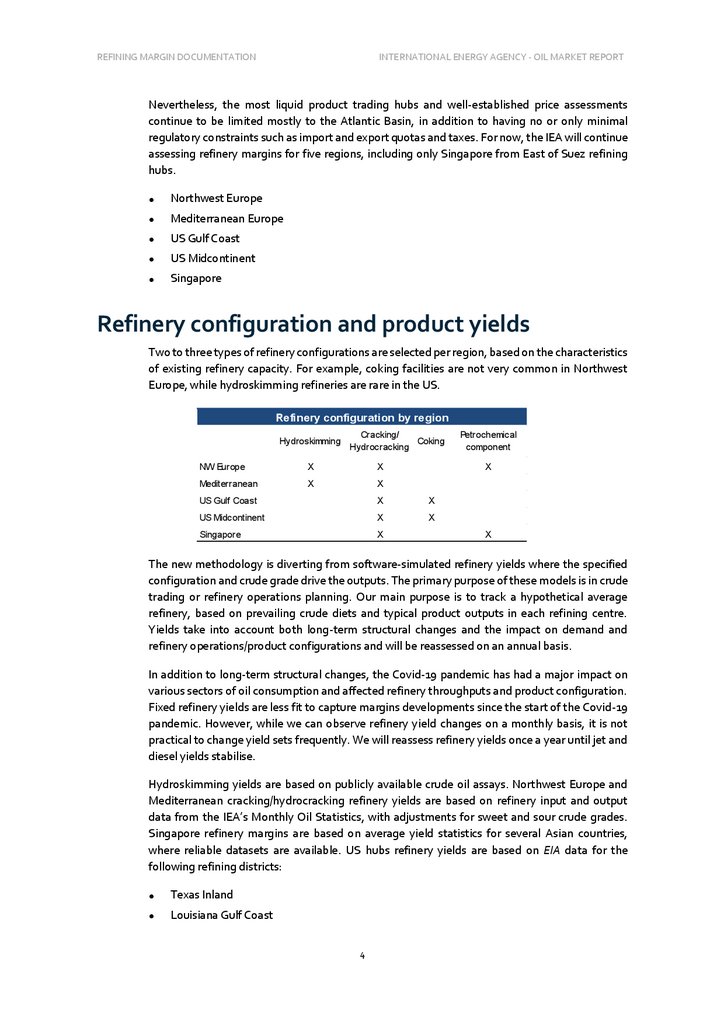
Two to three types of refinery configurations are selected per region, based on the characteristics
of existing refinery capacity. For example, coking facilities are not very common in Northwest
Europe, while hydroskimming refineries are rare in the US.
Refinery configuration by region
Hydroskimming
Cracking/
Coking
Hydrocracking
NW Europe
X
X
Mediterranean
X
X
Petrochemical
component
X
US Gulf Coast
X
X
US Midcontinent
X
X
Singapore
X
X
The new methodology is diverting from software-simulated refinery yields where the specified
configuration and crude grade drive the outputs. The primary purpose of these models is in crude
trading or refinery operations planning. Our main purpose is to track a hypothetical average
refinery, based on prevailing crude diets and typical product outputs in each refining centre.
Yields take into account both long-term structural changes and the impact on demand and
refinery operations/product configurations and will be reassessed on an annual basis.
In addition to long-term structural changes, the Covid-19 pandemic has had a major impact on
various sectors of oil consumption and affected refinery throughputs and product configuration.
Fixed refinery yields are less fit to capture margins developments since the start of the Covid-19
pandemic. However, while we can observe refinery yield changes on a monthly basis, it is not
practical to change yield sets frequently. We will reassess refinery yields once a year until jet and
diesel yields stabilise.
Hydroskimming yields are based on publicly available crude oil assays. Northwest Europe and
Mediterranean cracking/hydrocracking refinery yields are based on refinery input and output
data from the IEA’s Monthly Oil Statistics, with adjustments for sweet and sour crude grades.
Singapore refinery margins are based on average yield statistics for several Asian countries,
where reliable datasets are available. US hubs refinery yields are based on EIA data for the
following refining districts:
Texas Inland
Louisiana Gulf Coast
4
5.
REFINING MARGIN DOCUMENTATIONINTERNATIONAL ENERGY AGENCY - OIL MARKET REPORT
Texas Gulf Coast
Oklahoma/Kansas/Missouri
Indiana, Illinois, Kentucky.
Observed product yields are simplified to inlcude only major traded products.
Refining crude oil usually results in a volumetric expansion as products coming out of the process,
and in general, products used in various sectors, tend to be lighter than crude oil. It also results in
losses as sulphur, hydrogen, and other non-hydrocarbon gases, water, and various impurities are
removed in the refining process. We use the difference in densities of a standard product basket
and the given crude oil type to calculate the volumetric expansion. Calculated values of sulphur
removed are used to estimate processing losses.
For US refineries, we assume a neutral standing with regards to the renewable fuel obligations.
This means that an average US refinery is assumed netither to have a deficit nor excess of
Renewable Identification Numbers.
The yield table is available below.
Crude grades
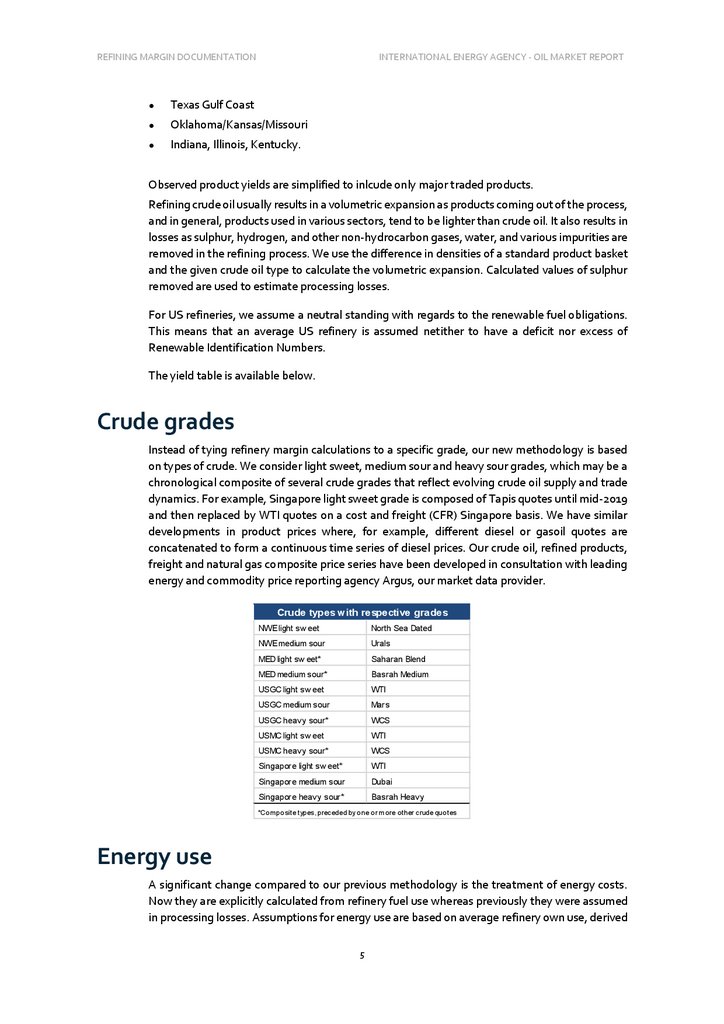
Instead of tying refinery margin calculations to a specific grade, our new methodology is based
on types of crude. We consider light sweet, medium sour and heavy sour grades, which may be a
chronological composite of several crude grades that reflect evolving crude oil supply and trade
dynamics. For example, Singapore light sweet grade is composed of Tapis quotes until mid-2019
and then replaced by WTI quotes on a cost and freight (CFR) Singapore basis. We have similar
developments in product prices where, for example, different diesel or gasoil quotes are
concatenated to form a continuous time series of diesel prices. Our crude oil, refined products,
freight and natural gas composite price series have been developed in consultation with leading
energy and commodity price reporting agency Argus, our market data provider.
Crude types with respective grades
NWE light sw eet
North Sea Dated
NWE medium sour
Urals
MED light sw eet*
Saharan Blend
MED medium sour*
Basrah Medium
USGC light sw eet
WTI
USGC medium sour
Mars
USGC heavy sour*
WCS
USMC light sw eet
WTI
USMC heavy sour*
WCS
Singapore light sw eet*
WTI
Singapore medium sour
Dubai
Singapore heavy sour*
Basrah Heavy
*Co mpo site types, preceded by o ne o r mo re o ther crude quo tes
Energy use
A significant change compared to our previous methodology is the treatment of energy costs.
Now they are explicitly calculated from refinery fuel use whereas previously they were assumed
in processing losses. Assumptions for energy use are based on average refinery own use, derived
5
6.
REFINING MARGIN DOCUMENTATIONINTERNATIONAL ENERGY AGENCY - OIL MARKET REPORT
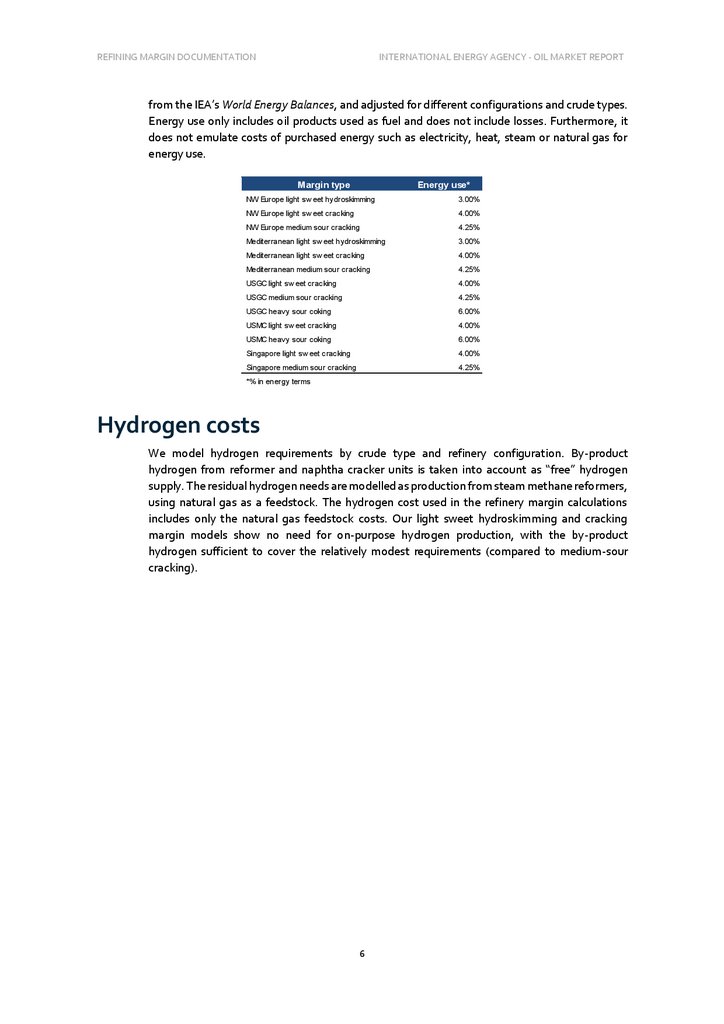
from the IEA’s World Energy Balances, and adjusted for different configurations and crude types.
Energy use only includes oil products used as fuel and does not include losses. Furthermore, it
does not emulate costs of purchased energy such as electricity, heat, steam or natural gas for
energy use.
Margin type
Energy use*
NW Europe light sw eet hydroskimming
3.00%
NW Europe light sw eet cracking
4.00%
NW Europe medium sour cracking
4.25%
Mediterranean light sw eet hydroskimming
3.00%
Mediterranean light sw eet cracking
4.00%
Mediterranean medium sour cracking
4.25%
USGC light sw eet cracking
4.00%
USGC medium sour cracking
4.25%
USGC heavy sour coking
6.00%
USMC light sw eet cracking
4.00%
USMC heavy sour coking
6.00%
Singapore light sw eet cracking
4.00%
Singapore medium sour cracking
4.25%
*% in energy terms
Hydrogen costs
We model hydrogen requirements by crude type and refinery configuration. By-product
hydrogen from reformer and naphtha cracker units is taken into account as “free” hydrogen
supply. The residual hydrogen needs are modelled as production from steam methane reformers,
using natural gas as a feedstock. The hydrogen cost used in the refinery margin calculations
includes only the natural gas feedstock costs. Our light sweet hydroskimming and cracking
margin models show no need for on-purpose hydrogen production, with the by-product
hydrogen sufficient to cover the relatively modest requirements (compared to medium-sour
cracking).
6
7.
REFINING MARGIN DOCUMENTATIONINTERNATIONAL ENERGY AGENCY - OIL MARKET REPORT
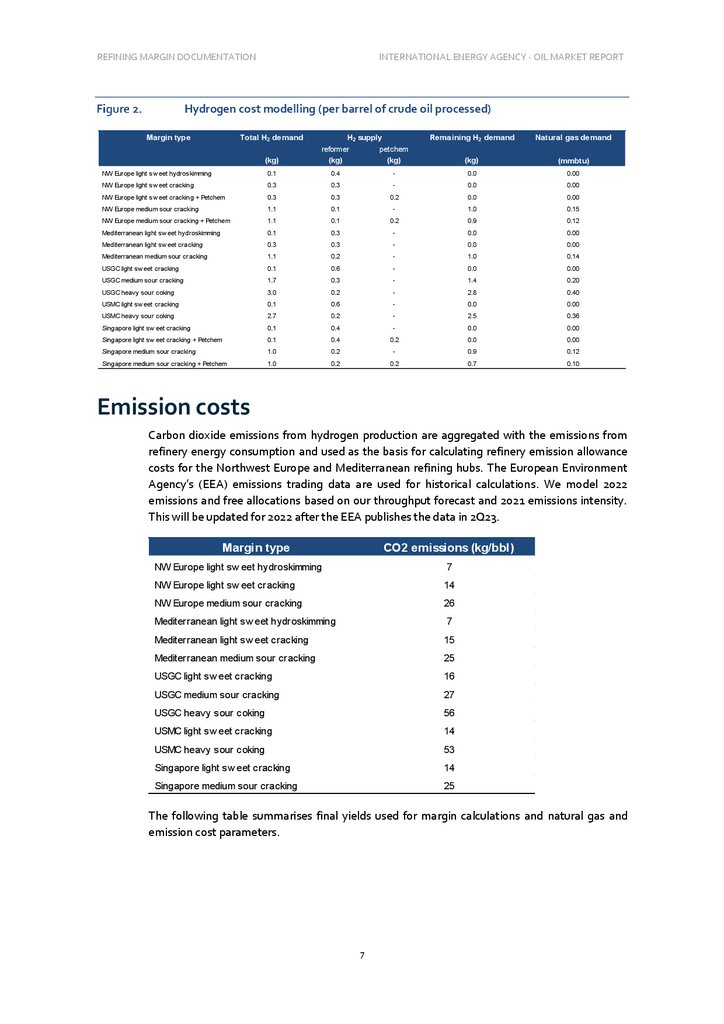
Hydrogen cost modelling (per barrel of crude oil processed)
Margin type
Total H2 demand
H2 supply
Remaining H2 demand
Natural gas demand
petchem
(kg)
(kg)
reformer
(kg)
(kg)
(mmbtu)
NW Europe light sw eet hydroskimming
0.1
0.4
-
0.0
0.00
NW Europe light sw eet cracking
0.3
0.3
-
0.0
0.00
NW Europe light sw eet cracking + Petchem
0.3
0.3
0.2
0.0
0.00
NW Europe medium sour cracking
1.1
0.1
-
1.0
0.15
NW Europe medium sour cracking + Petchem
1.1
0.1
0.2
0.9
0.12
Mediterranean light sw eet hydroskimming
0.1
0.3
-
0.0
0.00
Mediterranean light sw eet cracking
0.3
0.3
-
0.0
0.00
Mediterranean medium sour cracking
1.1
0.2
-
1.0
0.14
USGC light sw eet cracking
0.1
0.6
-
0.0
0.00
USGC medium sour cracking
1.7
0.3
-
1.4
0.20
USGC heavy sour coking
3.0
0.2
-
2.8
0.40
USMC light sw eet cracking
0.1
0.6
-
0.0
0.00
USMC heavy sour coking
2.7
0.2
-
2.5
0.36
Singapore light sw eet cracking
0.1
0.4
-
0.0
0.00
Singapore light sw eet cracking + Petchem
0.1
0.4
0.2
0.0
0.00
Singapore medium sour cracking
1.0
0.2
-
0.9
0.12
Singapore medium sour cracking + Petchem
1.0
0.2
0.2
0.7
0.10
Emission costs
Carbon dioxide emissions from hydrogen production are aggregated with the emissions from
refinery energy consumption and used as the basis for calculating refinery emission allowance
costs for the Northwest Europe and Mediterranean refining hubs. The European Environment
Agency’s (EEA) emissions trading data are used for historical calculations. We model 2022
emissions and free allocations based on our throughput forecast and 2021 emissions intensity.
This will be updated for 2022 after the EEA publishes the data in 2Q23.
Margin type
CO2 emissions (kg/bbl)
NW Europe light sw eet hydroskimming
7
NW Europe light sw eet cracking
14
NW Europe medium sour cracking
26
Mediterranean light sw eet hydroskimming
7
Mediterranean light sw eet cracking
15
Mediterranean medium sour cracking
25
USGC light sw eet cracking
16
USGC medium sour cracking
27
USGC heavy sour coking
56
USMC light sw eet cracking
14
USMC heavy sour coking
53
Singapore light sw eet cracking
14
Singapore medium sour cracking
25
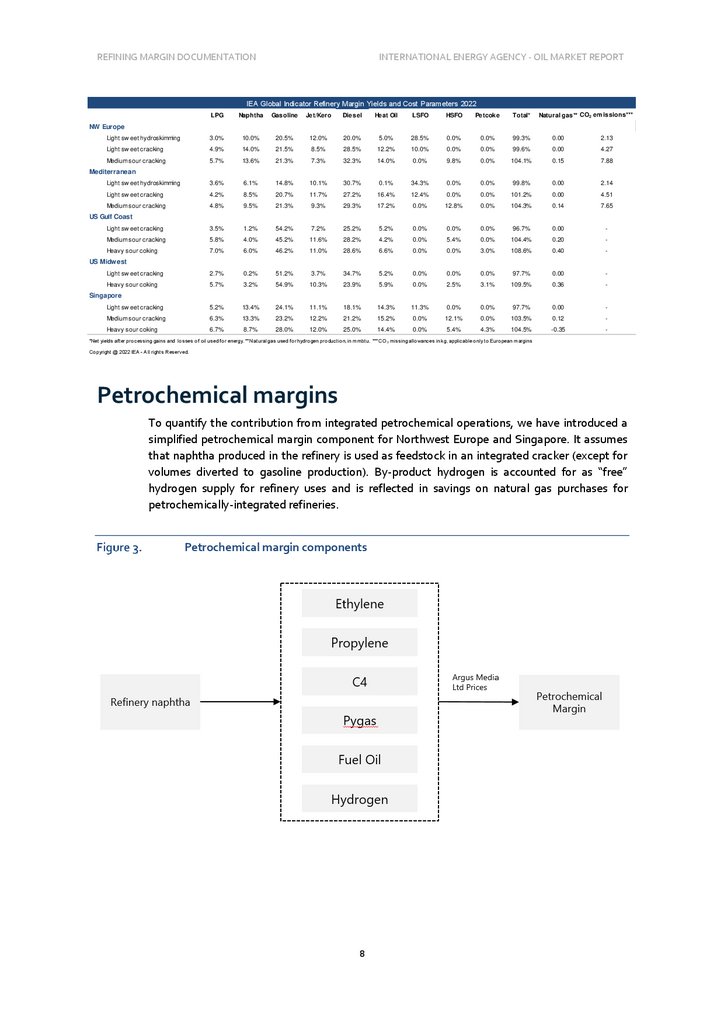
The following table summarises final yields used for margin calculations and natural gas and
emission cost parameters.
7
8.
REFINING MARGIN DOCUMENTATIONINTERNATIONAL ENERGY AGENCY - OIL MARKET REPORT
IEA Global Indicator Refinery Margin Yields and Cost Parameters 2022
LPG
Naphtha
Gasoline
Jet/Kero
Diesel
Light sw eet hydroskimming
3.0%
10.0%
20.5%
12.0%
Light sw eet cracking
4.9%
14.0%
21.5%
8.5%
Medium sour cracking
5.7%
13.6%
21.3%
Light sw eet hydroskimming
3.6%
6.1%
Light sw eet cracking
4.2%
8.5%
Medium sour cracking
4.8%
Light sw eet cracking
Medium sour cracking
Heavy sour coking
Natural gas** CO2 em issions***
Heat Oil
LSFO
HSFO
Petcoke
Total*
20.0%
5.0%
28.5%
0.0%
0.0%
99.3%
0.00
2.13
28.5%
12.2%
10.0%
0.0%
0.0%
99.6%
0.00
4.27
7.3%
32.3%
14.0%
0.0%
9.8%
0.0%
104.1%
0.15
7.88
14.8%
10.1%
30.7%
0.1%
34.3%
0.0%
0.0%
99.8%
0.00
2.14
20.7%
11.7%
27.2%
16.4%
12.4%
0.0%
0.0%
101.2%
0.00
4.51
9.5%
21.3%
9.3%
29.3%
17.2%
0.0%
12.8%
0.0%
104.3%
0.14
7.65
3.5%
1.2%
54.2%
7.2%
25.2%
5.2%
0.0%
0.0%
0.0%
96.7%
0.00
-
5.8%
4.0%
45.2%
11.6%
28.2%
4.2%
0.0%
5.4%
0.0%
104.4%
0.20
-
7.0%
6.0%
46.2%
11.0%
28.6%
6.6%
0.0%
0.0%
3.0%
108.6%
0.40
-
Light sw eet cracking
2.7%
0.2%
51.2%
3.7%
34.7%
5.2%
0.0%
0.0%
0.0%
97.7%
0.00
-
Heavy sour coking
5.7%
3.2%
54.9%
10.3%
23.9%
5.9%
0.0%
2.5%
3.1%
109.5%
0.36
-
Light sw eet cracking
5.2%
13.4%
24.1%
11.1%
18.1%
14.3%
11.3%
0.0%
0.0%
97.7%
0.00
-
Medium sour cracking
6.3%
13.3%
23.2%
12.2%
21.2%
15.2%
0.0%
12.1%
0.0%
103.5%
0.12
-
Heavy sour coking
6.7%
8.7%
28.0%
12.0%
25.0%
14.4%
0.0%
5.4%
4.3%
104.5%
-0.35
-
NW Europe
Mediterranean
US Gulf Coast
US Midwest
Singapore
*Net yields after pro cessing gains and lo sses o f o il used fo r energy. ** Natural gas used fo r hydro gen pro ductio n, in mmbtu. *** CO 2 missing allo wances in kg, applicable o nly to Euro pean margins
Co pyright @ 2022 IEA - A ll rights Reserved.
Petrochemical margins
To quantify the contribution from integrated petrochemical operations, we have introduced a
simplified petrochemical margin component for Northwest Europe and Singapore. It assumes
that naphtha produced in the refinery is used as feedstock in an integrated cracker (except for
volumes diverted to gasoline production). By-product hydrogen is accounted for as “free”
hydrogen supply for refinery uses and is reflected in savings on natural gas purchases for
petrochemically-integrated refineries.
Petrochemical margin components
8