


 of the activity of hydronium ions (H+ or, more precisely, H3O+aq) in a solution.")

")


 and mineral one В (Вg)")


 ecology
Similar presentations:


The ecological monitoring of soils condition. (Lesson 9)
1.
Saint-Petersburg State UniversityUniversity of Stavanger
“Joint Norwegian-Russian Master of Science
program in Geoecological monitoring and
rational use of natural resources in the
Northern oil and gas production regions”
2. Lesson 9
The Ecological Monitoring ofSoils Condition
3.
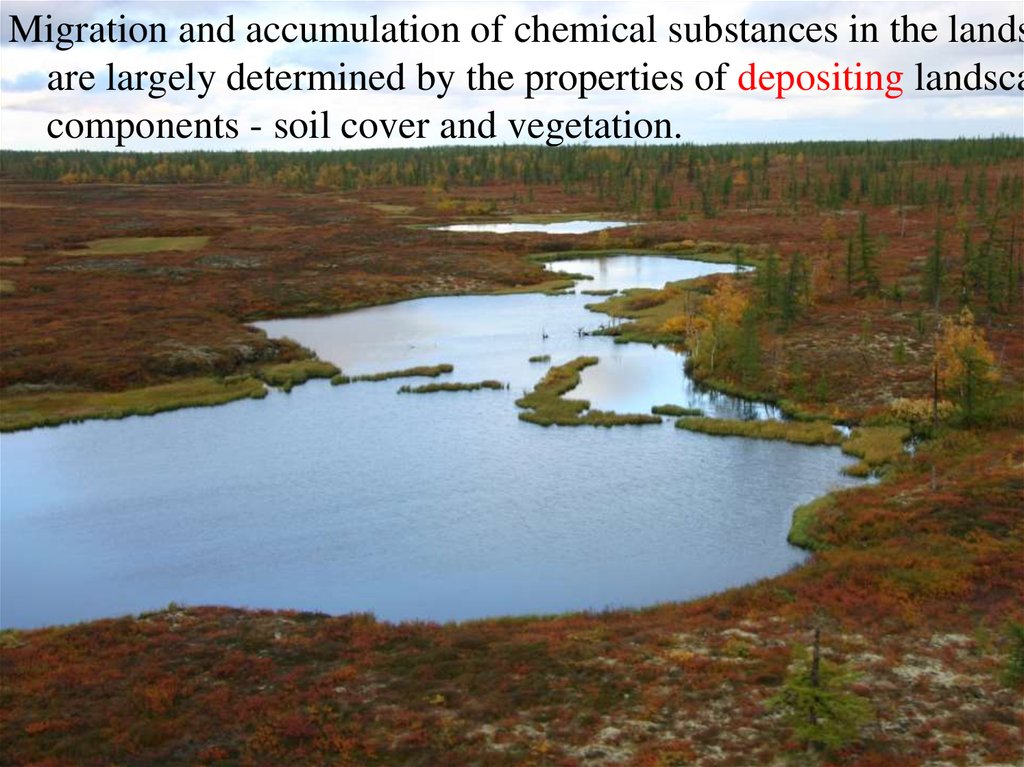
Migration and accumulation of chemical substances in the landsare largely determined by the properties of depositing landsca
components - soil cover and vegetation.
4.
Soil is the only component of the landscape,which arises from the interaction of all other
landscape components:
the rocks, air, natural waters, vegetation,
microorganisms and animals.
5.
All the pollutants into the air or water, aredeposited on the surface of the soil and
are absorbed by plants.
6.
As the main landscape component, soil can beconsidered as an integral indicator of pollution
of natural-territorial complexes, giving an idea
of the quality life-supporting components - air
and water
7.
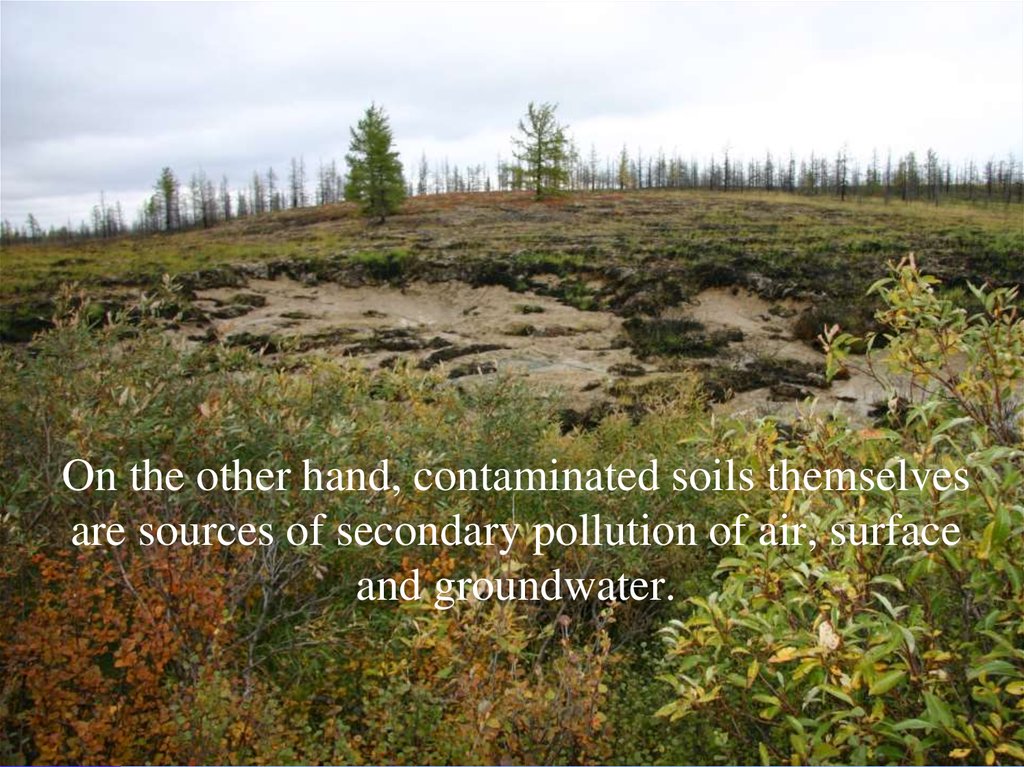
On the other hand, contaminated soils themselvesare sources of secondary pollution of air, surface
and groundwater.
8.
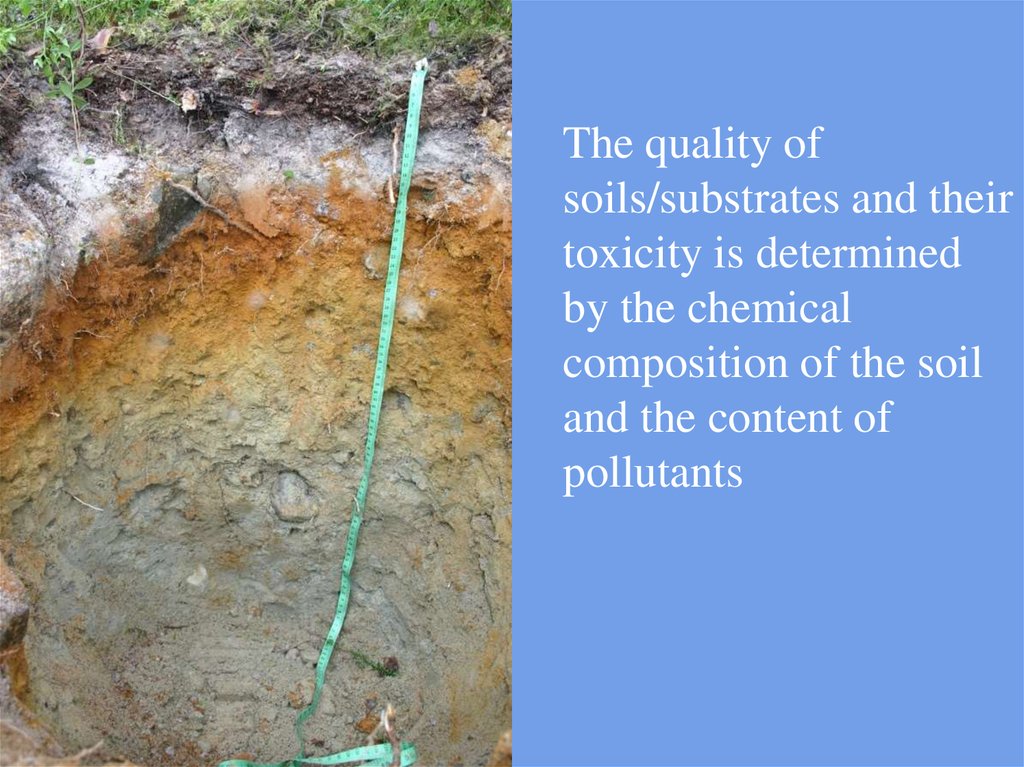
The quality ofsoils/substrates and their
toxicity is determined
by the chemical
composition of the soil
and the content of
pollutants
9.
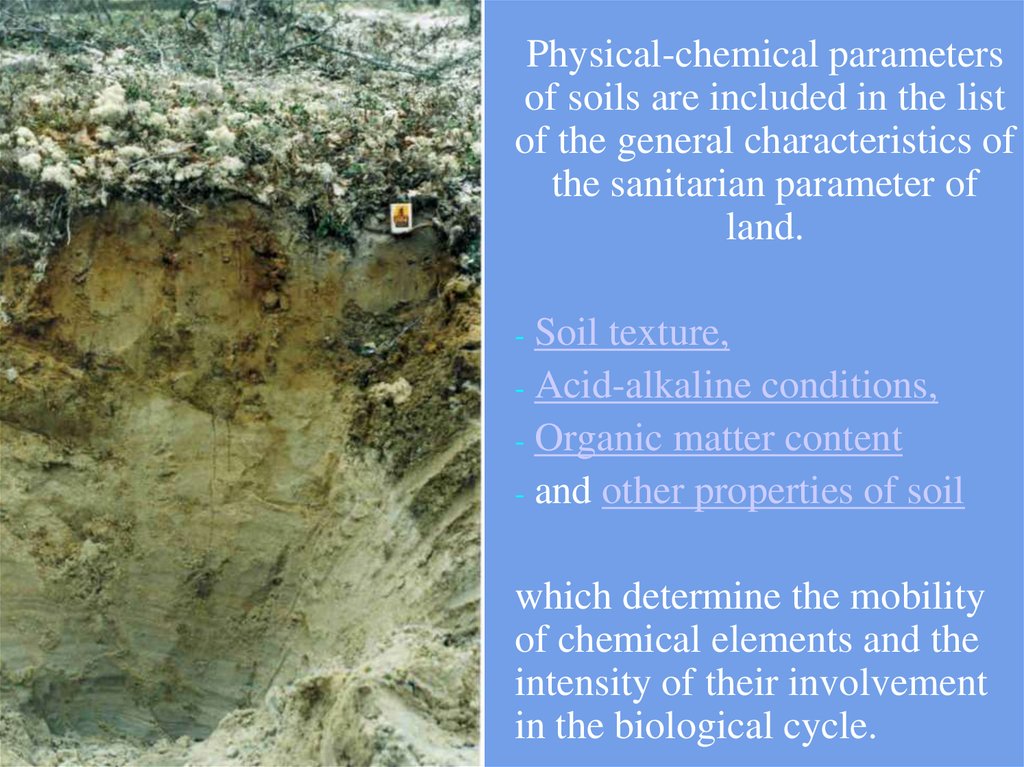
Physical-chemical parametersof soils are included in the list
of the general characteristics of
the sanitarian parameter of
land.
Soil texture,
- Acid-alkaline conditions,
- Organic matter content
- and other properties of soil
-
which determine the mobility
of chemical elements and the
intensity of their involvement
in the biological cycle.
10.
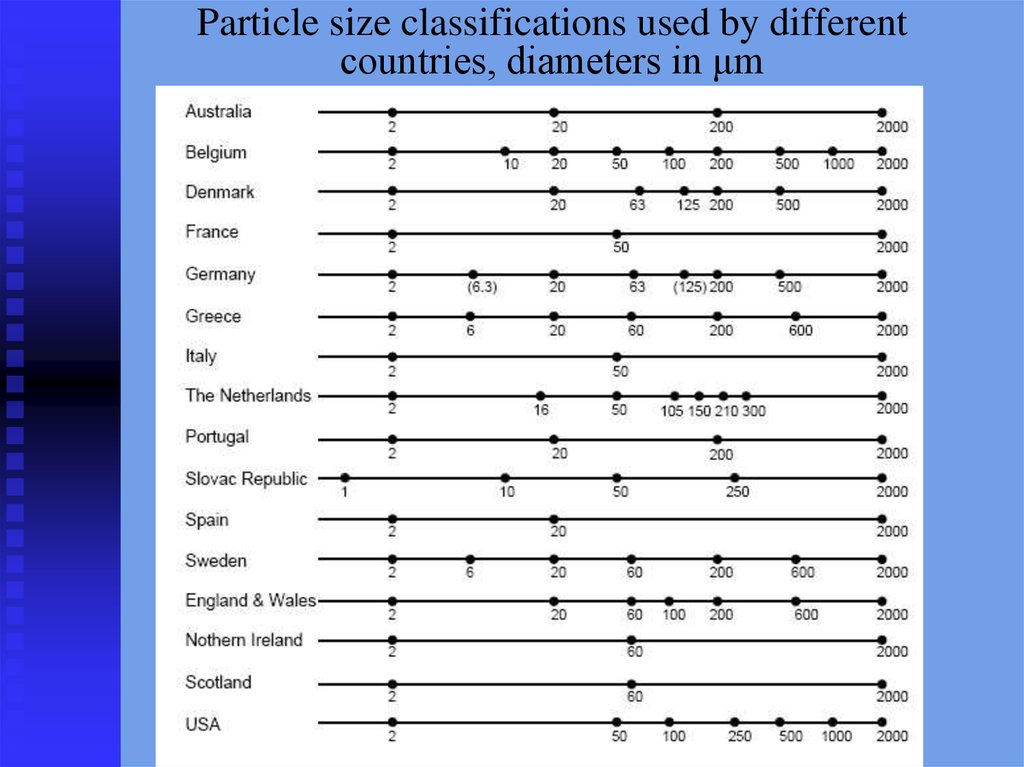
Particle size classifications used by differentcountries, diameters in μm
11.
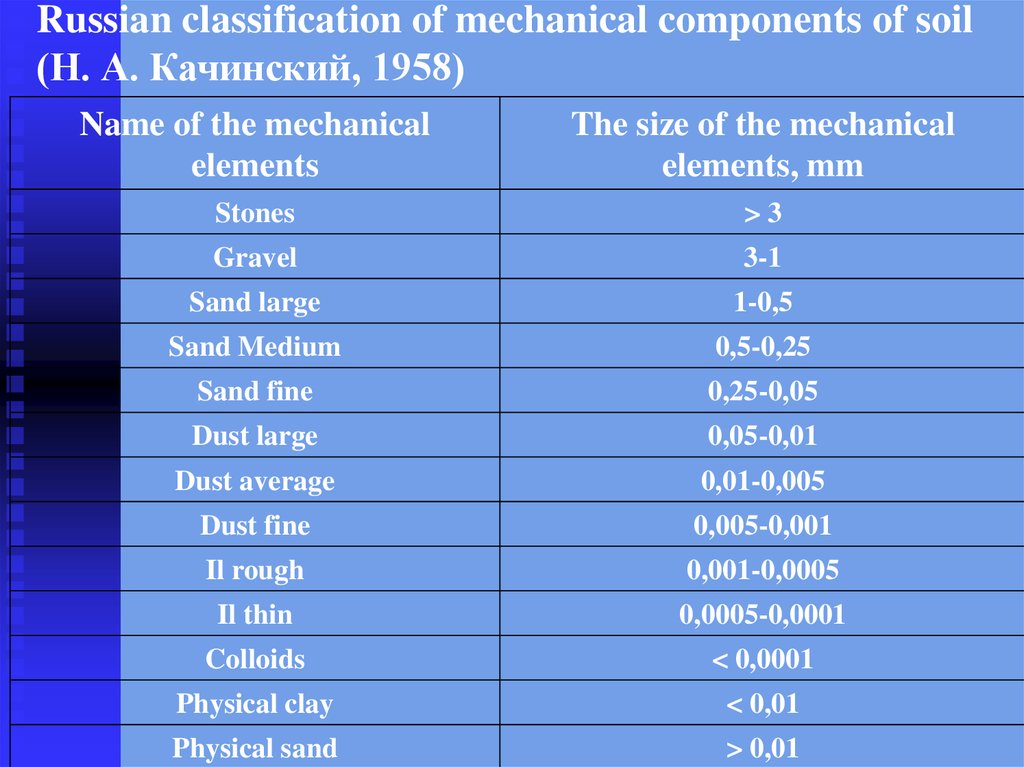
Russian classification of mechanical components of soil(Н. А. Качинский, 1958)
Name of the mechanical
elements
The size of the mechanical
elements, mm
Stones
>3
Gravel
3-1
Sand large
1-0,5
Sand Medium
0,5-0,25
Sand fine
0,25-0,05
Dust large
0,05-0,01
Dust average
0,01-0,005
Dust fine
0,005-0,001
Il rough
0,001-0,0005
Il thin
0,0005-0,0001
Colloids
< 0,0001
Physical clay
< 0,01
Physical sand
> 0,01
12.
Classification of soils according to texture (Н. А. Качинский,1958)
Name of soil
mechanical composition
The content of physical clay (particles with d <0,01
mm) in%:
in the soils of
in the soils of the
podzolic type
steppe type of soil
soil formation formation, as well as
(this is for
red and yellow soils
tundra soils too)
in highly
saline soils
and saline
soils
Fine sand
0-5
0-5
0-5
Sand coherent
5-10
5-10
5-10
Sandy-loamy
10-20
10-20
10-15
Loamy
20-30
20-30
15-20
Medium loamy
30-40
30-45
20-30
Heavy loam
40-50
45-60
30-40
Light clay
50-65
60-75
40-50
Average clay
65-80
75-85
50-65
Heavy clay
> 80
> 85
> 65
13.
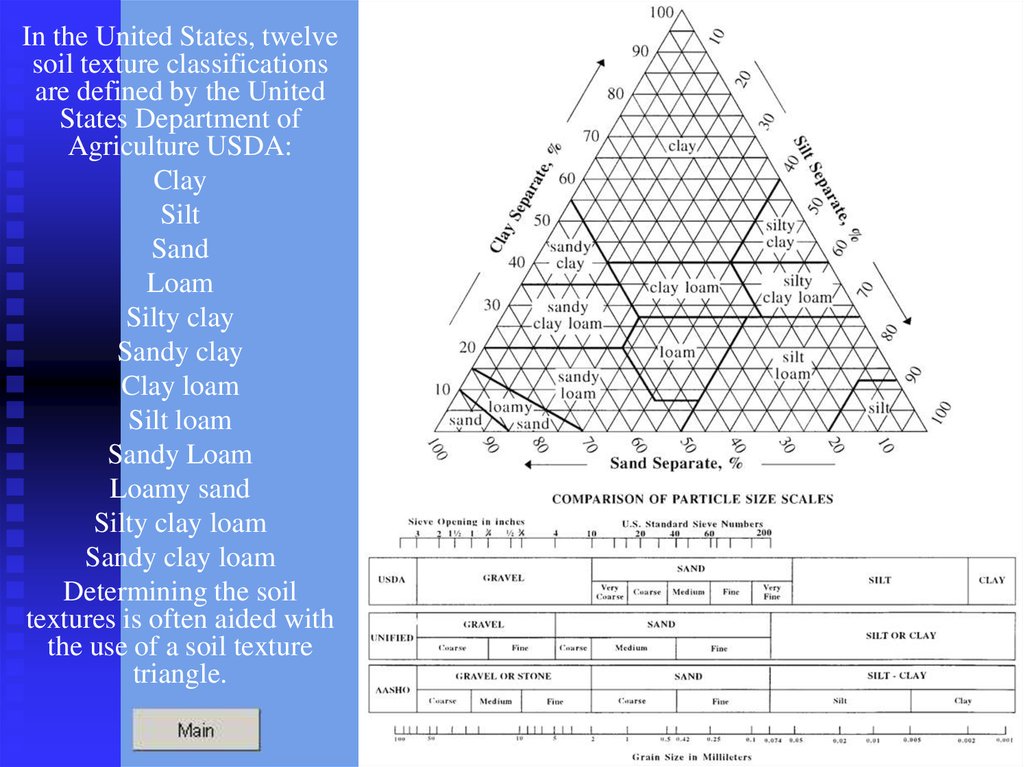
In the United States, twelvesoil texture classifications
are defined by the United
States Department of
Agriculture USDA:
Clay
Silt
Sand
Loam
Silty clay
Sandy clay
Clay loam
Silt loam
Sandy Loam
Loamy sand
Silty clay loam
Sandy clay loam
Determining the soil
textures is often aided with
the use of a soil texture
triangle.
14. The soil pH is a measure of the acidity or alkalinity in soils. pH is defined as the negative logarithm (base 10) of the activity of hydronium ions (H+ or, more precisely, H3O+aq) in a solution.
The soil pH is a measure of the acidity oralkalinity in soils.
pH is defined as the negative logarithm
(base 10) of the activity of hydronium
ions (H+ or, more precisely, H3O+aq) in a
solution.
In
water, it normally ranges from -1 to 14, with 7 being
neutral. A pH below 7 is is acidic and above 7 is alkaline.
The pH value in soils - 2,5 to 12,5.
15.
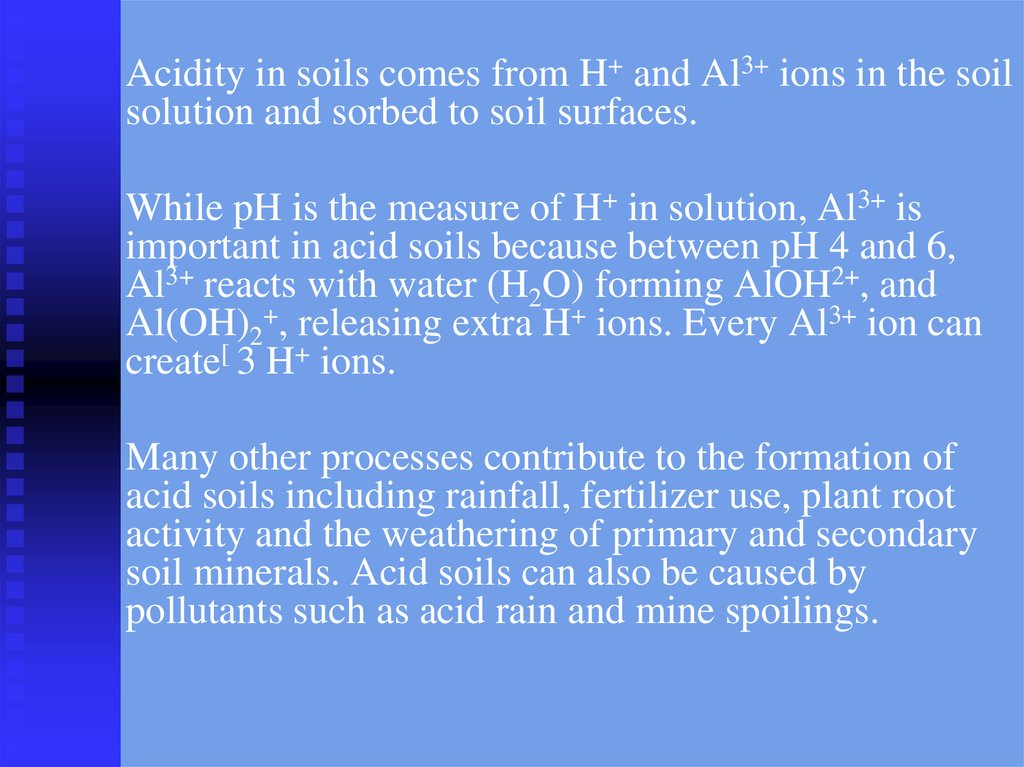
Acidity in soils comes from H+ and Al3+ ions in the soilsolution and sorbed to soil surfaces.
While pH is the measure of H+ in solution, Al3+ is
important in acid soils because between pH 4 and 6,
Al3+ reacts with water (H2O) forming AlOH2+, and
Al(OH)2+, releasing extra H+ ions. Every Al3+ ion can
create[ 3 H+ ions.
Many other processes contribute to the formation of
acid soils including rainfall, fertilizer use, plant root
activity and the weathering of primary and secondary
soil minerals. Acid soils can also be caused by
pollutants such as acid rain and mine spoilings.
16.
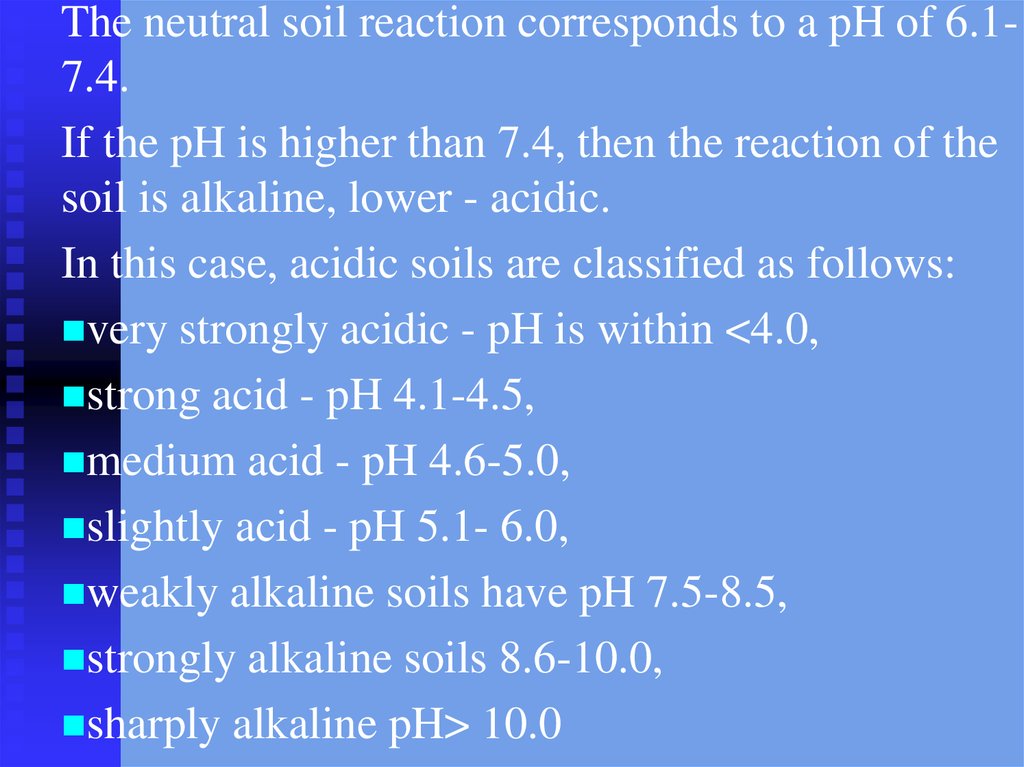
The neutral soil reaction corresponds to a pH of 6.17.4.If the pH is higher than 7.4, then the reaction of the
soil is alkaline, lower - acidic.
In this case, acidic soils are classified as follows:
very strongly acidic - pH is within <4.0,
strong acid - pH 4.1-4.5,
medium acid - pH 4.6-5.0,
slightly acid - pH 5.1- 6.0,
weakly alkaline soils have pH 7.5-8.5,
strongly alkaline soils 8.6-10.0,
sharply alkaline pH> 10.0
17. The United States Department of Agriculture Natural Resources Conservation Service, formerly Soil Conservation Service classifies soil pH ranges as follows
DenominationpH range
Ultra acidic
< 3.5
Extremely acidic
3.5–4.4
Very strongly acidic
4.5–5.0
Strongly acidic
5.1–5.5
Moderately acidic
5.6–6.0
Slightly acidic
6.1–6.5
Neutral
6.6–7.3
Slightly alkaline
7.4–7.8
Moderately alkaline
7.9–8.4
Strongly alkaline
8.5–9.0
Very strongly alkaline
> 9.0
18. Map of soil acidity (T. Hengl)
19.
Soil organic matterIt can be divided into three general pools:
-living biomass of microorganisms,
-fresh and partially decomposed residues,
-and humus: the well-decomposed organic material.
20.
humus (coined 1790–1800; from the Latinhumus: earth, ground) refers to the fraction
of soil organic matter that is amorphous and
without the cellular cake structure
characteristic of plants, micro-organisms or
animals.
Humus significantly influences the bulk
density of soil and contributes to moisture
and nutrient retention. Soil formation begins
with the weathering of humus.
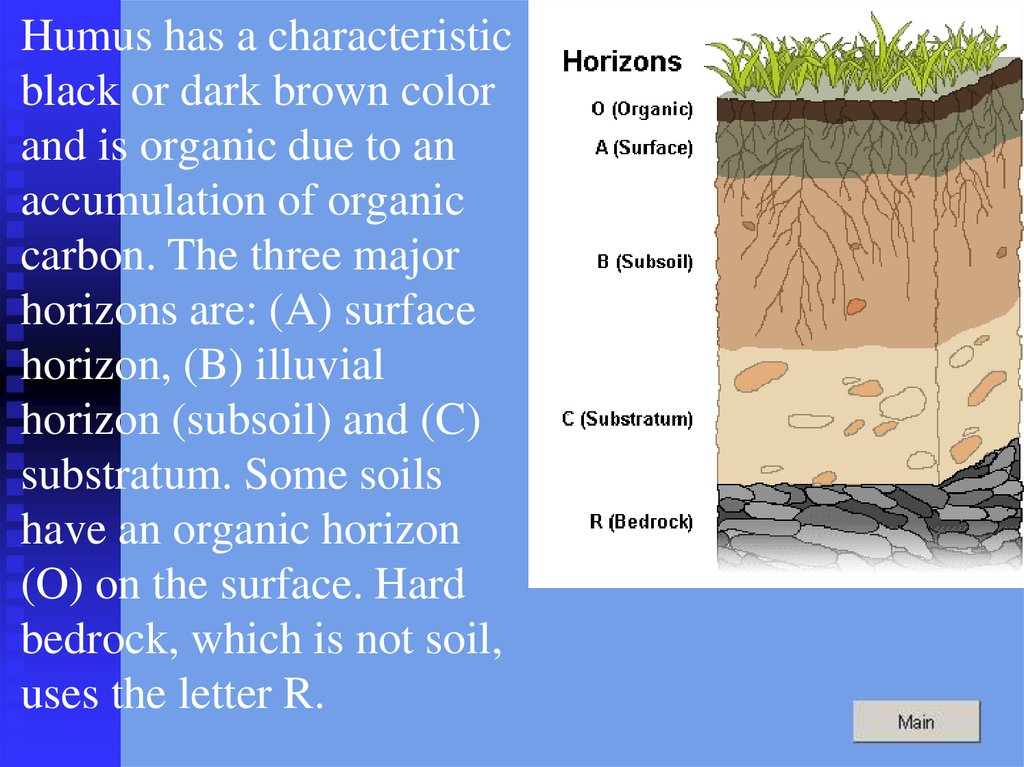
21.
Humus has a characteristicblack or dark brown color
and is organic due to an
accumulation of organic
carbon. The three major
horizons are: (A) surface
horizon, (B) illuvial
horizon (subsoil) and (C)
substratum. Some soils
have an organic horizon
(O) on the surface. Hard
bedrock, which is not soil,
uses the letter R.
22.
Biogenic elements (N, P, K, Ca ctr.),Macroelements (Si, Na, Mg ctr.),
Microelements, trace elements (Cu, Zn, Pb, Cd,
Ni, Cr, Hg, As, Sb, Co, Mn, Ba Sr, Mo, V
ctr.).
23.
The six most common elements associatedwith organic molecules—carbon, nitrogen,
hydrogen, oxygen, phosphorus, and sulfur—
take a variety of chemical forms and may
exist for long periods in the atmosphere, on
land, in water, or beneath Earth’s surface.
24. Thus, contamination results in:
Changing the physicaland chemical
characteristics of soils:
- change in texture,
- change in the total
saturation of the base
(pH shift, etc.)
- accumulation of
toxic substances.
Water migration of pollutants and pollution of natural
waters.
The absorption of pollutants by living organisms and
their involvement in the biological cycle.
25. The methods of soils investigation
Main soil horizons26.
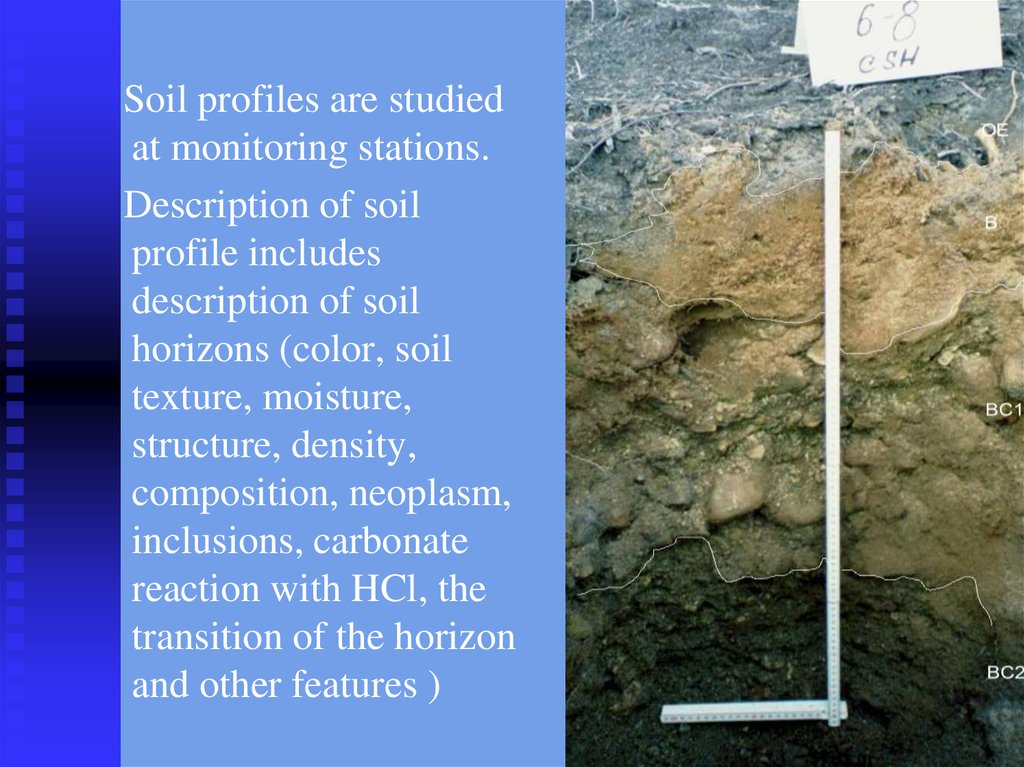
Soil profiles are studiedat monitoring stations.
Description of soil
profile includes
description of soil
horizons (color, soil
texture, moisture,
structure, density,
composition, neoplasm,
inclusions, carbonate
reaction with HCl, the
transition of the horizon
and other features )
27. The chemical composition of soils is the specific indicator of anthropogenic environmental pollution of terrestrial ecosystems
28.
Taking, storage and transportation of soil samplesare carried out in accordance with applicable
standards (ГОСТ 17.1.5.02-80; ГОСТ 17.1.5.05-85;
ГОСТ 17.4.3.01-83; ГОСТ 17.4.4.02-84)
29. ГОСТ 17.4.4.02-84
EQUIPMENT, MATERIALS, REAGENTSShovels by ГОСТ 19596—74. Knives for soil by ГОСТ 23707—79. Knives from polyethylene or polystyrene. Soil
drills.
A refrigerator that maintains the temperature from 4 to 6 ° C. Refrigerators-bags.Laboratory balance for general
use by ГОСТ 24104—80 with a maximum load of 200 and 1000 g. Enameled cuvettes. Glass crystallizers.
Soil sieve with a mesh of 0.25; 0.5; 1; 3 mm by ГОСТ 3584—73.
Laboratory glass spirits by ГОСТ 10090—74.
Porcelain mortars and pestles by ГОСТ 9147—80.
Mortars and pistils of jasper, agate or fused corundum.
Vials or cans of glass wide-necked with ground glass stoppers with a capacity of 300, 500, 800, 1000 cm3.
Banks or boxes of food polyethylene or polystyrene. Metal spatulas by ГОСТ 19126—79.
Plastic spatulas by ГОСТ 19126—79.
Scoops.
Wrapping paper by ГОСТ 8273—75.
Medical glue.
Tracing paper by ГОСТ 892—70.
Cloth bags.
Packages and film polyethylene.
Parchment by ГОСТ 2995—73.
Tampons cotton-gauze sterile.
Cardboard Boxes.
Acid, hydrochloric acid by ГОСТ 3118—77, pure for analysis, a solution with a mass fraction of 3 and 10%.
Sodium hydroxide by ГОСТ -1328—77.
Rectified ethyl alcohol by ГОСТ 18300—72.
Technical formalin by ГОСТ 1625—75, The highest grade, a solution with a mass fraction of 3%.
Sodium chloride by ГОСТ 4233—77, Isotonic solution with a mass fraction of 0.85%.
30.
The sample is takenfrom each genetic
horizon –
the material is taken
from one place of the
horizon, or one layer of
the soil profile, typical
of this horizon, or layer.
31. Sample from two horizons: Peaty & humic horizon О /А0А1 (Ат) and mineral one В (Вg)
Sample from two horizons: Peaty & humichorizon О /А0А1 (Ат) and mineral one В (Вg)
32. A sample from each of the two layers О/Ат and T of organogenic soils
33.
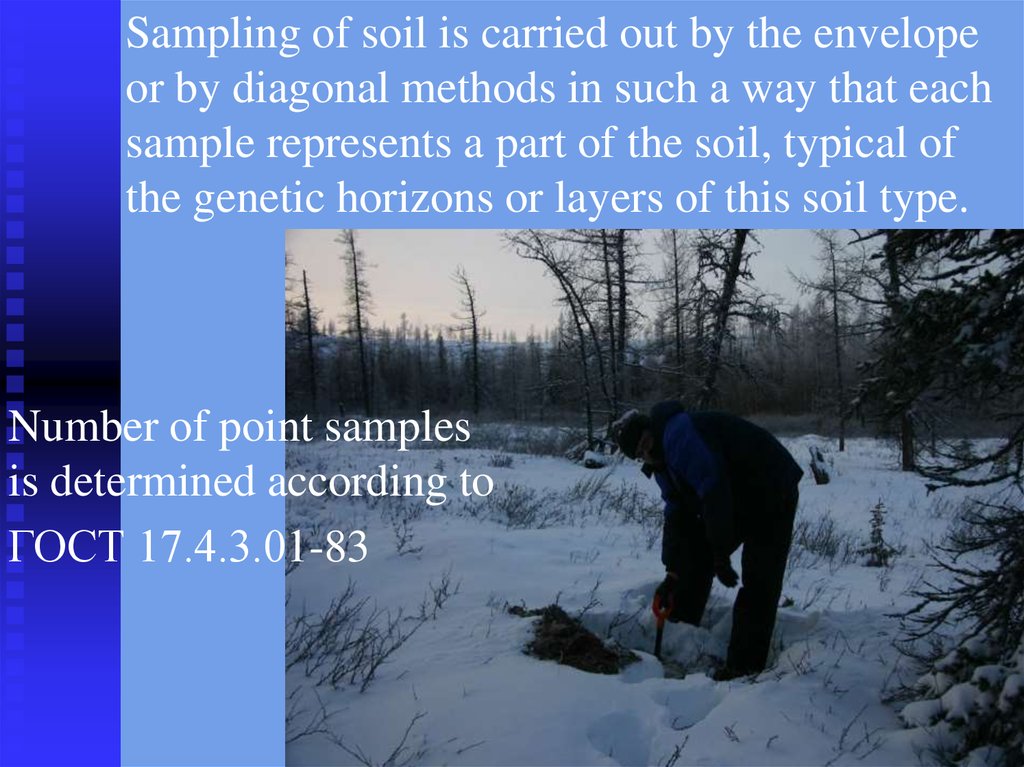
Sampling of soil is carried out by the envelopeor by diagonal methods in such a way that each
sample represents a part of the soil, typical of
the genetic horizons or layers of this soil type.
Number of point samples
is determined according to
ГОСТ 17.4.3.01-83
34.
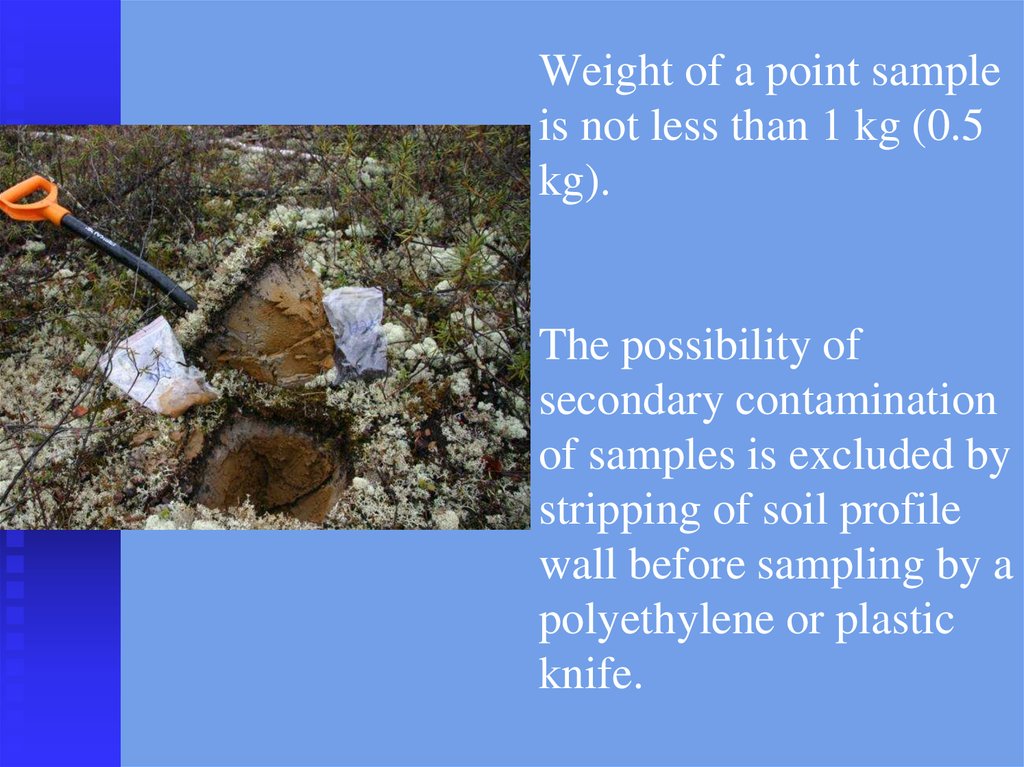
Weight of a point sampleis not less than 1 kg (0.5
kg).
The possibility of
secondary contamination
of samples is excluded by
stripping of soil profile
wall before sampling by a
polyethylene or plastic
knife.
35.
Soil samples for physical-chemical analysisare dried to air-dry state according to ГОСТ
5180-75 (without direct sunlight!)
Air-dried samples stored in cloth bags, in
cardboard boxes or in glass containers.
36.
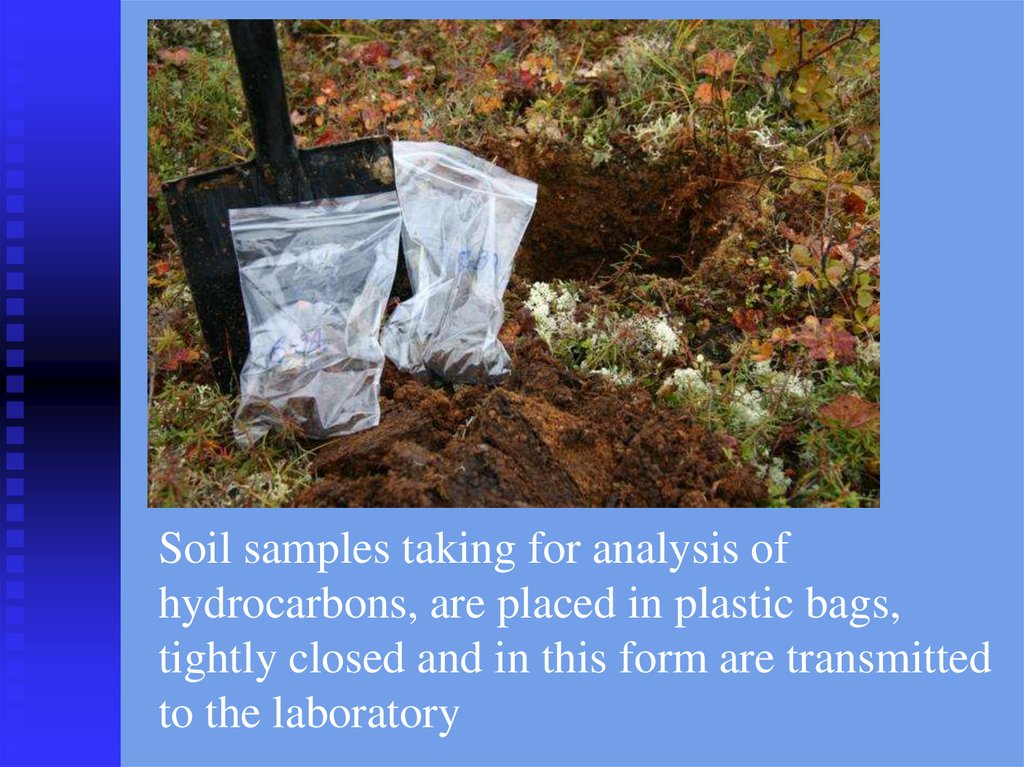
Soil samples taking for analysis ofhydrocarbons, are placed in plastic bags,
tightly closed and in this form are transmitted
to the laboratory
37.
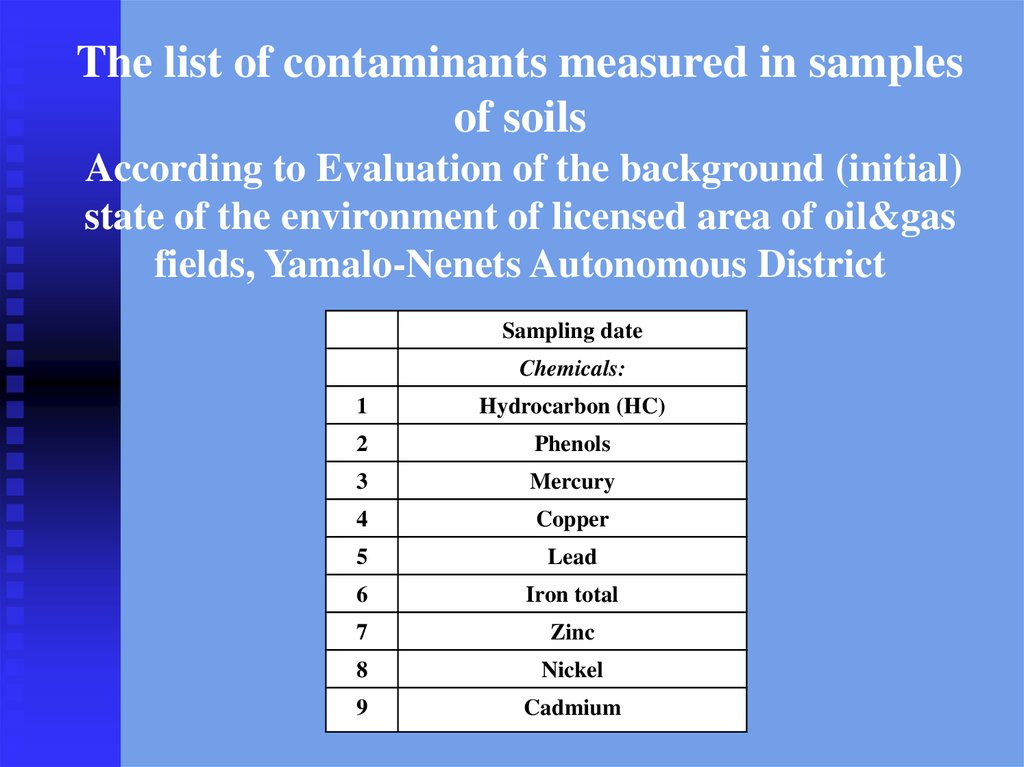
The list of contaminants measured in samplesof soils
According to Evaluation of the background (initial)
state of the environment of licensed area of oil&gas
fields, Yamalo-Nenets Autonomous District
Sampling date
Chemicals:
1
Hydrocarbon (HC)
2
Phenols
3
Mercury
4
Copper
5
Lead
6
Iron total
7
Zinc
8
Nickel
9
Cadmium
38.
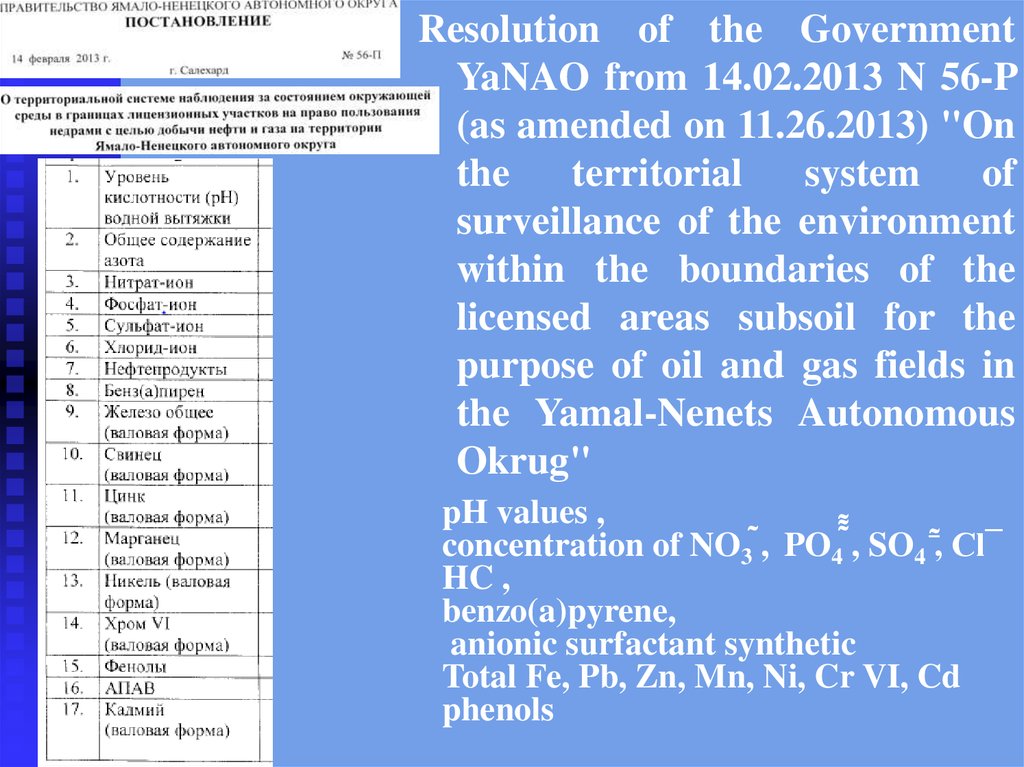
Resolution of the GovernmentYaNAO from 14.02.2013 N 56-P
(as amended on 11.26.2013) "On
the
territorial
system
of
surveillance of the environment
within the boundaries of the
licensed areas subsoil for the
purpose of oil and gas fields in
the Yamal-Nenets Autonomous
Okrug"
pH values ,
concentration of NO3 ̃, PO4 ̃,̃ SO4 ,̃ Cl¯
HC ,
benzo(a)pyrene,
anionic surfactant synthetic
Total Fe, Pb, Zn, Mn, Ni, Cr VI, Cd
phenols
39.
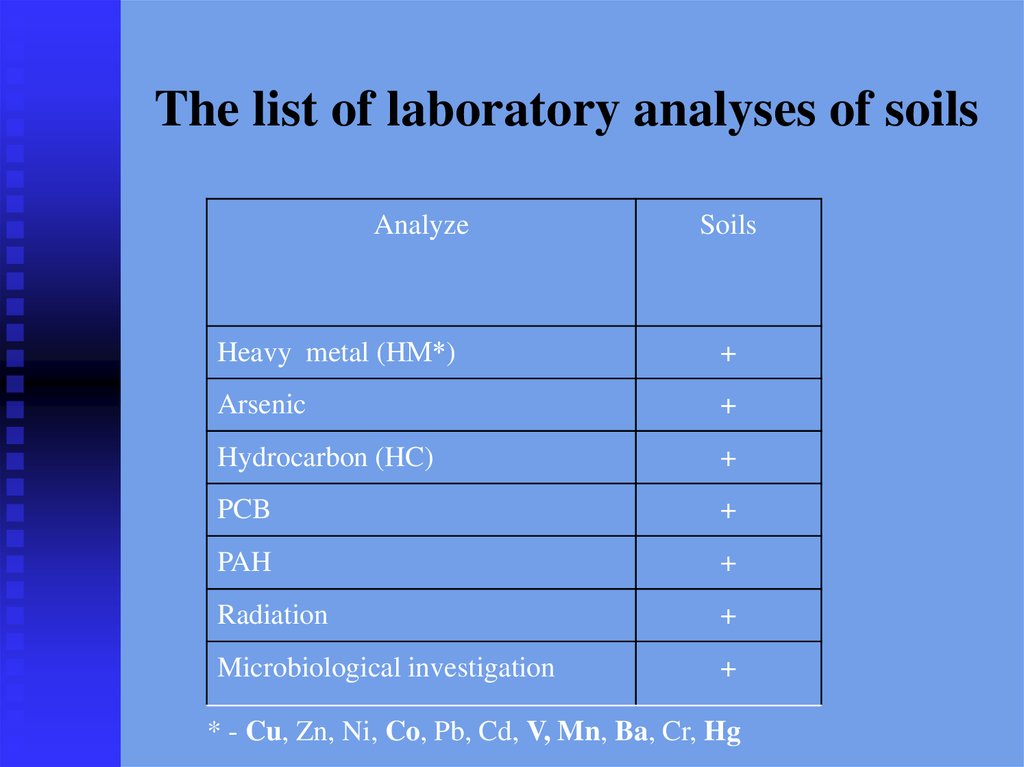
The list of laboratory analyses of soilsAnalyze
Soils
Heavy metal (HМ*)
+
Arsenic
+
Hydrocarbon (HC)
+
PCB
+
PAH
+
Radiation
+
Microbiological investigation
+
* - Cu, Zn, Ni, Co, Pb, Cd, V, Mn, Ba, Cr, Hg
40. The regional geochemical background of soil
The rule of calculation of the regional geochemicalbackground
х + ,
where
х – average arithmetic, – standard deviation
Anomaly concentration
High anomaly concentration
х + 2
х + 3
41.
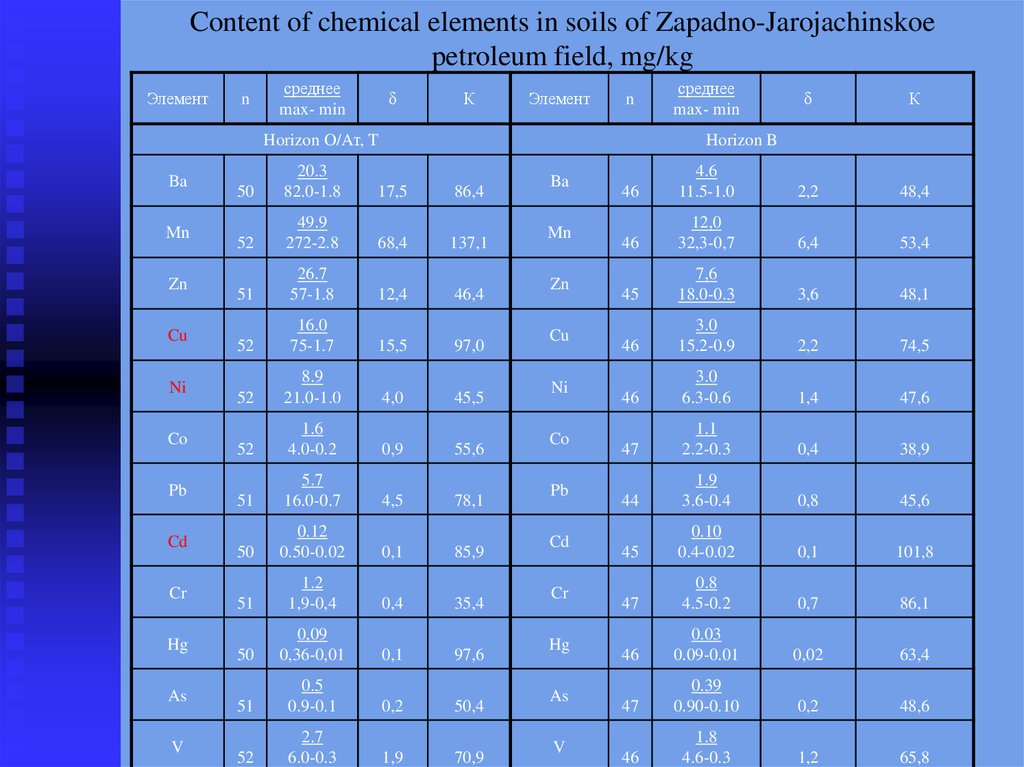
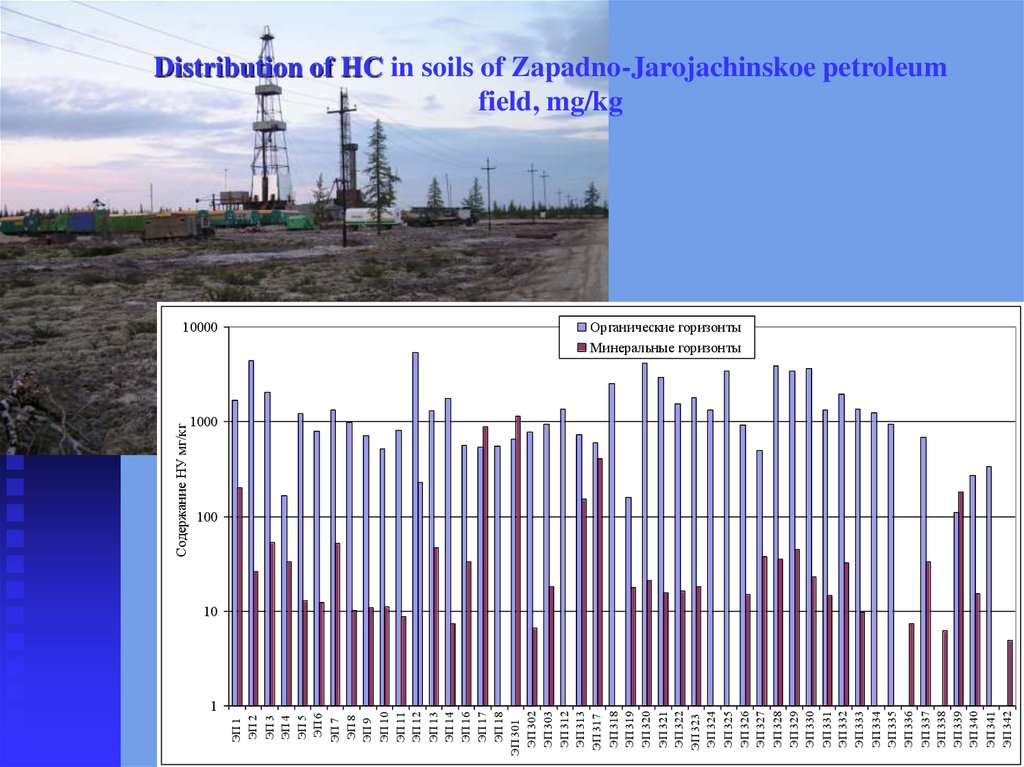
Content of chemical elements in soils of Zapadno-Jarojachinskoepetroleum field, mg/kg
Элемент
n
среднее
max- min
δ
К
Элемент
n
Horizon O/Aт, T
Ba
Mn
Zn
Cu
Ni
Co
Pb
Cd
Cr
Hg
As
V
среднее
max- min
δ
К
Horizon B
50
20.3
82.0-1.8
17,5
86,4
52
49.9
272-2.8
68,4
137,1
51
26.7
57-1.8
12,4
46,4
52
16.0
75-1.7
15,5
97,0
52
8.9
21.0-1.0
4,0
45,5
52
1.6
4.0-0.2
0,9
55,6
51
5.7
16.0-0.7
4,5
78,1
50
0.12
0.50-0.02
0,1
85,9
51
1.2
1,9-0,4
0,4
35,4
50
0,09
0,36-0,01
0,1
97,6
51
0.5
0.9-0.1
0,2
50,4
52
2.7
6.0-0.3
1,9
70,9
Ba
Mn
Zn
Cu
Ni
Co
Pb
Cd
Cr
Hg
As
V
46
4.6
11.5-1.0
2,2
48,4
46
12,0
32,3-0,7
6,4
53,4
45
7,6
18.0-0.3
3,6
48,1
46
3.0
15.2-0.9
2,2
74,5
46
3.0
6.3-0.6
1,4
47,6
47
1.1
2.2-0.3
0,4
38,9
44
1.9
3.6-0.4
0,8
45,6
45
0.10
0.4-0.02
0,1
101,8
47
0.8
4.5-0.2
0,7
86,1
46
0.03
0.09-0.01
0,02
63,4
47
0.39
0.90-0.10
0,2
48,6
46
1.8
4.6-0.3
1,2
65,8
42.
100001
ЭП 1
ЭП 2
ЭП 3
ЭП 4
ЭП 5
ЭП 6
ЭП 7
ЭП 8
ЭП 9
ЭП 10
ЭП 11
ЭП 12
ЭП 13
ЭП 14
ЭП 16
ЭП 17
ЭП 18
ЭП 301
ЭП 302
ЭП 303
ЭП 312
ЭП 313
ЭП 317
ЭП 318
ЭП 319
ЭП 320
ЭП 321
ЭП 322
ЭП 323
ЭП 324
ЭП 325
ЭП 326
ЭП 327
ЭП 328
ЭП 329
ЭП 330
ЭП 331
ЭП 332
ЭП 333
ЭП 334
ЭП 335
ЭП 336
ЭП 337
ЭП 338
ЭП 339
ЭП 340
ЭП 341
ЭП 342
Содержание НУ мг/кг
Distribution of HC in soils of Zapadno-Jarojachinskoe petroleum
field, mg/kg
Органические горизонты
Минеральные горизонты
1000
100
10
43.
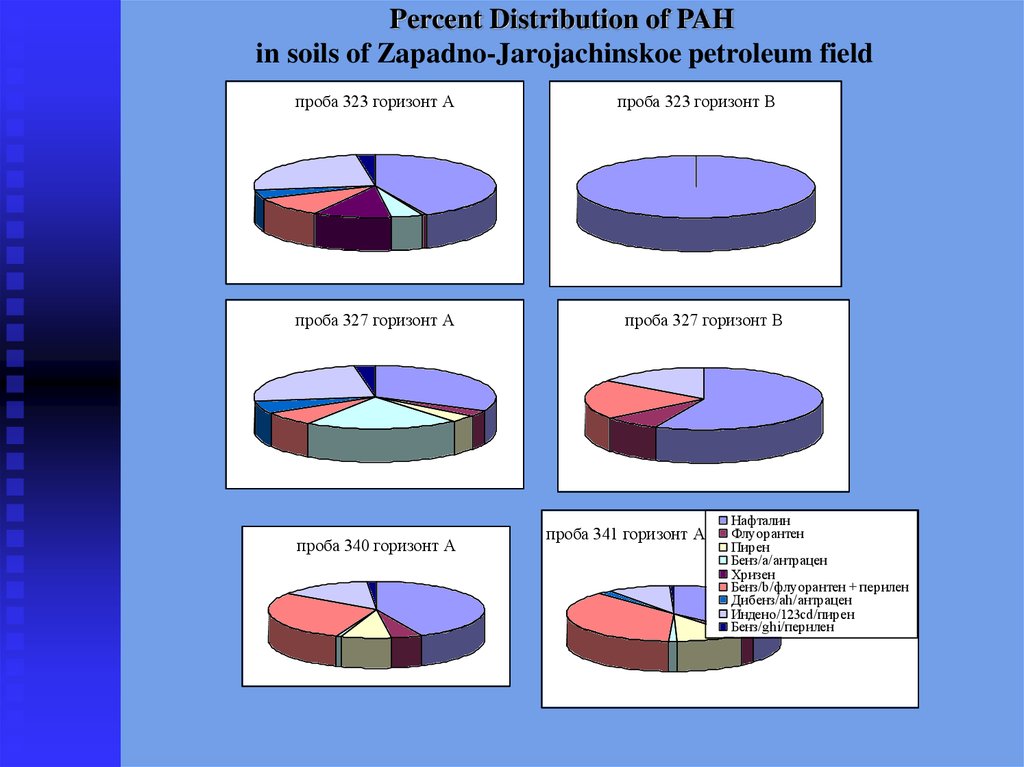
Percent Distribution of PAHin soils of Zapadno-Jarojachinskoe petroleum field
проба 323 горизонт А
проба 327 горизонт А
проба 340 горизонт А
проба 323 горизонт В
проба 327 горизонт В
проба 341 горизонт А
Нафталин
Флуорантен
Пирен
Бенз/a/антрацен
Хризен
Бенз/b/флуорантен + перилен
Дибенз/ah/антрацен
Индено/123cd/пирен
Бенз/ghi/перилен
44. Total Coefficient of Soil Pollution
nZс
Ci.опр
С
i 1 i. рф
(n 1)
where: Сi опр – value is determined by the
content of i-toxicant in the soil ;
Сi рф – value of regionally-background
content in the soil of i-toxicant .
45. The indexes of total pollution of landscape components are calculated. The estimation of environmental pollution degree is made.
Category of soil pollutionValue ZC
Allowable
Weak
1-8
Changes in health
Without any changes
the lowest morbidity
8-16
Average
Strong
16-32
32-64
Very strong
64-128
increase in the overall incidence
increase in overall morbidity, including
children
increase in overall morbidity, including
children, violation of reproductive
function of women, the increase of
cancer incidence
46.
Значение Zc32
30
28
26
24
22
20
18
16
14
12
10
8
6
4
2
0
54A
68A
1A
2At
3A
4A
5A
6A
7A
8A
9A
10A
11A
12A
13A
13T
14A
14T
15A
15T
16A
16T
17A
17T
18A
19A
19T
20A
20T
21A
22A
23A
51A
52A
53A
55A
56A
57A
57M
58A
59A
60A
60T
61A
62A
62T
63A
64A
65A
65T
66A
67A
67T
69A
69T
70A
70T
71A
72A
73A
74A
75A
76A
Distribution of Soil Pollution
Index
№ пробы
allowable degree of pollution,
weak level of pollution,
the average degree of pollution
47. Method of the main component of the factorial analysis
It is revealed 5 factors defining 85 % of all correlationcommunications.
Hg68 Zn62 Cu53 HC40
V64 Cr59
It is interpreted as anthropogenous factor, caused by pollution as a
result of investigation and development oil-gas deposits of a tundra
zone.
48. Parity of natural and anthropogenic factors in the formation of the chemical compound of oil-gas deposits soils of Urengoj-tundra
%factor
Factor
Peat horizons
Mineral horizons
The factor of spreading rocks
26
41
Natural factors of soil formation
21
15
34
29
Anthropogenic factors of soil
formation