


 internet
 sociology
Similar presentations:
")


Television consumption in France
1.
DIGITAL & TRENDSTelevision consumption in
France
2.
Table of Contents01 Overview
Share of French households owning a television 2017-2020
Average daily television viewing time in France 2005-2021
03
04
21
Broadcasting hours of reality TV programs in France 2010-2019
22
Broadcasting hours of cohabitation-type reality TV programs in France 2010-2019
23
TV subscription by brand in France 2022
24
Impact of the lockdown caused by coronavirus on TV show consumption in France 2020
05
TV penetration in France 2015-2020, by broadcasting technology
06
Number of television sets sold in France 2016-2019
07
Daily television viewing time in European countries 2020
08
Catch-up TV penetration in France 2011-2022
26
09
Online catch-up TV penetration among men and women in France 2011-2021
27
Replay TV usage penetration in France 2011-2021, by device
28
Volume of online catch-up TV consumption monthly in France 2015-2021
29
Breakdown of replay TV usage frequency in France 2011-2021
30
Daily television usage penetration in European countries 2022
02 Consumption
04 Catch-up TV
Overall consumption of online TV shows in France 2011-2021
11
Number of hours per week spent watching television in France 2021, by age
12
Ranking of the most-used smart TV features in France 2020
13
Television set usage frequency during holiday season in France 2020
14
Distribution of online television consumption in France 2011-2021, by genre
32
15
Ranking of video-on-demand platforms in France 2021, by usage
33
AVoD platforms watched by French CTV users in 2021
34
TV VOD: consumer spending in France 2008-2021
35
Paid subscription to a VOD service during lockdown in France April 2020
36
Pay-per-view revenues in France 2012-2021, by fee-for-service type
37
TV set usage frequency during the holiday season due to lockdowns in France 2020
03 Television channels and programs
Audience share of the leading TV channels in France 2021
1
Most popular French TV series among French viewers 2020
17
Number of new TV series premiered by free TV channels in France 2017-2021, by channel
18
Most popular TV series among French viewers 2020
19
Most popular TV programs in France 2021, by audience
20
05 Video on demand
3.
CHAPTER 01Overview
4.
Share of French households owning at least one television set from 2017 to2020
Share of French households owning a television 2017-2020
100
94,1
93,6
93,1
92
Q2 2017
Q2 2018
Q2 2019
Q2 2020
90
80
Share of households
70
60
50
40
30
20
10
0
3
Description: The share of French households owning at least one television set has been decreasing slightly since 2017. In the second quarter of 2020, 92 percent of French households owned a television, while the share reached more than 94 percent in the second quarter of
2017. Read more
Note(s): France; December 31, 2020
Source(s): Conseil supérieur de l’audiovisuel
5.
Average television viewing time per day in France from 2005 to 2021 (inminutes)
Average daily television viewing time in France 2005-2021
240
234
235
230
Time in minutes
230
227
226
224
225
223
221
222
219
220
216
215
212
210
210
207
206
204
205
204
205
200
2005
4
2006
2007
2008
2009
2010
2011
2012
2013
2014
2015
2016
2017
2018
2019
Description: In 2021, the average daily television viewing time in France came to a total of 219 minutes, or three hours and 39 minutes, which represents a decrease of 15 minutes compared to the previous year. The average viewing time has been continuously declining since
2015 before peaking in 2020 at 234 minutes in total. Read more
Note(s): France; 2005 to 2021; 4 years and older; television owners in metropolitan France
Source(s): Conseil supérieur de l’audiovisuel; Médiamétrie
2020
2021
6.
Would you say that you watch more TV shows during lockdown?Impact of the lockdown caused by coronavirus on TV show consumption in France 2020
Less than before lockdown 7%
The same amount
38%
5
More than before
lockdown 55%
Description: This statistic shows the impact of the lockdown caused by coronavirus on TV show consumption in France in March 2020. The majority of respondents stated that they watched more TV shows than before lockdown, while 38 percent claimed that they consumed
the same amount as before. Read more
Note(s): France; March 26-27, 2020; 1,050 respondents; 15 years and older
Source(s): Hadopi; IFOP
7.
Household penetration of television reception in France from 1st quarter 2015to 4th quarter 2020, by broadcasting technology
TV penetration in France 2015-2020, by broadcasting technology
Terrestrial
IPTV
Satellite
Penetration of broadcasting technology
70%
60%
50%
40%
30%
20%
10%
Q1
Q2
Q3
Q4
Q1
Q2
Q3
Q4
Q1
Q2
Q3
Q4
Q1
Q2
Q3
Q4
Q1
Q2
Q3
Q4
Q1
Q2
Q3
Q4
2015 2015 2015 2015 2016 2016 2016 2016 2017 2017 2017 2017 2018 2018 2018 2018 2019 2019 2019 2019 2020 2020 2020 2020
6
Description: As of the fourth quarter of 2020, roughly 56 percent of households received terrestrial television in France. Under a quarter of households had satellite TV during that same period, a number that has been slowly decreasing over the past years. Read more
Note(s): France; Q1 2015 to Q4 2020
Source(s): Conseil supérieur de l’audiovisuel
8.
Number of television sets sold in France from 2016 to 2019 (in millions)Number of television sets sold in France 2016-2019
7
6,5
Number of TVs sold in millions
6
5
4,5
4,5
4,4
2017
2018
2019
4
3
2
1
0
2016
7
Description: This statistic shows the volume sales of television sets in France from 2016 to 2019. According to the source, television sales fell by two million units between 2016 and 2017. In 2019, the French bought 4.4 million television sets. Read more
Note(s): France; 2016 to 2019
Source(s): GfK; Syndicat National de la Publicité Télévisée
9.
Average time spent watching television daily in European countries in 2020 (inminutes)
Daily television viewing time in European countries 2020
Daily viewing time in minutes
Portugal
350
Serbia
340
Romania
312
Greece
308
Hungary
295
Macedonia
290
Croatia
282
Turkey
273
Italy
272
Bulgaria
270
Poland
270
Slovakia
262
Belgium (south)
259
Belarus
Europe
8
246
235
Description: According to the most recent data, the average time spent watching television across all European countries came to a total of 235 minutes per day in 2020. Portuguese TV viewers spent the longest time in front of their television at nearly six hours daily. Read
more
Note(s): Europe; 2020; Monday to Sunday; linear and non-linear TV usage; excl. use of mobile dvices
Source(s): Glance; Médiamétrie; RTL Adconnect; Various sources (local institutes )
10.
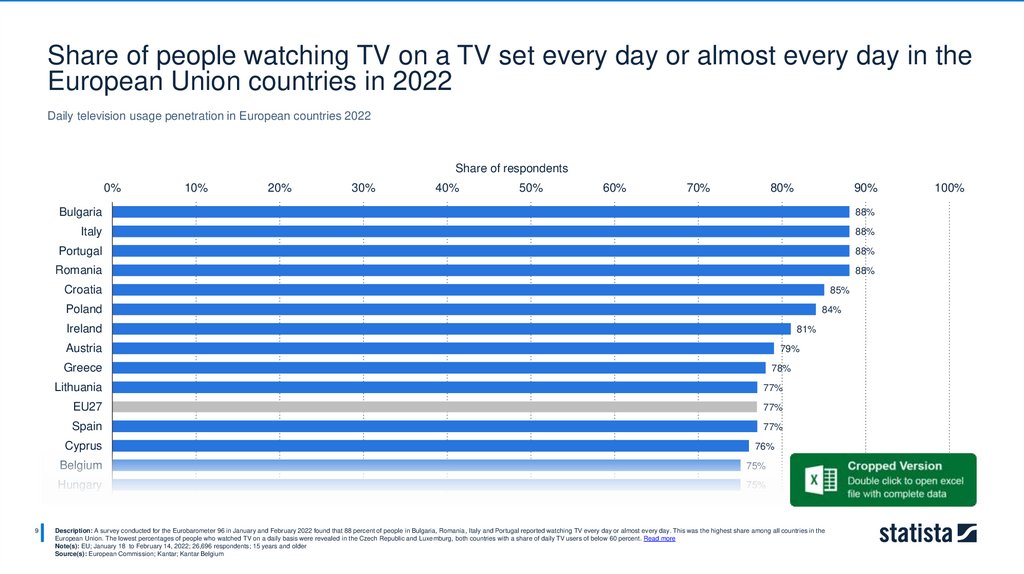
Share of people watching TV on a TV set every day or almost every day in theEuropean Union countries in 2022
Daily television usage penetration in European countries 2022
Share of respondents
0%
10%
20%
30%
40%
50%
60%
70%
80%
90%
Bulgaria
88%
Italy
88%
Portugal
88%
Romania
88%
Croatia
85%
Poland
84%
Ireland
81%
Austria
79%
Greece
Lithuania
77%
EU27
77%
Spain
77%
Cyprus
9
78%
76%
Belgium
75%
Hungary
75%
Description: A survey conducted for the Eurobarometer 96 in January and February 2022 found that 88 percent of people in Bulgaria, Romania, Italy and Portugal reported watching TV every day or almost every day. This was the highest share among all countries in the
European Union. The lowest percentages of people who watched TV on a daily basis were revealed in the Czech Republic and Luxemburg, both countries with a share of daily TV users of below 60 percent. Read more
Note(s): EU; January 18 to February 14, 2022; 26,696 respondents; 15 years and older
Source(s): European Commission; Kantar; Kantar Belgium
100%
11.
CHAPTER 02Consumption
12.
Overall consumption of online TV shows in France between 2011 and 2021Overall consumption of online TV shows in France 2011-2021
50%
48%
46%
45%
43%
Share of respondents
42%
40%
37%
35%
35%
33%
32%
31%
31%
30%
30%
25%
December
2011
11
October 2012
May 2013
October 2013
May 2014
May 2016
May 2017
March 2018
Description: The online consumption of TV shows has been constantly increasing over the past decade. While 31 percent of respondents watched TV series online as of 2011, that value almost reaches 50 percent by 2021. Read more
Note(s): France; 2011 to 2021; 5,003 respondents; 15 years and older
Source(s): Hadopi; IFOP
May 2019
June 2020
May 2021
13.
Distribution of the French population according to the number of hours spentwatching television per week in 2021, by age
Number of hours per week spent watching television in France 2021, by age
None
7 hours or less
8 to 14 hours
From 15 to 21 hours
More than 21 hours
More than 35 hours
100%
90%
2%
9%
Proportion of respondents
80%
70%
24%
3%
11%
22%
29%
15%
27%
22%
22%
24%
45%
30%
26%
20%
12%
12%
10%
2%
60-69 years old
11%
19%
29%
35%
15%
10%
0%
16%
19%
40%
20%
5%
12-17 years old
12
10%
12%
18%
60%
50%
4%
6%
11%
18-24 years old
10%
25-39 years old
4%
40-59 years old
Description: As of 2021, French people aged 70 and older were the consumers who watched the most television per week. While around 20 percent of them watched television more than 35 hours a week, two percent of consumers aged between 12 and 17 years old did the
same. Read more
Note(s): France; 2021; 4,029 respondents; 12 years and older; Metropolitan France
Source(s): ARCEP; CRÉDOC; Délégation nationale de la lutte contre la fraude
3%
70 and older
14.
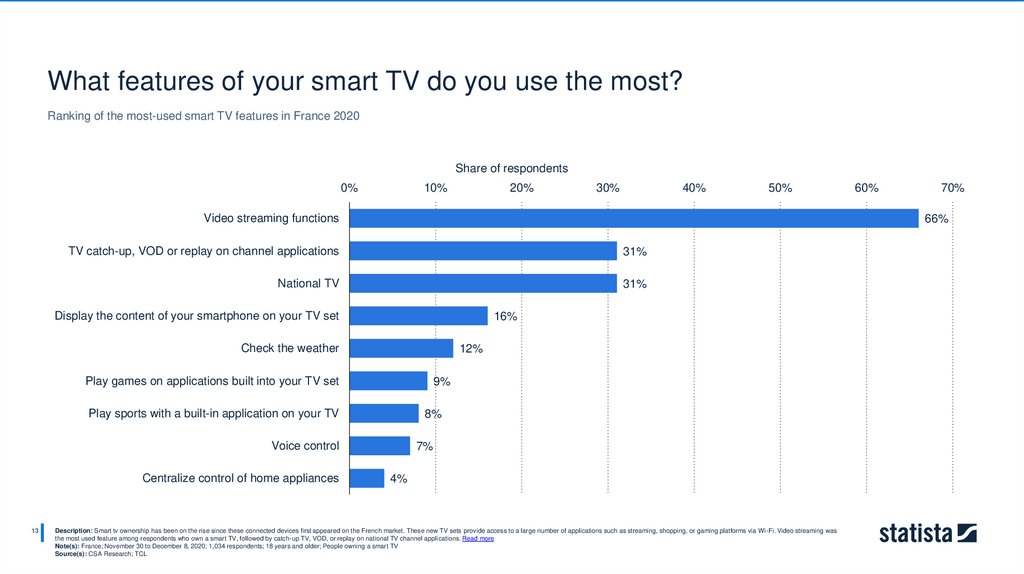
What features of your smart TV do you use the most?Ranking of the most-used smart TV features in France 2020
Share of respondents
0%
10%
20%
30%
40%
50%
Video streaming functions
31%
National TV
31%
Display the content of your smartphone on your TV set
16%
Check the weather
12%
Play games on applications built into your TV set
9%
Play sports with a built-in application on your TV
8%
Voice control
13
70%
66%
TV catch-up, VOD or replay on channel applications
Centralize control of home appliances
60%
7%
4%
Description: Smart tv ownership has been on the rise since these connected devices first appeared on the French market. These new TV sets provide access to a large number of applications such as streaming, shopping, or gaming platforms via Wi-Fi. Video streaming was
the most used feature among respondents who own a smart TV, followed by catch-up TV, VOD, or replay on national TV channel applications. Read more
Note(s): France; November 30 to December 8, 2020; 1,034 respondents; 18 years and older; People owning a smart TV
Source(s): CSA Research; TCL
15.
Do you use your TV more often during the holiday season?Television set usage frequency during holiday season in France 2020
More frequently 25%
About the same 64%
14
Less frequently
11%
Description: The holiday season is an opportunity for many French people to get together with family and friends and celebrate. While hearty meals and the exchange of gifts are more often associated with this particular time of year, French people also take advantage of this
time to spend more time in front of their television sets. In 2020, a quarter of respondents said they used their TV set more often during the holiday season, whether to watch TV or play games. Read more
Note(s): France; November 30 to December 8, 2020; 1,034 respondents; 18 years and older; People owning at least one TV set
Source(s): CSA Research; TCL
16.
Do you think you will use your television set more during the holiday seasonthan you did in previous years due to the coronavirus pandemic?
TV set usage frequency during the holiday season due to lockdowns in France 2020
A lot more
11%
About the same 45%
A little more 36%
A lot less 1%
15
A little less 7%
Description: Many French people spent more time at home in 2020 due to the several lockdowns set up by the French government to fight the coronavirus outbreak. Half of the respondents stated that that phenomenon had an impact on their movie consumption habits and that
they had watched more movies than usual. That is no surprise then that almost half of respondents plan to use their television set more frequently during the holiday season due to these restrictions. Read more
Note(s): France; November 30 to December 8, 2020; 1,034 respondents; 18 years and older; People owning at least one TV set
Source(s): CSA Research; TCL
17.
CHAPTER 03Television channels and
programs
18.
Audience distribution among the leading television channels in France in 2021Audience share of the leading TV channels in France 2021
Audience share
0%
5%
10%
15%
TF 1
19,7%
France 2
14,7%
France 3
9,4%
M6
9,1%
France 5
17
20%
3,3%
TMC
3%
Arte
2,9%
BFMTV
2,9%
C8
2,6%
W9
2,5%
RMC Découverte
2%
CNews
2%
TF1 série films
1,9%
RMC
1,6%
L'Équipe
1,5%
Description: As of 2021, the private national TV channel called TF1 was the leading television channel in France with a market share of 19.7 percent. It was followed by France 2, the first public national TV channel, whose market share amounted to 14.7 percent that year. In
2020, TF1's revenue exceeded two billion euros. Read more
Note(s): France; 2021
Source(s): Médiamétrie; Puremédias (ozap.com)
25%
19.
Number of new television series premiered by free TV channels in Francefrom 2017 to 2021, by channel
Number of new TV series premiered by free TV channels in France 2017-2021, by channel
TF1
M6
2017
5
3
2018
4
6
1
2019
8
5
3
2020 (before SALTO)
3
7
1
2020 (after SALTO)
2021
18
1
France TV
SALTO
2
11
2
9
Description: In an effort to counter streaming giants such as Netflix, French free-to-air TV channels TF1, M6 and France TV have decided to found a jointly-owned SVOD company called SALTO. Since then, the number of TV series produced by each channel has dropped
sharply in favor of series launched on this new platform. In 2021, nine new series have premiered on SALTO, while TF1 and M6 premiered one and two series respectively. Read more
Note(s): France; 2017 to May 2021
Source(s): 3Vision
20.
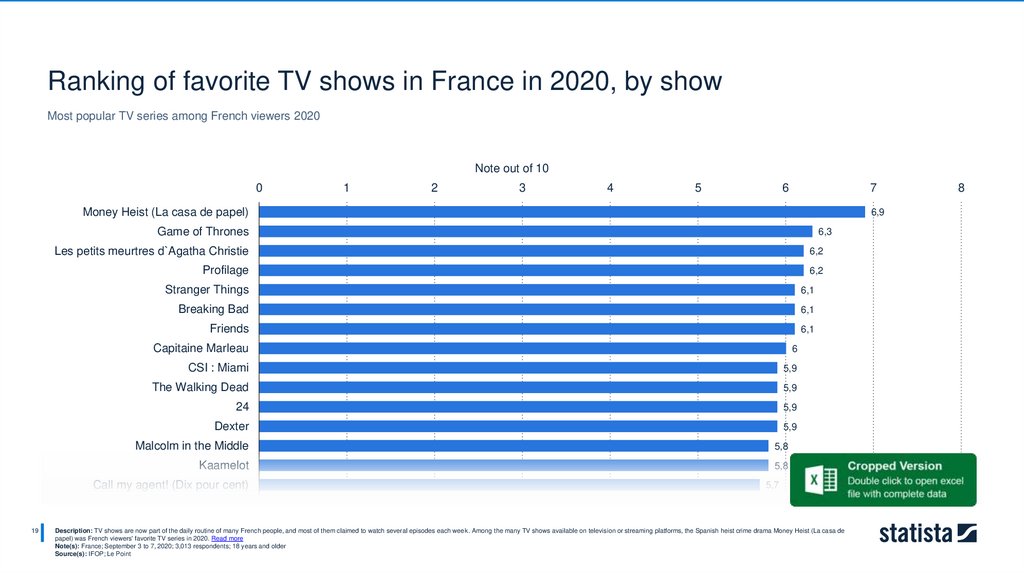
Ranking of favorite TV shows in France in 2020, by showMost popular TV series among French viewers 2020
Note out of 10
0
1
2
3
4
5
6
7
Money Heist (La casa de papel)
6,9
Game of Thrones
Les petits meurtres d`Agatha Christie
6,2
Profilage
6,2
Stranger Things
6,1
Breaking Bad
6,1
Friends
6,1
Capitaine Marleau
6
CSI : Miami
5,9
The Walking Dead
5,9
24
5,9
Dexter
5,9
Malcolm in the Middle
5,8
Kaamelot
5,8
Call my agent! (Dix pour cent)
19
6,3
5,7
Description: TV shows are now part of the daily routine of many French people, and most of them claimed to watch several episodes each week. Among the many TV shows available on television or streaming platforms, the Spanish heist crime drama Money Heist (La casa de
papel) was French viewers' favorite TV series in 2020. Read more
Note(s): France; September 3 to 7, 2020; 3,013 respondents; 18 years and older
Source(s): IFOP; Le Point
8
21.
Ranking of most watched TV programs in France in 2021, by number ofviewers (in millions)
Most popular TV programs in France 2021, by audience
Number of viewers in millions
0
2
4
6
8
10
12
14
16
Foot-Euro 2020: France-Switzerland
16,4
Foot-Euro 2020: France-Portugal
15,6
Foot-Euro 2020: France-Germany
15,2
President Emmanuel Macron's televised speech of March 31 (TF1)
12,6
HPI: Colin Maillard
12,4
Foot-Euro 2020: France-Hungary
12,3
HPI: Cocktail Molotov
12
Foot-Euro 2020: Italy-England
11,8
HPI: Phyllobates terribilis
11,8
HPI: Vents d'ouest
11,5
HPI: Tel maître tel chien
11,4
HPI: Coutume malgache
11,3
HPI: Homme de peu de foi
11,1
HPI: Hep et soja
President Emmanuel Macron's televised speech of March 31 (France 2)
20
18
10,7
9,9
Description: The year 2020 was heavily impacted by the emergence of the coronavirus pandemic. Television was one the media mostly used by French people in order to keep updated on the outbreak, mostly thanks to televised news. The televised speeched of President
Emmanuel Macron and both Jean Castex and Edouard Philippe as Prime Minister topped the list of the most watched TV programs during that year. Read more
Note(s): France; 2021
Source(s): Les Échos; Médiamétrie
22.
Ranking of favorite French TV shows in France in 2020, by showMost popular French TV series among French viewers 2020
Note out of 10
0
1
2
3
4
5
6
Les petits meurtres d`Agatha Christie
6,2
Profilage
6,2
Capitaine Marleau
6
Kaamelott
5,8
Call my agent! (Dix pour cent)
5,7
Engrenages
5,6
The Bureau (Le Bureau des légendes)
5,6
Alice Nevers, le juge est une femme
5,5
Baron Noir
Plus belle la vie
21
7
5,1
3,9
Description: When it comes to the TV series French viewers enjoy, many among them turn to French productions. Les petits meurtres d`Agatha Christie, which ranked third in the ranking of most popular shows in France, shared the first position with Profilage as favori te French
TV series in 2020. Capitaine Marleau and Kaamelott followed closely with a total score of around 6 out of 10. Read more
Note(s): France; September 3 to 7, 2020; 3,013 respondents; 18 years and older
Source(s): IFOP; Le Point
23.
Number of hours of general reality TV shows in France from 2010 to 2019Broadcasting hours of reality TV programs in France 2010-2019
12 000
10 567
10 873
10 838
9 645
10 000
8 503
Number of hours
8 000
6 000
5 504
4 499
4 000
2 000
3 289
1 988
1 817
2010
2011
0
22
2012
2013
2014
2015
2016
2017
2018
Description: Reality TV arrived on the small French screens nearly twenty years ago, at the beginning of the millennium. Thanks to the impressive success of programs such as Big Brother, French programs such as Loft Story or Secret Story have brought thousands of viewers
together daily. Since 2010, the number of hours broadcast has exploded, reaching its peak in 2017 before decreasing slightly. Read more
Note(s): France; 2010 to 2019
Source(s): Conseil supérieur de l’audiovisuel
2019
24.
Number of hours of "cohabitation" reality TV shows in France from 2010 to2019
Broadcasting hours of cohabitation-type reality TV programs in France 2010-2019
3 500
2 991
3 000
2 751
Number of hours
2 500
2 057
2 017
2 000
1 653
1 526
1 500
1 339
1 106
1 000
910
784
500
0
2010
23
2011
2012
2013
2014
2015
2016
2017
2018
Description: "Cohabitation" reality TV was the most common reality TV subgenre, as can be seen with the popularity of programs such as Big Brother or its French counterparts Loft Story and Secret Story. In these programs, a group of strangers lived together, often in an
isolated location, to take part in different types of tests or competitions, most of the time resulting in the elimination of participants. That subgenre reached its peak number of broadcasting hours in 2017 and has decreased since then, [...] Read more
Note(s): France; 2010 to 2019
Source(s): Conseil supérieur de l’audiovisuel
2019
25.
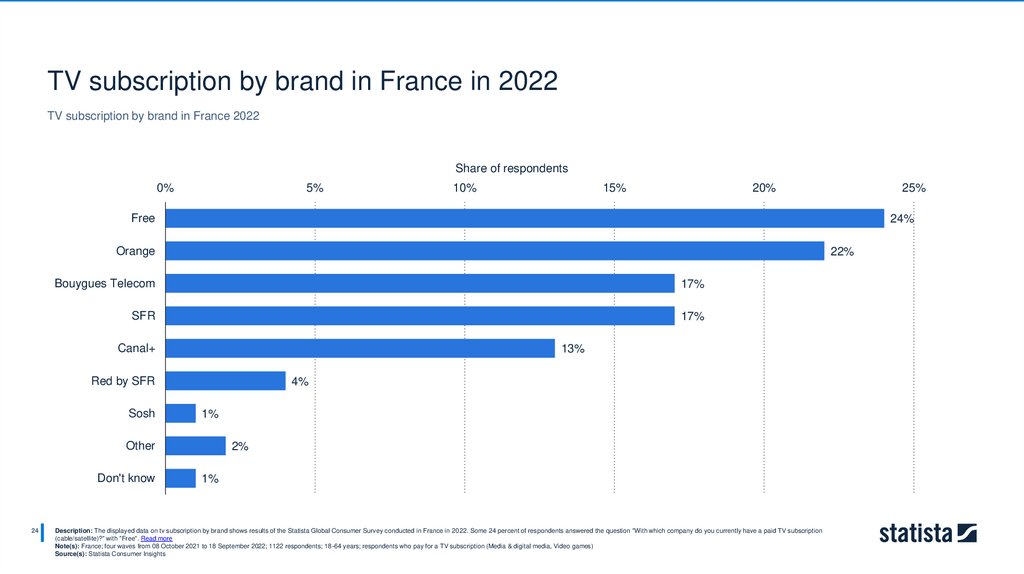
TV subscription by brand in France in 2022TV subscription by brand in France 2022
Share of respondents
0%
5%
10%
15%
20%
25%
Free
24%
Orange
22%
Bouygues Telecom
17%
SFR
17%
Canal+
13%
Red by SFR
Sosh
4%
1%
Other
Don't know
24
2%
1%
Description: The displayed data on tv subscription by brand shows results of the Statista Global Consumer Survey conducted in France in 2022. Some 24 percent of respondents answered the question "With which company do you currently have a paid TV subscription
(cable/satellite)?" with "Free". Read more
Note(s): France; four waves from 08 October 2021 to 18 September 2022; 1122 respondents; 18-64 years; respondents who pay for a TV subscription (Media & digital media, Video games)
Source(s): Statista Consumer Insights
26.
CHAPTER 04Catch-up TV
27.
Penetration of catch-up television viewing in France from June 2011 toSeptember 2022
Catch-up TV penetration in France 2011-2022
85%
Penetration rate
80%
75%
70%
65%
60%
Jun 2011
Dec 2011
Jun 2012
Dec 2012
Jun 2013
Dec 2013
Jun 2014
Dec 2014
Jun 2015
Dec 2015
Jun 2016
Dec 2016
Jun 2017
Dec 2017
Jun 2018
Dec 2018
April 2019
Sept 2019
Oct 2019
Nov 2019
Dec 2019
Jan 2020
Feb 2020
Mars 2020
Avr 2020
May 2020
June 2020
July 2020
August 2020
Sept 2020
Oct 2020
Nov 2020
Dec 2020
Jan 2021
Feb 2021
Mars 2021
Avr 2021
May 2021
June 2021
July 2021
August 2021
Sept 2021
Oct 2021
Nov 2021
Jan 2022
Feb 2022
Mars 2022
Avr 2022
May 2022
June 2022
July 2022
August 2022
Sept 2022
55%
26
Description: Over the past decade, the penetration rate for catch-up TV reached its peak in June 2017 with a total of 82.6 percent. Since then, that value has stayed relatively stable at around 70 percent. As of September 2022, 68.9 percent of respondents stated viewing catchup television programs. Read more
Note(s): France; June 2011 to September 2022; 1,000 respondents; 3 years and older; 3 years and older from June 2020 on
Source(s): Centre national du cinéma et de l’image animée; Vertigo Research
28.
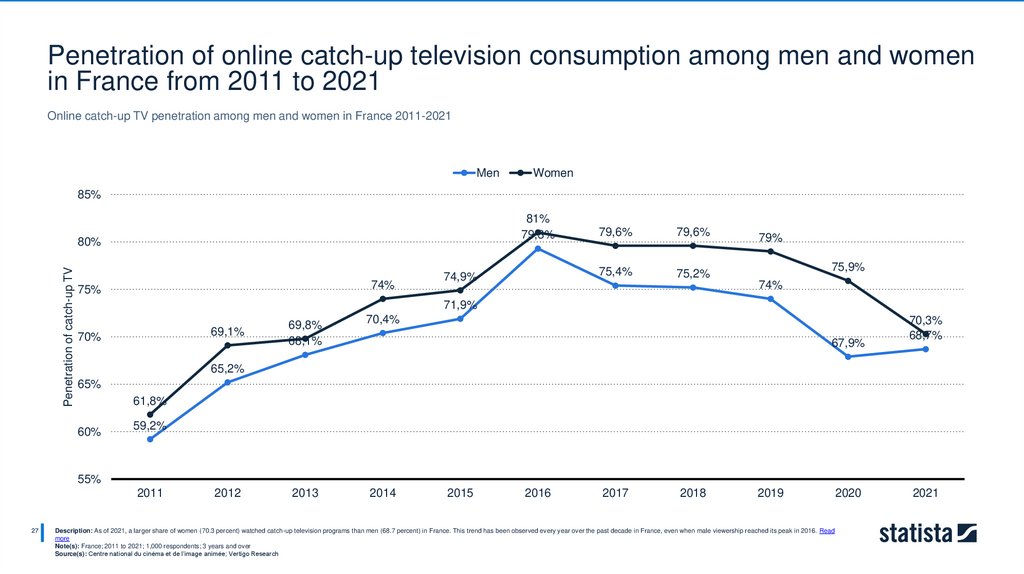
Penetration of online catch-up television consumption among men and womenin France from 2011 to 2021
Online catch-up TV penetration among men and women in France 2011-2021
Men
Women
85%
81%
79,3%
Penetration of catch-up TV
80%
74%
75%
74,9%
79,6%
79,6%
75,4%
75,2%
79%
75,9%
74%
71,9%
69,1%
70%
69,8%
68,1%
70,4%
2013
2014
67,9%
70,3%
68,7%
65,2%
65%
61,8%
60%
59,2%
55%
2011
27
2012
2015
2016
2017
2018
2019
Description: As of 2021, a larger share of women (70.3 percent) watched catch-up television programs than men (68.7 percent) in France. This trend has been observed every year over the past decade in France, even when male viewership reached its peak in 2016. Read
more
Note(s): France; 2011 to 2021; 1,000 respondents; 3 years and over
Source(s): Centre national du cinéma et de l’image animée; Vertigo Research
2020
2021
29.
Usage penetration of catch-up television in France from January 2011 toNovember 2021, by device used
Replay TV usage penetration in France 2011-2021, by device
Television
Computer
Mobile device
90%
80%
Share of respondents
70%
60%
50%
40%
30%
20%
10%
0%
Jan
Jul
Jan
Jul
Jan
Jul
Jan
Jul
Jan
Jul
Jan
Jul
Jan
Jul
Jan
Jan Sep Jan Aug Nov Jan Aug Nov
2011 2011 2012 2012 2013 2013 2014 2014 2015 2015 2016 2016 2017 2017 2018 2019 2019 2020 2020 2020 2021 2021 2021
28
Description: In January 2011, five percent of respondents had watched a catch-up TV program on a mobile device in the last 30 days, whereas that value increased to reached 33.5 percent as of November 2021. While computer and mobile devices both experienced a
consumption increae over the past decade, computers were increasing less used to watch catch-up television. Read more
Note(s): France; January 2011 to November 2021; 1,000 respondents; 3 years and more; usage in the last 30 days
Source(s): Centre national du cinéma et de l’image animée; Vertigo Research
30.
Number of catch-up TV videos watched monthly in France from March 2015 toSeptember 2021 (in million of video views)
Volume of online catch-up TV consumption monthly in France 2015-2021
1 100
971,6
1 000
Video views in millions
900
843,4
815,5
773,9
800
739,5
738,8
699,2
700
587
573
600
527,2 536,2
480,5
500
625,3 609,4
544,8
636,8
659,4
674
634,2
574,7
565,1
534,3
505
432,1
427
376,1
400
300
Mar
'15
29
Jun
'15
Sep Dec
'15 '15
Mar
'16
Jun
'16
Sep Dec
'16 '16
Mar
'17
Jun
'17
Sep Dec
'17 '17
Mar
'18
Jun
'18
Sep Dec
'18 '18
Mar
'19
Sep Dec
'19 '19
Mar
'20
Jun
'20
Sep Dec
'20 '20
Description: Over the past decade, the monthly number of views of catch-up TV programs in France has been slowly increasing until reaching its highest value in March 2020. Since then, that number has slowly been decreasing and reached a total of 574.7 million videos as of
September 2021. Read more
Note(s): France; March 2015 to September 2021; 1,000 respondents; 3 years and older
Source(s): GfK; NPA Conseil
Mar
'21
Jun
'21
Sep
'21
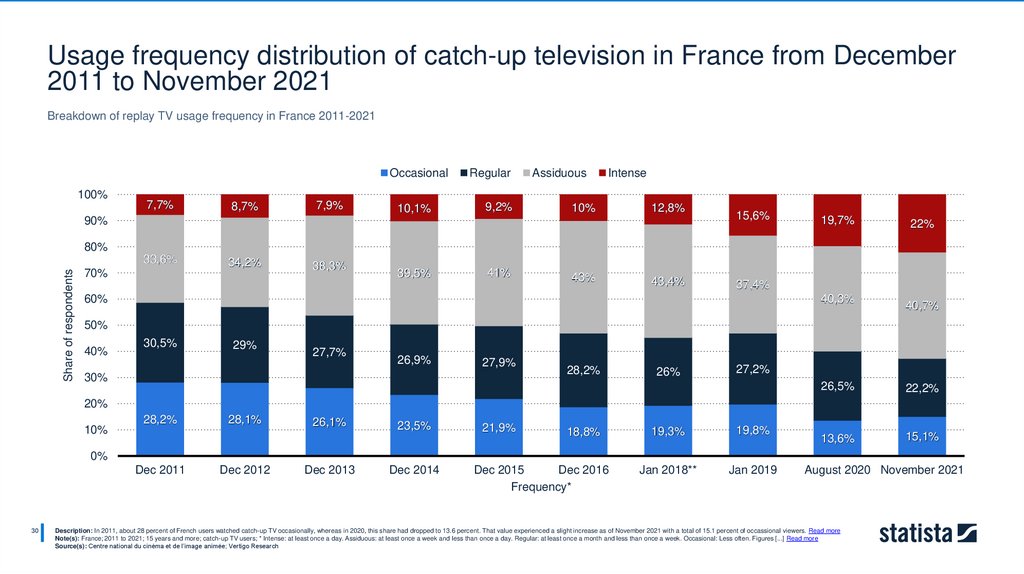
31.
Usage frequency distribution of catch-up television in France from December2011 to November 2021
Breakdown of replay TV usage frequency in France 2011-2021
Occasional
100%
7,7%
8,7%
7,9%
10,1%
Regular
9,2%
Assiduous
Intense
10%
12,8%
90%
15,6%
19,7%
22%
80%
Share of respondents
33,6%
70%
34,2%
38,3%
39,5%
41%
43%
43,4%
37,4%
40,3%
60%
40,7%
50%
40%
30,5%
29%
27,7%
26,9%
27,9%
30%
28,2%
26%
27,2%
26,5%
22,2%
13,6%
15,1%
20%
10%
28,2%
28,1%
26,1%
23,5%
21,9%
18,8%
19,3%
19,8%
Jan 2018**
Jan 2019
0%
Dec 2011
30
Dec 2012
Dec 2013
Dec 2014
Dec 2015
Dec 2016
Frequency*
August 2020 November 2021
Description: In 2011, about 28 percent of French users watched catch-up TV occasionally, whereas in 2020, this share had dropped to 13.6 percent. That value experienced a slight increase as of November 2021 with a total of 15.1 percent of occassional viewers. Read more
Note(s): France; 2011 to 2021; 15 years and more; catch-up TV users; * Intense: at least once a day. Assiduous: at least once a week and less than once a day. Regular: at least once a month and less than once a week. Occasional: Less often. Figures [...] Read more
Source(s): Centre national du cinéma et de l’image animée; Vertigo Research
32.
CHAPTER 05Video on demand
33.
Breakdown of online television consumption in France from 2011 to 2021, bygenre
Distribution of online television consumption in France 2011-2021, by genre
Entertainment
Fiction
2012
2013
Youth
Live TV
Magazine
Information
Sport
2015
2016
2017
Cinema
Other
Documentary
100%
Share of online TV consumption
90%
80%
70%
60%
50%
40%
30%
20%
10%
0%
2011
32
2014
2018
2019
2020
Description: Out of the television programs watched online by French viewers in 2021, roughly 38 percent belonged to the fiction genre and less than 13 percent were entertainment programs. Both these values experienced a slight increase in comparison to the previous year.
Read more
Note(s): France; 2011 to 2021
Source(s): GfK; NPA Conseil
2021
34.
Ranking of video-on-demand platforms in France in December 2021, byusage
Ranking of video-on-demand platforms in France 2021, by usage
Share of respondents
0%
10%
20%
30%
40%
50%
60%
Netflix
63,1%
Amazon Prime Vidéo
41,7%
Disney+
29,5%
Orange (VOD)
15,8%
Arte (VOD)
33
70%
12,8%
Canal+ Séries
11%
Canal VOD
10,7%
Google Play
9,5%
SFR Play
9,2%
Apple TV +
8,9%
Salto
8,6%
Rakuten TV (VOD)
6,8%
Capuseen
6,5%
Filmo TV
6,3%
iTunes
6,3%
Description: As of November 2021, 63.1 percent of consumers who watched a video program on a video-on-demand platform did it on Netflix. Amazon Prime came in second position with 41.7 percent of respondents, while Disney+ managed to obtain the third position a littl e
more than a year after its launch in France in April 2020. Read more
Note(s): France; December 2021; 1,000 respondents; 15 years and older; consumers who have paid to watch movies or TV programs on VOD
Source(s): Centre national du cinéma et de l’image animée; Vertigo Research
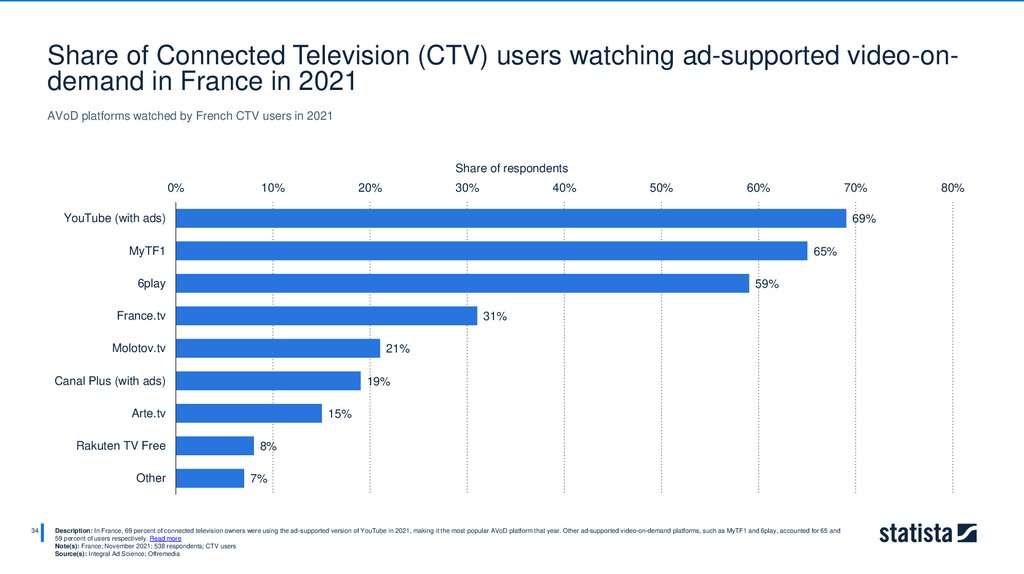
35.
Share of Connected Television (CTV) users watching ad-supported video-ondemand in France in 2021AVoD platforms watched by French CTV users in 2021
Share of respondents
0%
10%
20%
30%
40%
50%
60%
70%
YouTube (with ads)
69%
MyTF1
65%
6play
59%
France.tv
31%
Molotov.tv
21%
Canal Plus (with ads)
19%
Arte.tv
Rakuten TV Free
Other
34
15%
8%
7%
Description: In France, 69 percent of connected television owners were using the ad-supported version of YouTube in 2021, making it the most popular AVoD platform that year. Other ad-supported video-on-demand platforms, such as MyTF1 and 6play, accounted for 65 and
59 percent of users respectively. Read more
Note(s): France; November 2021; 538 respondents; CTV users
Source(s): Integral Ad Science; Offremedia
80%
36.
Consumer spending on TV video on demand in France from 2008 to 2021 (inmillion euros)
TV VOD: consumer spending in France 2008-2021
180
161,6
160
150,6
140
154,3
145,5
160,4
150,5
159,7
147,5
134,2
133,3
129,9
Spending in million euros
125,5
120
100
99,9
92,6
80
60
40
20
0
2008
35
2009
2010
2011
2012
2013
2014
2015
2016
2017
2018
2019
Description: Consumer spending on TV video-on-demand content has been fluctuating since 2008. In 2021, French consumers spent a total of around 130 million euros on TV VOD, which represents a decrease of more than 18 percent in comparison to the previous year.
Read more
Note(s): France; 2008 to 2021
Source(s): IVF; Omdia
2020
2021
37.
Which paid video-on-demand (VOD) service did you subscribe to duringlockdown?
Paid subscription to a VOD service during lockdown in France April 2020
25%
22%
Share of respondents
20%
15%
10%
10%
9%
6%
5%
3%
3%
2%
1%
0%
Netflix
36
Disney+
Prime Video
My Canal
OCS
Youtube Premium
Apple TV +
Description: This statistic shows the video-on-demand services French viewers subscribed to during lockdown in France in April 2020. At that time, 22 percent of respondents claimed that they subscribed to Netflix since the beginning f the lockdown while 10 percent chose
Disney+, which was released in France on April 7. Read more
Note(s): France; April 16-17, 2020; 1,002 respondents; 18 years and older
Source(s): YouGov
Other
38.
Revenues of the transaction video-on-demand (TVoD) sector in France between2012 and 2021, by type of fee-for-service payment (in million euros)
Pay-per-view revenues in France 2012-2021, by fee-for-service type
Rental
Purchase
Total
300
257,68
255,65
Revenues in million euros
250
235,78
224,87
235,07
235,19
240,08
236,13
215,74
211,63
200
175,59
170,14
180,32
175,04
167,17
177,93
162,19
159,9
163,12
140,1
150
94,56
100
49,28
50
55,45
60,03
2014
2015
68,02
73,94
77,72
2016
2017
2018
80,18
2019
75,65
41,5
0
2012
37
2013
2020
Description: The emergence of video streaming platforms, such as Netflix or Amazon Prime, as well as online movie rentals and purchases, has completely revolutionized the way French people consume video content in recent years. From 2012 on, the revenues of the
transaction video-on-demand market has been fluctuating in France and has reached one of its lowest value with a total of 215.74 million euros in 2021. Read more
Note(s): France; 2012 to 2021
Source(s): Centre national du cinéma et de l’image animée
2021
39.
Sources3Vision
ARCEP
Centre national du cinéma et de l’image animée
Conseil supérieur de l’audiovisuel
CRÉDOC
CSA Research
Délégation nationale de la lutte contre la fraude
European Commission
GfK
Glance
Hadopi
IFOP
Integral Ad Science
IVF
Kantar
Kantar Belgium
Le Point
Les Échos
Médiamétrie
NPA Conseil
Offremedia
Omdia
38
Puremédias (ozap.com)
RTL Adconnect
Statista
Statista Consumer Insights
Syndicat National de la Publicité Télévisée
TCL
Various sources (local institutes )
VAUNET
Vertigo Research
YouGov