


 education
Similar presentations:


Planning Therapy for High-Risk HER2-Positive
1.
Planning Therapy for High-Risk HER2-PositiveEarly-Stage Breast Cancer: Expert Viewpoint
Lee Schwartzberg, MD, FACP
Chief Medical Officer
OneOncology
Clinical Professor of Medicine
University of Tennessee Health Science Center
Memphis, Tennessee
Supported by an educational grant from Puma Biotechnology.
2.
About These SlidesPlease feel free to use, update, and share some or all of these slides in
your noncommercial presentations to colleagues or patients
When using our slides, please retain the source attribution:
Slide credit: clinicaloptions.com
These slides may not be published, posted online, or used in
commercial presentations without permission. Please contact
permissions@clinicaloptions.com for details
3.
FacultyLee Schwartzberg, MD, FACP
Chief Medical Officer
OneOncology
Clinical Professor of Medicine
University of Tennessee Health Science Center
Memphis, Tennessee
Lee Schwartzberg, MD, FACP, has disclosed that he has received consulting
fees from Amgen, AstraZeneca, Bayer, Beyond Spring, Bristol Myers Squibb,
Genentech, Helsinn, Lilly, Myriad Genetics, Napo Pharmaceuticals, Odonate
Therapeutics, Pfizer, and Spectrum Pharmaceuticals; has received fees for nonCME/CE services Coherus BioSciences, Merck, Puma, and Seattle Genetics; and
institutional research support from Amgen and Pfizer.
4.
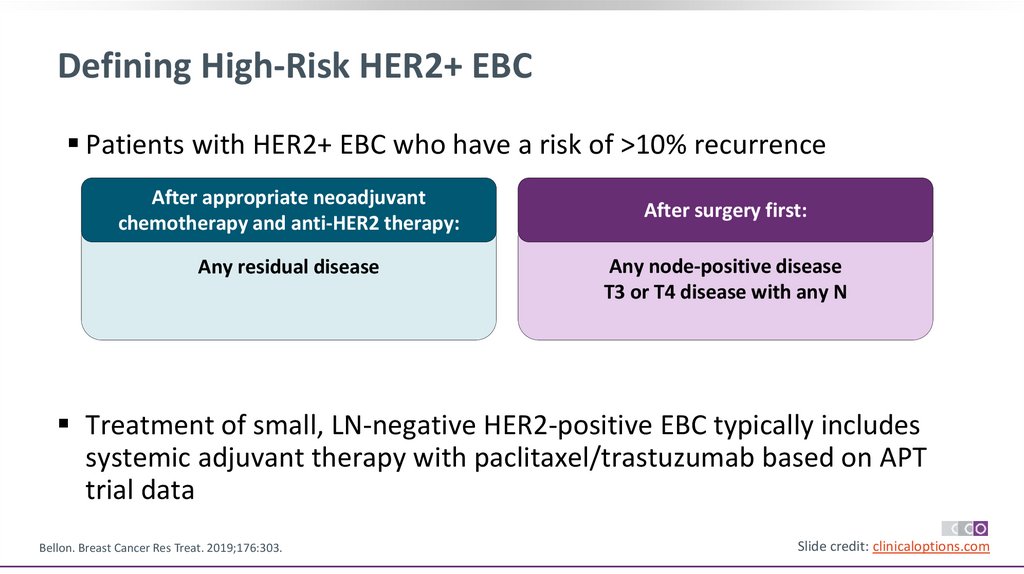
Defining High-Risk HER2+ EBCPatients with HER2+ EBC who have a risk of >10% recurrence
After appropriate neoadjuvant
chemotherapy and anti-HER2 therapy:
Any residual disease
After surgery first:
Any node-positive disease
T3 or T4 disease with any N
Treatment of small, LN-negative HER2-positive EBC typically includes
systemic adjuvant therapy with paclitaxel/trastuzumab based on APT
trial data
Bellon. Breast Cancer Res Treat. 2019;176:303.
Slide credit: clinicaloptions.com
5.
Risk Factors for Recurrence of HER2+ EBC Treated WithTrastuzumab-Based Therapy
A prospective, noninterventional study on routine trastuzumab-based therapy (patients treated
between 2006-2012 in Germany)
Multivariable Full Model
Univariable
Prognostic Factor
Hazard Ratio (95% CI) P Value Hazard Ratio (95% CI) P Value
Multivariable Reduced Model
Hazard Ratio (95% CI)
P Value
Age, yr
<65 vs ≥65
1.23 (1.00-1.50)
0.49
NA
NA
≤40 vs >40
1.02 (0.76-1.38)
.88
NA
NA
Per yr, continuous
1.01 (1.00-1.02)
.036
1.01 (0.997-1.01)
.24
Primary tumor: pT1/cis vs pT2-4
2.25 (1.83-2.76)
<.0001
1.93 (1.55-2.40)
<.0001
1.92 (1.55-2.38)
<.0001
LN: pN0 vs pN+
2.28 (1.86-2.78)
<.0001
2.11 (1.71-2.61)
<.0001
2.11 (1.71-2.61)
<.0001
Grade: 1/2 vs 3
1.40 (1.16-1.69)
.005
1.19 (0.97-1.47)
.092
--
HR status: negative vs positive
0.56 (0.47-0.68)
<.0001
0.58 (0.47-0.71)
<.0001
0.55 (0.46-0.67)
ECOG PS 0 vs 1-4
1.22 (1.01-1.47)
.040
1.11 (0.91-1.36)
.29
NA
.24
BMI <25 vs 25-29 vs >30 kg/m2
Dall. Oncologist. 2017;22:131.
--
--
<.0001
--Slide credit: clinicaloptions.com
6.
Meta-analysis for Relationship Between pCR and EFS inPatients With HER2+ EBC
Association of pCR with significantly
improved OS was seen with HER2+ BC
(HR: 0.13; 95% PI: 0.04–0.35, n = 1,654)
100
90
80
70
60
50
40
30
20
10
0
EFS
5-Yr EFS, %
(95% PI)
With pCR
86 (74−94)
Residual disease 63 (43−78)
0
1
2
3
Spring. Clin Cancer Res. 2020;26:2838
4
5
Years
OS
100
90
80
70
60
50
40
30
20
10
0
Survival (%)
Event-Free Survival (%)
Association of pCR with better EFS was
statistically significant in patients with HER2+
BC (HR 0.31; 95% PI: 0.21–0.50; n = 5,711)
6
7
8
9
5-Yr OS, %
(95% PI)
With pCR
95 (89−99)
Residual disease 76 (63−88)
0
1
2
3
4
5
Years
6
7
8
9
Slide credit: clinicaloptions.com
7.
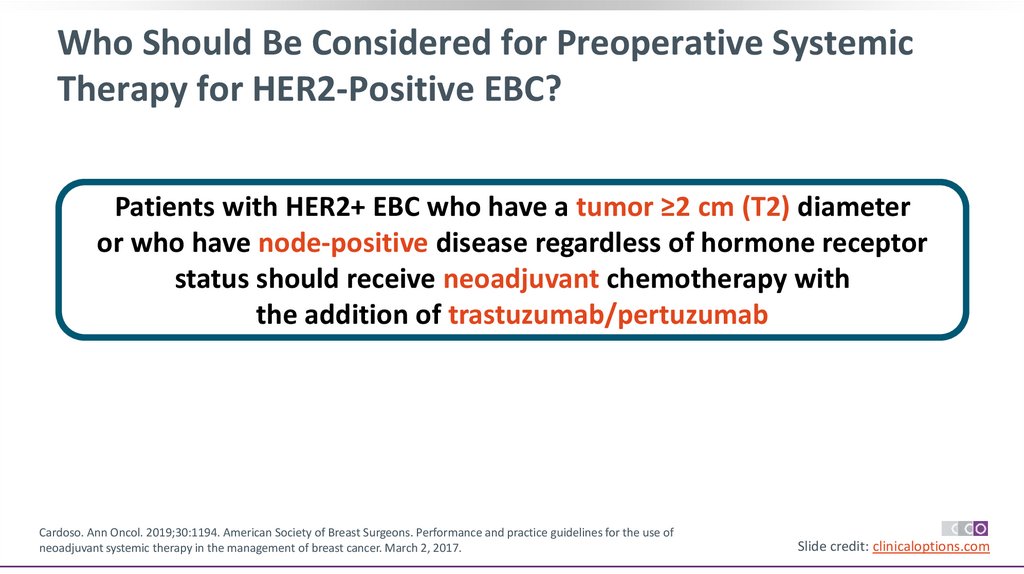
Who Should Be Considered for Preoperative SystemicTherapy for HER2-Positive EBC?
Patients with HER2+ EBC who have a tumor ≥2 cm (T2) diameter
or who have node-positive disease regardless of hormone receptor
status should receive neoadjuvant chemotherapy with
the addition of trastuzumab/pertuzumab
Cardoso. Ann Oncol. 2019;30:1194. American Society of Breast Surgeons. Performance and practice guidelines for the use of
neoadjuvant systemic therapy in the management of breast cancer. March 2, 2017.
Slide credit: clinicaloptions.com
8.
Pivotal Studies on Neoadjuvant Trastuzumab/Pertuzumabfor Patients With HER2+ EBC
Open-Label Phase II NeoSphere Study: Neoadjuvant Trastuzumab/Pertuzumab1
TH x 4 cycles
(n = 107)
Chemo-naive women with
HER2+ EBC (operable or
LA/inflammatory);
primary tumor >2 cm
(N = 417)
THP x 4 cycles
(n = 107)
HP x 4 cycles
(n = 107)
TP x 4 cycles
(n = 96)
S
U
R
G
E
R
Y
FEC Q3W x 3
Trastuzumab Q3W for 1 yr
FEC Q3W x 3
Trastuzumab Q3W for 1 yr
Primary endpoint:
pCR in breast (ITT)
Docetaxel Q3W x 4 → FEC Q3W x 3
Trastuzumab Q3W for 1 yr
FEC Q3W x 3
Trastuzumab Q3W for 1 yr
Phase II TRYPHAENA Cardiac Safety Study: Dual HER2 Targeting ± Anthracycline Tx2
Patients with operable,
LA/inflammatory BC
(N = 225)
FEC + HP x 3 cycles →
THP x 3 cycles
FEC x 3 cycles →
THP x 3 cycles
TCHP x 6 cycles
1. Gianni. Lancet Oncol. 2012;13:25. 2. Schneeweiss. Ann Oncol. 2013;24:2278.
pCR
assessed at
surgery
Adjuvant tx to
complete 1 yr
of
trastuzumab
Primary endpoint:
Cardiac safety
Slide credit: clinicaloptions.com
9.
NeoSphere: Neoadjuvant Trastuzumab/Pertuzumab + CTIncreases pCR Rates
pCR in ITT Population (Primary Endpoint)
100
pCR (%)
80
60
45.8*
40
29.0
24.0‡
16.8†
20
P values vs TH:
*P = .0141
†P = .0198
‡P = .003
0
Gianni. Lancet Oncol. 2012;13:25.
TH (n = 107)
THP (n = 107)
HP (n = 107)
TP (n = 96)
Slide credit: clinicaloptions.com
10.
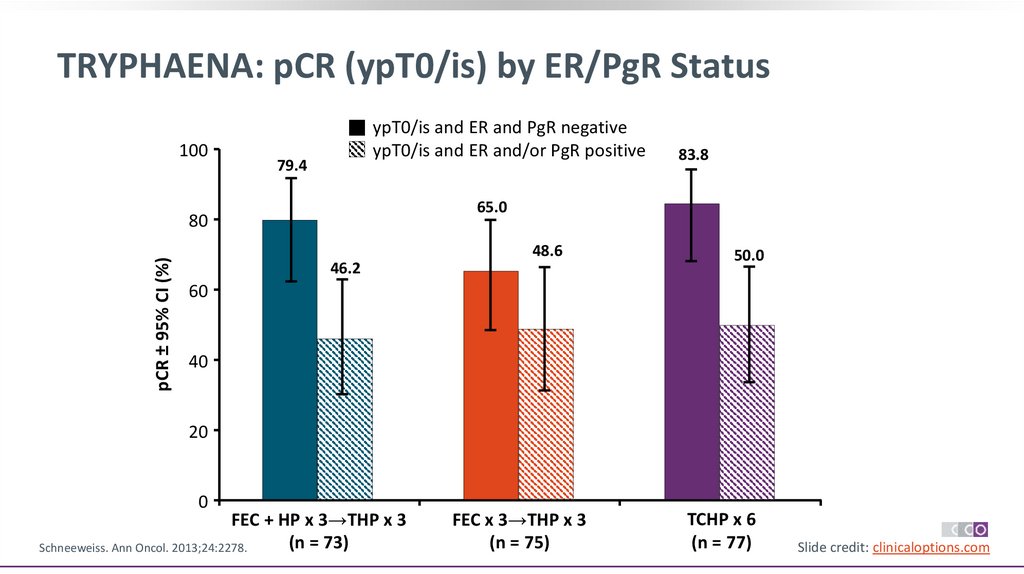
TRYPHAENA: pCR (ypT0/is) by ER/PgR Status100
ypT0/is and ER and PgR negative
ypT0/is and ER and/or PgR positive
79.4
65.0
80
pCR ± 95% CI (%)
83.8
48.6
46.2
50.0
60
40
20
0
FEC + HP x 3→THP x 3
(n = 73)
Schneeweiss. Ann Oncol. 2013;24:2278.
FEC x 3→THP x 3
(n = 75)
TCHP x 6
(n = 77)
Slide credit: clinicaloptions.com
11.
Building on Trastuzumab: Additional HER2-TargetedTherapy in the Adjuvant Setting
Neratinib
Trastuzumab/Pertuzumab
T-DM1
FDA approval July 17, 2017
FDA approval Dec 20, 2017
Use in combination with
chemotherapy as:
Neoadjuvant treatment of
patients with HER2+ EBC
(either >2 cm tumor or N+)
Adjuvant treatment of
patients with HER2+ EBC
at high risk of recurrence2
FDA approval May 3, 2019
As extended adjuvant
treatment for patients
with HER2overexpressed/amplified
EBC following adjuvant
trastuzumab-based therapy1
As adjuvant therapy for
patients with HER2+ EBC
and residual invasive
disease after neoadjuvant
taxane and trastuzumabbased treatment4
‒ High-risk patients
included those with HRor N+ breast cancer3
1. Neratinib PI. 2. Pertuzumab PI. 3. von Minckwitz G. NEJM. 2017;377:122. 4. Ado-trastuzumab emtansine PI. 5. Trastuzumab PI
Slide credit: clinicaloptions.com
12.
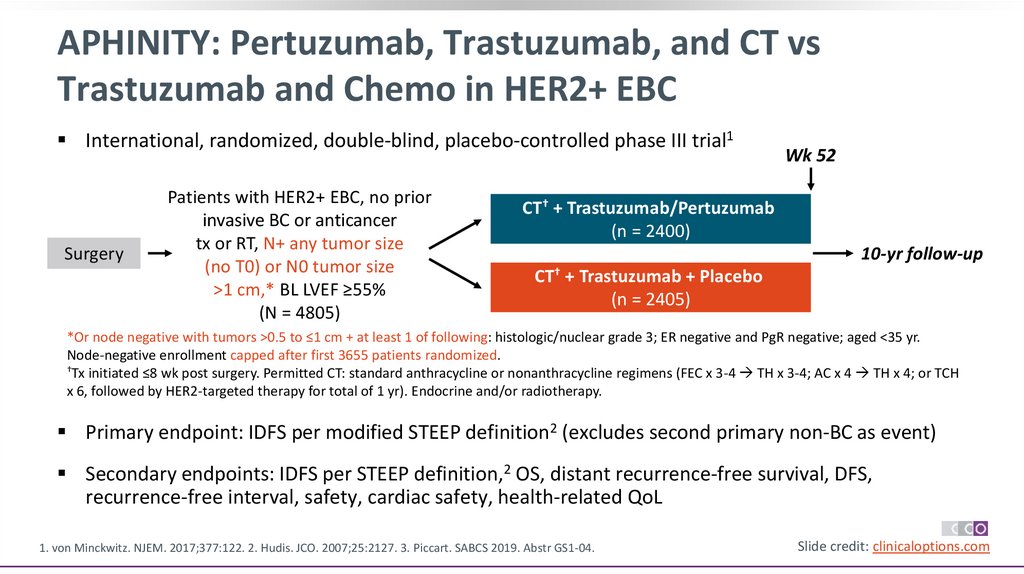
APHINITY: Pertuzumab, Trastuzumab, and CT vsTrastuzumab and Chemo in HER2+ EBC
International, randomized, double-blind, placebo-controlled phase III trial1
Surgery
Patients with HER2+ EBC, no prior
invasive BC or anticancer
tx or RT, N+ any tumor size
(no T0) or N0 tumor size
>1 cm,* BL LVEF ≥55%
(N = 4805)
Wk 52
CT† + Trastuzumab/Pertuzumab
(n = 2400)
10-yr follow-up
CT† + Trastuzumab + Placebo
(n = 2405)
*Or node negative with tumors >0.5 to ≤1 cm + at least 1 of following: histologic/nuclear grade 3; ER negative and PgR negative; aged <35 yr.
Node-negative enrollment capped after first 3655 patients randomized.
†Tx initiated ≤8 wk post surgery. Permitted CT: standard anthracycline or nonanthracycline regimens (FEC x 3-4 TH x 3-4; AC x 4 TH x 4; or TCH
x 6, followed by HER2-targeted therapy for total of 1 yr). Endocrine and/or radiotherapy. could be started at end of adjuvant CT.
Primary endpoint: IDFS per modified STEEP definition2 (excludes second primary non-BC as event)
Secondary endpoints: IDFS per STEEP definition,2 OS, distant recurrence-free survival, DFS,
recurrence-free interval, safety, cardiac safety, health-related QoL
1. von Minckwitz. NJEM. 2017;377:122. 2. Hudis. JCO. 2007;25:2127. 3. Piccart. SABCS 2019. Abstr GS1-04.
Slide credit: clinicaloptions.com
13.
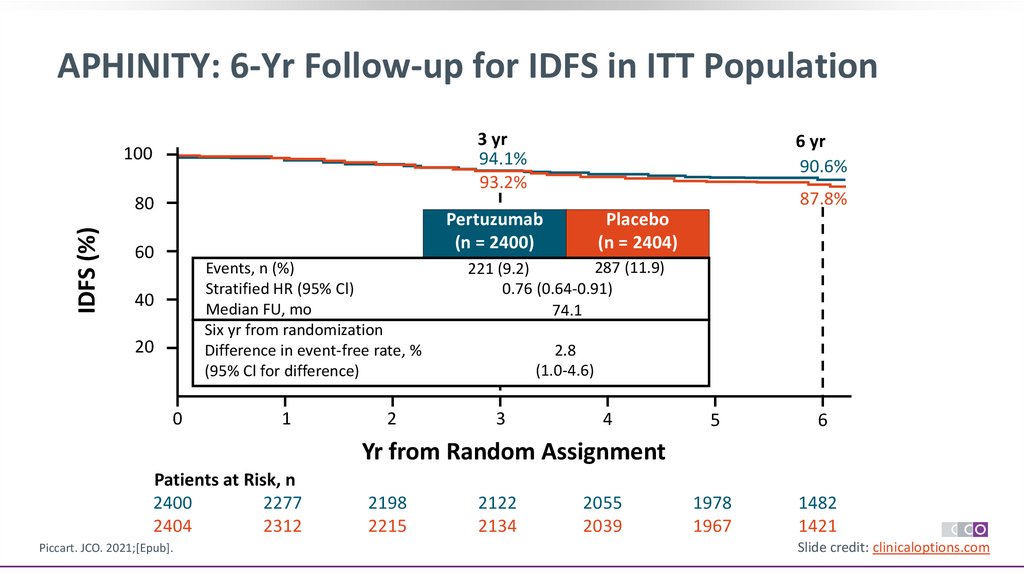
APHINITY: 6-Yr Follow-up for IDFS in ITT Population3 yr
94.1%
93.2%
100
IDFS (%)
80
6 yr
90.6%
87.8%
Pertuzumab
(n = 2400)
60
Events, n (%)
Stratified HR (95% Cl)
Median FU, mo
Six yr from randomization
Difference in event-free rate, %
(95% Cl for difference)
40
20
0
1
2
Placebo
(n = 2404)
287 (11.9)
221 (9.2)
0.76 (0.64-0.91)
74.1
2.8
(1.0-4.6)
3
4
5
6
1978
1967
1482
1421
Yr from Random Assignment
Patients at Risk, n
2400
2277
2404
2312
Piccart. JCO. 2021;[Epub].
2198
2215
2122
2134
2055
2039
Slide credit: clinicaloptions.com
14.
APHINITY: 6-Yr Follow-up for OS in ITT Population6 yr
94.8%
93.9%
100
OS (%)
80
Pertuzumab
(n = 2400)
60
Events, n (%)
Stratified HR (95% Cl)
P value
Median FU, mo
6 yr from randomization
Difference in event-free rate, %
(95% Cl for difference)
40
20
0
1
2
Placebo
(n = 2404)
125 (5.2)
147 (6.1)
0.85 (0.67-1.07)
.170
74.1
0.9
(-0.5 to 2.2)
3
4
5
6
2090
2107
1544
1522
Yr From Random Assignment
Patients at Risk, n
2400
2304
2404
2339
Piccart. JCO. 2021;[Epub].
2261
2292
2216
2241
2161
2165
Slide credit: clinicaloptions.com
15.
APHINITY: IDFS by Nodal StatusNode-Positive Cohort
90.2%
IDFS (%)
80
Pertuzumab
(n = 1503)
Placebo
(n = 1502)
Events, n (%)
173 (11.5)
239 (15.9)
Stratified HR
0.72 (95% CI: 0.59-0.87)
60
40
Yr 6
87.9%
100
83.4%
80
IDFS (%)
Yr 3
92.0%
100
6-yr duration
20
0
Node-Negative Cohort
Difference in event-free rate, %
0
Patients at
Risk, n
1503
1502
1
2
3
4
5
Yr From Randomization
1420
1439
Piccart. JCO. 2021;[Epub].
1357
1359
1301
1288
1257
1223
1205
1176
6
Yr 6
95.0%
98.4%
94.9%
Pertuzumab
(n = 897)
Placebo
(n = 902)
Events, n (%)
48 (5.4)
48 (5.3)
Stratified HR
1.02 (95% CI: 0.69-1.53)
60
40
6-yr duration
20
4.5 (95% CI: 1.9-7.1)
Yr 3
97.5%
0
Difference in event-free rate, %
0
Patients at
Risk, n
897
814
902
741
1
2
0.1 (95% CI: -2.0-2.2)
3
4
5
6
773
791
668
680
Yr From Randomization
857
873
841
856
821
846
798
816
Slide credit: clinicaloptions.com
16.
APHINITY: IDFS by Hormone Receptor StatusHormone Receptor–Negative Cohort
100
91.2%
IDFS (%)
80
60
40
Pertuzumab
(n = 864)
Placebo
(n = 858)
Events, n (%)
90 (10.4)
106 (12.4)
Stratified HR
0.83 (95% CI: 0.63-1.10)
100
87.0%
80
6-yr duration
20
0
Patients at
Risk, n
864
858
1
2
3
4
Piccart. JCO. 2021;[Epub].
796
771
759
743
732
716
Yr 6
91.2%
94.4%
60
40
Pertuzumab
(n = 1536)
Placebo
(n = 1546)
Events, n (%)
131 (8.5)
181 (11.7)
Stratified HR
0.73 (95% CI: 0.59-0.92)
Difference in event-free rate, %
0
88.2%
6-yr duration
2.5 (95% CI: -0.7-5.6)
5
6
708
693
Patients at
Risk, n
1536
520
1546
502
Yr From Randomization
821
811
Yr 3
94.8%
20
Difference in event-free rate, %
0
Yr 6
89.5%
IDFS (%)
Yr 3
92.8%
Hormone Receptor–Positive Cohort
0
1
2
3.0 (95% CI: 0.8-5.2)
3
4
5
6
1270
1274
962
919
Yr From Randomization
1456
1501
1402
1444
1363
1391
1323
1323
Slide credit: clinicaloptions.com
17.
APHINITY: Safety 6-Yr Follow-upEvent, n (%)
CT + Trastuzumab/Pertuzumab (n
= 2364)
CT + Trastuzumab/Placebo
(n = 2405)
Fatal AE
22 (0.9)
30 (1.2)
Primary cardiac event
18 (0.8)
8 (0.3)
Secondary cardiac event
65 (2.7)
68 (2.8)
Identified automatically from LVEF
assessments
50 (2.1)
47 (2.0)
Identified by cardiac advisory board
15 (0.6)
21 (0.9)
Piccart. JCO. 2021;[Epub].
Slide credit: clinicaloptions.com
18.
Neratinib: Mechanism of ActionPan-HER TKI
HER2
HER1 (EGFR)
HER4
HER3
Pertuzumab
Irreversible inhibition
Different MoA than
trastuzumab and
pertuzumab
TK
P
TK P
TK
Lapatinib
Baselga. Crit Rev Oncol Hematol. 2017;119:113.
Extracellular
T-DM1
Trastuzumab
Intracellular
Neratinib
PI3K
MEK
AKT
ERK
Slide credit: clinicaloptions.com
19.
ExteNET 5-Yr Update: Neratinib vs Placebo AfterAdjuvant Trastuzumab in HER2+ EBC
Stratified by hormone receptor status (ER+ and/or PgR+ vs ER- and
PgR-), nodal status (0 vs 1-3 vs ≥4), adjuvant trastuzumab regimen
(sequential vs concurrent with CT)
Patients with HER2+ EBC (stage I-III);
adjuvant trastuzumab completed ≤2 yr before
randomization*; N+/- disease or residual
disease after neoadjuvant therapy known ER
and PgR status
(N = 2840)
1 yr
Neratinib 240 mg/day PO
(n = 1420)
Placebo
(n = 1420)
*Amendment in Feb 2010
restricted enrollment to
patients with N+ disease who
completed trastuzumab ≤1 yr
before randomization.
Endocrine therapy given according to
local practice
Primary endpoint: IDFS at 2 yr
Primary analysis of 2-yr IDFS rate: neratinib, 93.9%; placebo, 91.6%
(HR: 0.67; 95% CI: 0.50-0.91; P = .0091)
Chan. Lancet Oncol. 2016;17:367. Martin. Lancet Oncol. 2017;18:1688.
Slide credit: clinicaloptions.com
20.
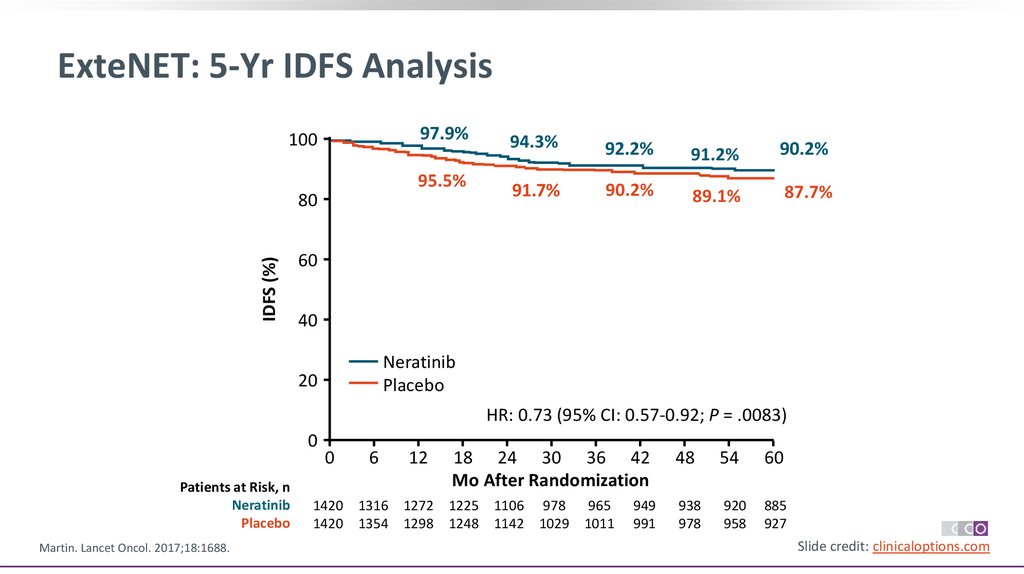
ExteNET: 5-Yr IDFS Analysis97.9%
100
95.5%
IDFS (%)
80
94.3%
92.2%
91.2%
90.2%
91.7%
90.2%
89.1%
87.7%
60
40
Neratinib
Placebo
20
HR: 0.73 (95% CI: 0.57-0.92; P = .0083)
0
Patients at Risk, n
Neratinib
Placebo
Martin. Lancet Oncol. 2017;18:1688.
0
6
12
18 24 30 36 42
Mo After Randomization
1420 1316 1272 1225 1106 978 965
1420 1354 1298 1248 1142 1029 1011
949
991
48
54
60
938
978
920
958
885
927
Slide credit: clinicaloptions.com
21.
ExteNET: 5-Yr IDFS Analysis by Hormone Receptor StatusHormone Receptor Positive
98.1%
100
96.1%
80
93.6% 92.6%
91.7% 89.8% 88.5%
91.2%
86.8%
60
40
Neratinib
Placebo
20
97.5%
100
40
Neratinib 816
Placebo 815
731
750
705
719
Martin. Lancet Oncol. 2017;18:1688.
642
647
571
581
565
567
558
556
91.8% 90.4% 89.3%
HR: 0.95 (95% CI: 0.66-1.35)
6 12 18 24 30 36 42 48 54 60
Mo After Randomization
757
779
88.9%
88.8%
Neratinib
Placebo
20
0
Patients at Risk, n
90.8% 89.9%
60
HR: 0.60 (95% CI: 0.43-0.83)
0
92.8%
94.7%
80
IDFS (%)
IDFS (%)
95.4%
Hormone Receptor Negative
554
551
544
542
532
525
0
0
Patients at Risk, n
Neratinib 604
Placebo 605
6 12 18 24 30 36 42 48 54 60
Mo After Randomization
559
575
541
548
520
529
464
495
407
448
400
444
391
435
384
427
376
416
362
402
Slide credit: clinicaloptions.com
22.
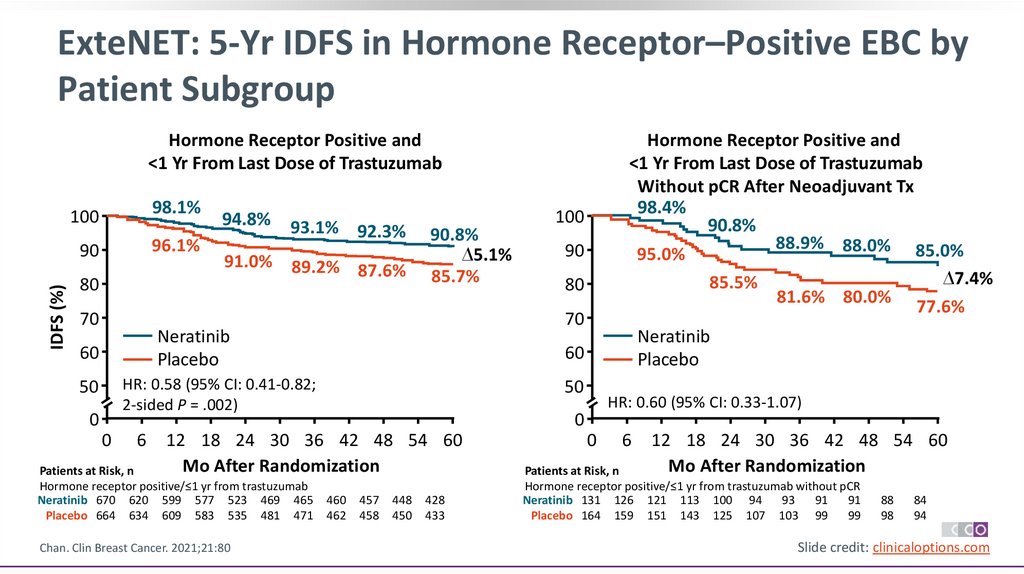
ExteNET: 5-Yr IDFS in Hormone Receptor–Positive EBC byPatient Subgroup
IDFS (%)
Hormone Receptor Positive and
<1 Yr From Last Dose of Trastuzumab
100
98.1%
90
96.1%
80
70
94.8%
93.1% 92.3%
91.0% 89.2% 87.6%
90.8%
∆5.1%
85.7%
0
0
6
Chan. Clin Breast Cancer. 2021;21:80
80
Neratinib
Placebo
50
HR: 0.60 (95% CI: 0.33-1.07)
0
12 18 24 30 36 42 48 54 60
Mo After Randomization
Patients at Risk, n
Hormone receptor positive/≤1 yr from trastuzumab
Neratinib 670 620 599 577 523 469 465
Placebo 664 634 609 583 535 481 471
90
60
HR: 0.58 (95% CI: 0.41-0.82;
2-sided P = .002)
50
100
70
Neratinib
Placebo
60
Hormone Receptor Positive and
<1 Yr From Last Dose of Trastuzumab
Without pCR After Neoadjuvant Tx
98.4%
90.8%
88.9% 88.0% 85.0%
95.0%
∆7.4%
85.5%
81.6% 80.0%
77.6%
460
462
457
458
448
450
428
433
0
6
12 18 24 30 36 42 48 54 60
Mo After Randomization
Patients at Risk, n
Hormone receptor positive/≤1 yr from trastuzumab without pCR
Neratinib 131 126 121 113 100 94
93
91
91
Placebo 164 159 151 143 125 107 103 99
99
88
98
84
94
Slide credit: clinicaloptions.com
23.
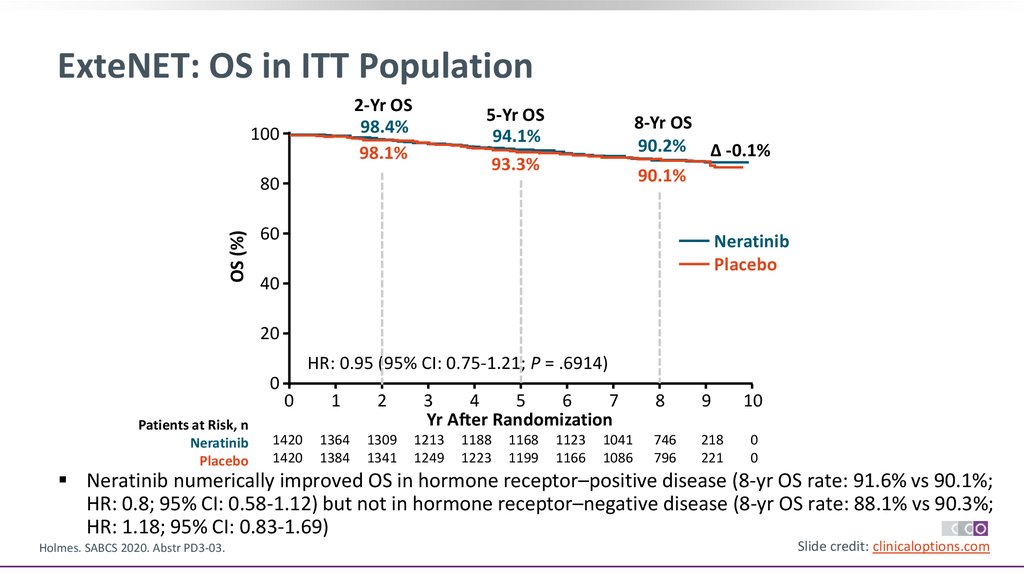
ExteNET: OS in ITT Population2-Yr OS
98.4%
98.1%
100
5-Yr OS
94.1%
93.3%
8-Yr OS
90.2% Δ -0.1%
90.1%
OS (%)
80
60
Neratinib
Placebo
40
20
HR: 0.95 (95% CI: 0.75-1.21; P = .6914)
0
Patients at Risk, n
Neratinib
Placebo
0
1
2
3
4
5
6
7
Yr After Randomization
8
9
10
1420
1420
1364
1384
1309
1341
1213
1249
746
796
218
221
0
0
1188
1223
1168
1199
1123
1166
1041
1086
Neratinib numerically improved OS in hormone receptor–positive disease (8-yr OS rate: 91.6% vs 90.1%;
HR: 0.8; 95% CI: 0.58-1.12) but not in hormone receptor–negative disease (8-yr OS rate: 88.1% vs 90.3%;
HR: 1.18; 95% CI: 0.83-1.69)
Holmes. SABCS 2020. Abstr PD3-03.
Slide credit: clinicaloptions.com
24.
ExteNET: OS in Hormone Receptor–Positive EBC byPatient Subgroup
Hormone Receptor Positive and
<1 Yr From Last Dose of Trastuzumab
OS (%)
60
50
40
30
20
10
0
95.0%
98.5%
91.5%
92.5%
1
Patients at Risk, n
Neratinib 670
640
Placebo 664
645
2
3
4
5
2.1%
89.4%
Neratinib
Placebo
HR: 0.79 (95% CI: 0.55-1.13;
2-sided P = .203)
0
6
7
8
578
589
Chan. Clin Breast Cancer. 2021;21:80
567
574
556
560
534
537
490
497
315
335
98.4%
95.1%
10
78
78
Patients at Risk, n
0 Neratinib 131
126
0 Placebo 164
161
91.3%
97.5%
9.1%
85.6%
60
50
40
30
20 HR: 0.47 (95% CI: 0.23-0.92;
10 2-sided P = .031)
0
0
1
2
3
4
5
9
Yr After Randomization
620
630
100
90
80
70
OS (%)
99.1%
100
90
80
70
Hormone Receptor Positive and
<1 Yr From Last Dose of Trastuzumab
Without pCR After Neoadjuvant Tx
82.2%
Neratinib
Placebo
6
7
8
9
10
106
123
100
115
60
65
14
12
0
0
Yr After Randomization
121
156
116
143
113
135
110
129
Slide credit: clinicaloptions.com
25.
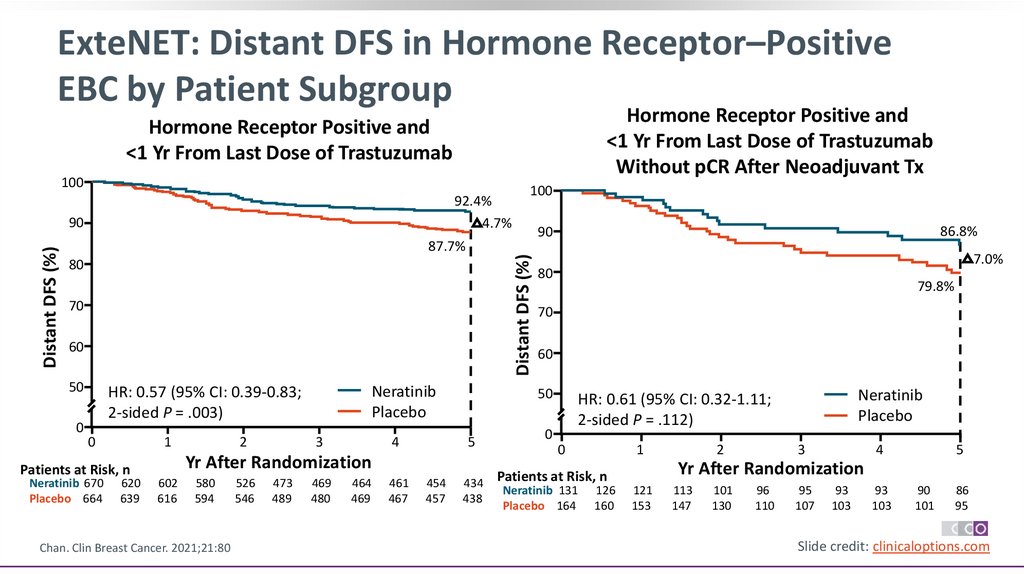
ExteNET: Distant DFS in Hormone Receptor–PositiveEBC by Patient Subgroup
Hormone Receptor Positive and
<1 Yr From Last Dose of Trastuzumab
Without pCR After Neoadjuvant Tx
Hormone Receptor Positive and
<1 Yr From Last Dose of Trastuzumab
100
92.4%
4.7%
87.7%
80
70
60
50
0
Neratinib
Placebo
HR: 0.57 (95% CI: 0.39-0.83;
2-sided P = .003)
0
1
Patients at Risk, n
Neratinib 670
Placebo 664
620
639
2
3
4
580
594
Chan. Clin Breast Cancer. 2021;21:80
526
546
473
489
469
480
464
469
461
467
5
454
457
7.0%
80
79.8%
70
60
50
Yr After Randomization
602
616
86.8%
90
Distant DFS (%)
Distant DFS (%)
90
100
434
438
Neratinib
Placebo
HR: 0.61 (95% CI: 0.32-1.11;
2-sided P = .112)
0
0
1
126
160
3
4
5
Yr After Randomization
Patients at Risk, n
Neratinib 131
Placebo 164
2
121
153
113
147
101
130
96
110
95
107
93
103
93
103
90
101
86
95
Slide credit: clinicaloptions.com
26.
ExteNET: Cumulative Incidence of CNS Recurrences asFirst Site of Metastases at 5 Yr
CNS Events (n)
Incidence of CNS Recurrences at 5 Yr (95% CI)
Population or
Subgroup
Neratinib
Placebo
Neratinib
Placebo
HR+/≤1 yr
4 (670)
12 (664)
0.7 (0.2-1.7)
2.1 (1.1-3.5)
Nodal status
Positive
Negative
4 (540)
0 (130)
10 (539)
2 (125)
0.8 (0.3-2.0)
0 (NE)
Prior trastuzumab
regimen
Concurrent
Sequential
2 (411)
2 (259)
8 (415)
4 (249)
0.6 (0.1-1.9)
0.9 (0.2-3.0)
2.3 (1.1-4.3)
1.8 (0.6-4.3)
Adjuvant or
neoadjuvant therapy
Adjuvant
Neoadjuvant
3 (508)
1 (162)
6 (472)
6 (192)
0.7 (0.2-2.0)
0.7 (0.1-3.3)
1.5 (0.6-3.0)
3.7 (1.5-7.4)
pCR status*
No
Yes
1 (131)
0 (17)
5 (164)
1 (21)
0.8 (0.1-4.0)
0 (NE)
3.6 (1.3-7.8)
5.0 (0.3-21.2)
2.2 (1.1-3.8)
1.9 (0.4-6.0)
*Among the 354 patients that received neoadjuvant therapy, 295 achieved a pCR, and 21 had no outcome reported.
Chan. Clin Breast Cancer. 2021;21:80
Slide credit: clinicaloptions.com
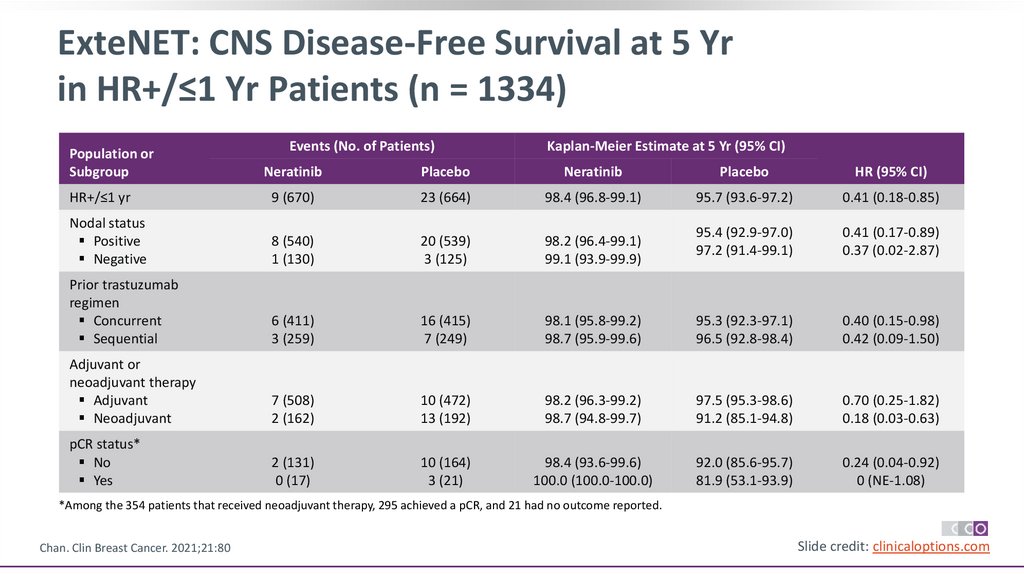
27.
ExteNET: CNS Disease-Free Survival at 5 Yrin HR+/≤1 Yr Patients (n = 1334)
Events (No. of Patients)
Kaplan-Meier Estimate at 5 Yr (95% CI)
Population or
Subgroup
Neratinib
Placebo
Neratinib
Placebo
HR (95% CI)
HR+/≤1 yr
9 (670)
23 (664)
98.4 (96.8-99.1)
95.7 (93.6-97.2)
0.41 (0.18-0.85)
Nodal status
Positive
Negative
8 (540)
1 (130)
20 (539)
3 (125)
98.2 (96.4-99.1)
99.1 (93.9-99.9)
95.4 (92.9-97.0)
97.2 (91.4-99.1)
0.41 (0.17-0.89)
0.37 (0.02-2.87)
Prior trastuzumab
regimen
Concurrent
Sequential
6 (411)
3 (259)
16 (415)
7 (249)
98.1 (95.8-99.2)
98.7 (95.9-99.6)
95.3 (92.3-97.1)
96.5 (92.8-98.4)
0.40 (0.15-0.98)
0.42 (0.09-1.50)
Adjuvant or
neoadjuvant therapy
Adjuvant
Neoadjuvant
7 (508)
2 (162)
10 (472)
13 (192)
98.2 (96.3-99.2)
98.7 (94.8-99.7)
97.5 (95.3-98.6)
91.2 (85.1-94.8)
0.70 (0.25-1.82)
0.18 (0.03-0.63)
pCR status*
No
Yes
2 (131)
0 (17)
10 (164)
3 (21)
98.4 (93.6-99.6)
100.0 (100.0-100.0)
92.0 (85.6-95.7)
81.9 (53.1-93.9)
0.24 (0.04-0.92)
0 (NE-1.08)
*Among the 354 patients that received neoadjuvant therapy, 295 achieved a pCR, and 21 had no outcome reported.
Chan. Clin Breast Cancer. 2021;21:80
Slide credit: clinicaloptions.com
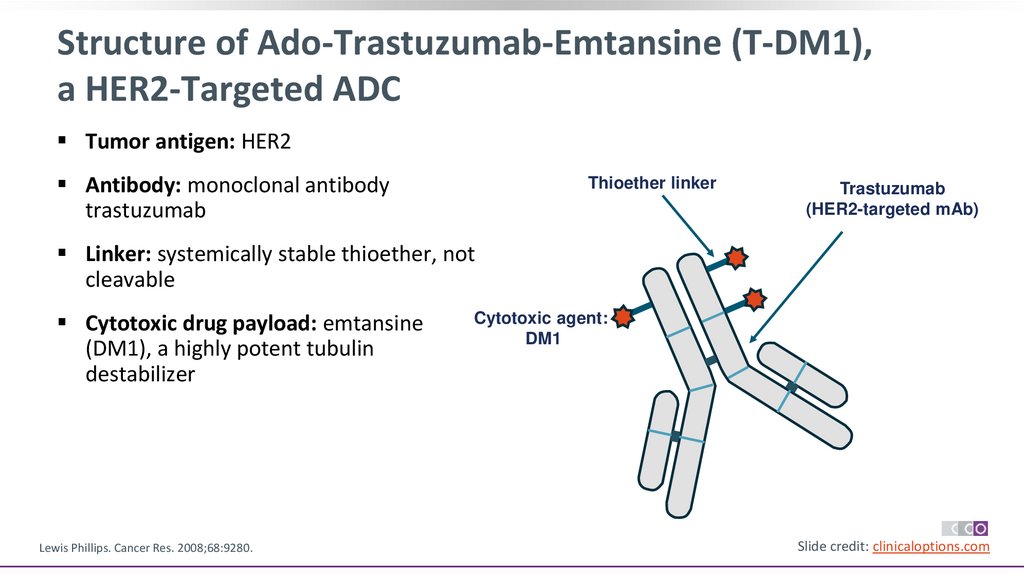
28.
Structure of Ado-Trastuzumab-Emtansine (T-DM1),a HER2-Targeted ADC
Tumor antigen: HER2
Antibody: monoclonal antibody
trastuzumab
Thioether linker
Trastuzumab
(HER2-targeted mAb)
Linker: systemically stable thioether, not
cleavable
Cytotoxic drug payload: emtansine
(DM1), a highly potent tubulin
destabilizer
Lewis Phillips. Cancer Res. 2008;68:9280.
Cytotoxic agent:
DM1
Slide credit: clinicaloptions.com
29.
KATHERINE: Trastuzumab Emtansine vs Trastuzumabas Adjuvant Therapy for HER2+ EBC
International, randomized, open-label phase III study
Stratified by clinical stage, HR status, single vs dual neoadjuvant HER2-targeted therapy,
pathologic nodal status after neoadjuvant therapy
Patients with HER2+ EBC (cT1-4/N0-3/M0) who had
residual invasive disease in breast or axillary nodes
after neoadjuvant chemotherapy plus HER2-targeted
therapy* at surgery
(N = 1486)
T-DM1† 3.6 mg/kg IV Q3W x 14 cycles
(n = 743)
Trastuzumab 6 mg/kg IV Q3W x 14 cycles
(n = 743)
Randomization occurred within 12 wk of surgery; radiotherapy and/or endocrine therapy given per local standards. *Minimum of 9 wk of taxane
and trastuzumab. †Patients who d/c T-DM1 for toxicity allowed to switch to trastuzumab to complete 14 cycles.
Primary endpoint: IDFS
Secondary endpoints: distant recurrence-free survival, OS, safety
Geyer. SABCS 2018. Abstr GS1-10. von Minckwitz. NEJM. 2019;380:617.
Slide credit: clinicaloptions.com
30.
KATHERINE: Stratification FactorsStratification Factor, n (%)
T-DM1 (n = 743)
Trastuzumab (n = 743)
Clinical stage at presentation
Operable (cT1-3N0–1M0)
Inoperable (cT4NxM0 or cTxN2–3M0)
558 (75.1)
185 (24.9)
553 (74.4)
190 (25.6)
Hormone receptor status
ER and/or PgR positive
ER negative and PgR negative/unknown
534 (71.9)
209 (28.1)
540 (72.7)
203 (27.3)
Preoperative HER2-targeted therapy
Trastuzumab alone
Trastuzumab + other HER2-targeted agents*
– Trastuzumab + pertuzumab†
600 (80.8)
143 (19.2)
133 (17.9)
596 (80.2)
147 (19.8)
139 (18.7)
Pathologic nodal status after preoperative therapy
Node positive
Node negative/not done
343 (46.2)
400 (53.8)
346 (46.6)
397 (53.4)
*Includes afatinib, dacomitinib, lapatinib, neratinib, pertuzumab. †Not a stratification factor; for informational purposes only.
Geyer. SABCS 2018. Abstr GS1-10. von Minckwitz. NEJM. 2019;380:617.
Slide credit: clinicaloptions.com
31.
KATHERINE: IDFS100
IDFS (%)
80
60
Events, n (%)
3-yr IDFS, %
40
T-DM1 Trastuzumab
(n = 743)
(n = 743)
91 (12.2) 165 (22.2)
88.3
77.0
20
HR: 0.50 (95% CI: 0.39-0.64; P <.001)
0
0
6
12
18
24
30
36
42
48
Mo Since Randomization
Patients at Risk, n
743 707 681 658 633 561 409 255 142
T-DM1
Trastuzumab 743 676 635 594 555 501 342 220 119
von Minckwitz. NEJM. 2019;380:617.
54
60
First IDFS
Event, %
T-DM1
T
Any
12.2
22.2
Distant
recurrence
10.5*
15.9†
Locoregional
recurrence
1.1
4.6
Contralateral
breast cancer
0.4
1.3
Death without
prior event
0.3
0.4
CNS events: *5.9% vs †4.3%.
44
38
4
4
Slide credit: clinicaloptions.com
32.
KATHERINE: IDFS by SubgroupSubgroup
All patients
Age
<40 yr
40-64 yr
≥65 yr
Clinical stage at presentation
Inoperable breast cancer
Operable breast cancer
Hormone receptor status
ER neg and PgR negative or unknown
ER and/or PgR positive
Preoperative HER2-directed therapy
Trastuzumab alone
Trastuzumab + other HER2-directed agents
Pathologic nodal status after preoperative therapy
Node positive
Node negative/not done
Primary tumor stage at definitive surgery
ypT0, ypT1a, ypT1b, ypT1mic, ypTis
ypT1, ypT1c
ypT2
ypT3
ypT4, ypTX
Regional lymph node stage at definitive surgery
ypN0
ypN1
ypN2
ypN3
ypNX
Events/Patients, n/N
T-DM1 Trastuzumab
91/743
165/743
HR (95% CI)
20/143
64/542
7/58
37/153
113/522
15/68
0.50 (0.29-0.86)
0.49 (0.36-0.67)
0.55 (0.22-1.34)
86.5
88.8
87.4
74.9
77.1
81.1
42/185
49/558
70/190
95/553
0.54 (0.37-0.80)
0.47 (0.33-0.66)
76.0
92.3
60.2
82.8
38/209
53/534
61/203
104/540
0.50 (0.33-0.74)
0.48 (0.35-0.67)
82.1
90.7
66.6
80.7
78/600
13/143
141/596
24/147
0.49 (0.37-0.65)
0.54 (0.27-1.06)
87.7
90.9
75.9
81.8
62/343
29/400
103/346
62/397
0.52 (0.38-0.71)
0.44 (0.28-0.68)
83.0
92.8
67.7
84.6
40/331
14/175
25/174
9/51
3/12
52/306
42/184
44/185
21/57
6/11
0.66 (0.44-1.00)
0.34 (0.19-0.62)
0.50 (0.31-0.82)
0.40 (0.18-0.88)
0.29 (0.07-1.17)
88.3
91.9
88.3
79.8
70.0
83.6
75.9
74.3
61.1
30.0
28/344
29/220
16/86
17/37
1/56
56/335
50/213
38/103
15/30
6/62
0.46 (0.30-0.73)
0.49 (0.31-0.78)
0.43 (0.24-0.77)
0.71 (0.35-1.42)
0.17 (0.02-1.38)
91.9
88.9
81.1
52.0
98.1
83.9
75.8
58.2
40.6
88.7
0.20
von Minckwitz. NEJM. 2019;380:617.
0.50 (0.39-0.64)
3-Yr IDFS Rate, %
T-DM1 Trastuzumab
88.3
77.0
0.50
1.00
2.00
5.00
Trastuzumab Better
T-DM1 Better
Slide credit: clinicaloptions.com
33.
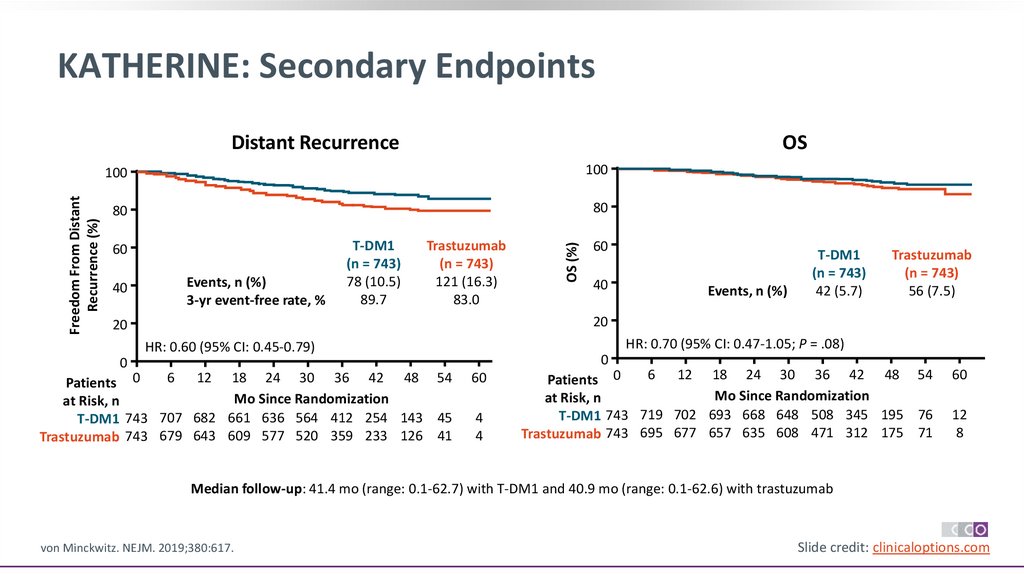
KATHERINE: Secondary EndpointsOS
100
100
80
80
60
40
Events, n (%)
3-yr event-free rate, %
T-DM1
(n = 743)
78 (10.5)
89.7
Trastuzumab
(n = 743)
121 (16.3)
83.0
OS (%)
Freedom From Distant
Recurrence (%)
Distant Recurrence
60
40
Events, n (%)
T-DM1
(n = 743)
42 (5.7)
Trastuzumab
(n = 743)
56 (7.5)
20
20
HR: 0.70 (95% CI: 0.47-1.05; P = .08)
HR: 0.60 (95% CI: 0.45-0.79)
0
6 12 18 24 30 36 42 48 54
Patients 0
Mo Since Randomization
at Risk, n
T-DM1 743 707 682 661 636 564 412 254 143 45
Trastuzumab 743 679 643 609 577 520 359 233 126 41
0
60
4
4
6 12 18 24 30 36 42 48 54
Patients 0
Mo Since Randomization
at Risk, n
T-DM1 743 719 702 693 668 648 508 345 195 76
Trastuzumab 743 695 677 657 635 608 471 312 175 71
60
12
8
Median follow-up: 41.4 mo (range: 0.1-62.7) with T-DM1 and 40.9 mo (range: 0.1-62.6) with trastuzumab
von Minckwitz. NEJM. 2019;380:617.
Slide credit: clinicaloptions.com
34.
KATHERINE: All-Grade AEs Occurring in ≥15% of Patientsin Either Arm
60
T-DM1 (n = 740)
Grade 1
Grade 2
Grade ≥3
Patients (%)
50
40
42
15
34
8
29
7
28
6
20
26
6
5
7
17
9
33
13
22
23
3
10
4
13
14
0
28
33
26
Trastuzumab (n = 720)
Grade 1
Grade 2
Grade ≥3
6
2
2
5
25
21
5
19
28
10
11
23
22
4
19
2
17
16
19
6
5
4
3
12
15
3
5
18
13
17
4
7
14
5
7
11
2
8
11
9
Discontinuation due to AEs: 18.0% with T-DM1 vs 2.1% with trastuzumab
Geyer. SABCS 2018. Abstr GS1-10. von Minckwitz. NEJM. 2019;380:617.
Slide credit: clinicaloptions.com
35.
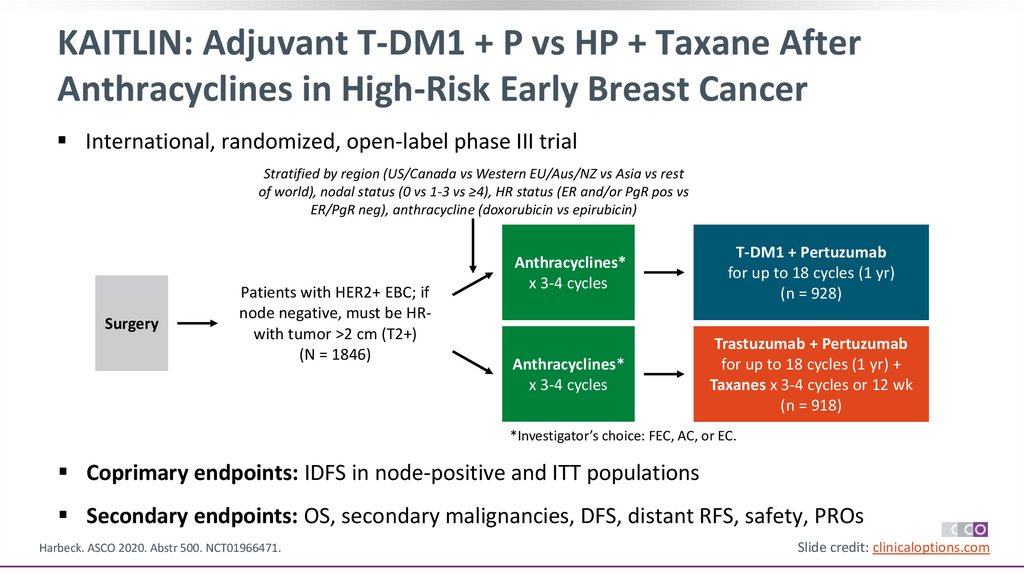
KAITLIN: Adjuvant T-DM1 + P vs HP + Taxane AfterAnthracyclines in High-Risk Early Breast Cancer
International, randomized, open-label phase III trial
Stratified by region (US/Canada vs Western EU/Aus/NZ vs Asia vs rest
of world), nodal status (0 vs 1-3 vs ≥4), HR status (ER and/or PgR pos vs
ER/PgR neg), anthracycline (doxorubicin vs epirubicin)
Surgery
Patients with HER2+ EBC; if
node negative, must be HRwith tumor >2 cm (T2+)
(N = 1846)
Anthracyclines*
x 3-4 cycles
T-DM1 + Pertuzumab
for up to 18 cycles (1 yr)
(n = 928)
Anthracyclines*
x 3-4 cycles
Trastuzumab + Pertuzumab
for up to 18 cycles (1 yr) +
Taxanes x 3-4 cycles or 12 wk
(n = 918)
*Investigator’s choice: FEC, AC, or EC.
Coprimary endpoints: IDFS in node-positive and ITT populations
Secondary endpoints: OS, secondary malignancies, DFS, distant RFS, safety, PROs
Harbeck. ASCO 2020. Abstr 500. NCT01966471.
Slide credit: clinicaloptions.com
36.
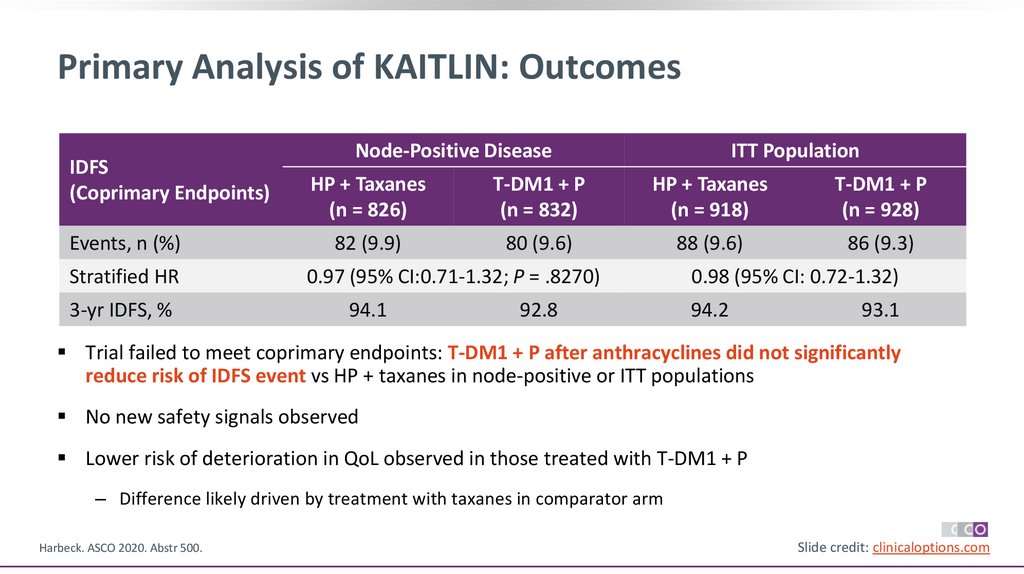
Primary Analysis of KAITLIN: OutcomesIDFS
(Coprimary Endpoints)
Events, n (%)
Stratified HR
3-yr IDFS, %
Node-Positive Disease
ITT Population
HP + Taxanes
(n = 826)
T-DM1 + P
(n = 832)
HP + Taxanes
(n = 918)
T-DM1 + P
(n = 928)
82 (9.9)
80 (9.6)
88 (9.6)
86 (9.3)
0.97 (95% CI:0.71-1.32; P = .8270)
94.1
92.8
0.98 (95% CI: 0.72-1.32)
94.2
93.1
Trial failed to meet coprimary endpoints: T-DM1 + P after anthracyclines did not significantly
reduce risk of IDFS event vs HP + taxanes in node-positive or ITT populations
No new safety signals observed
Lower risk of deterioration in QoL observed in those treated with T-DM1 + P
‒ Difference likely driven by treatment with taxanes in comparator arm
Harbeck. ASCO 2020. Abstr 500.
Slide credit: clinicaloptions.com
37.
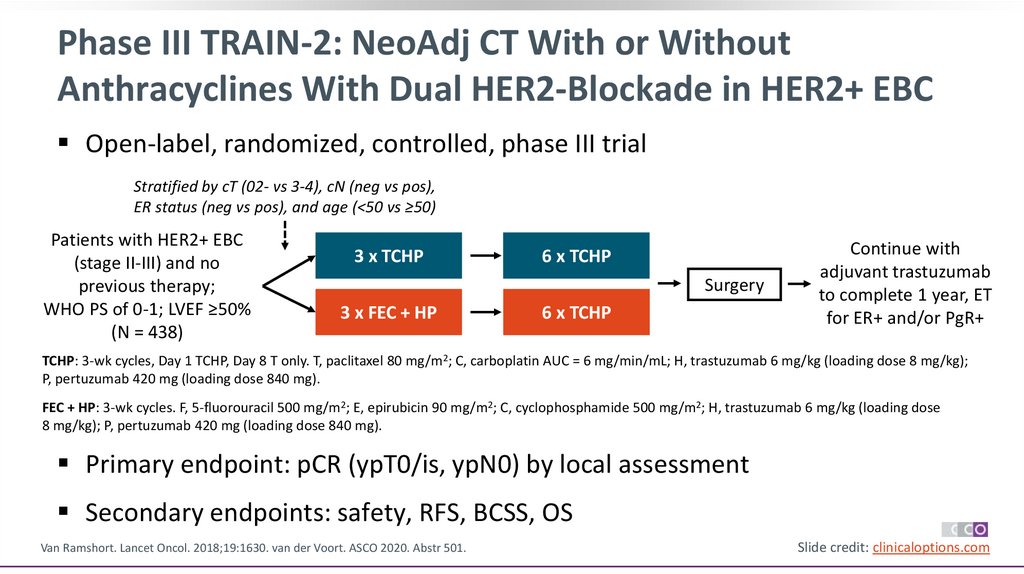
Phase III TRAIN-2: NeoAdj CT With or WithoutAnthracyclines With Dual HER2-Blockade in HER2+ EBC
Open-label, randomized, controlled, phase III trial
Stratified by cT (02- vs 3-4), cN (neg vs pos),
ER status (neg vs pos), and age (<50 vs ≥50)
Patients with HER2+ EBC
(stage II-III) and no
previous therapy;
WHO PS of 0-1; LVEF ≥50%
(N = 438)
3 x TCHP
6 x TCHP
Surgery
3 x FEC + HP
6 x TCHP
Continue with
adjuvant trastuzumab
to complete 1 year, ET
for ER+ and/or PgR+
TCHP: 3-wk cycles, Day 1 TCHP, Day 8 T only. T, paclitaxel 80 mg/m2; C, carboplatin AUC = 6 mg/min/mL; H, trastuzumab 6 mg/kg (loading dose 8 mg/kg);
P, pertuzumab 420 mg (loading dose 840 mg).
FEC + HP: 3-wk cycles. F, 5-fluorouracil 500 mg/m2; E, epirubicin 90 mg/m2; C, cyclophosphamide 500 mg/m2; H, trastuzumab 6 mg/kg (loading dose
8 mg/kg); P, pertuzumab 420 mg (loading dose 840 mg).
Primary endpoint: pCR (ypT0/is, ypN0) by local assessment
Secondary endpoints: safety, RFS, BCSS, OS
Van Ramshort. Lancet Oncol. 2018;19:1630. van der Voort. ASCO 2020. Abstr 501.
Slide credit: clinicaloptions.com
38.
TRAIN-2: Primary Endpoint of pCRHigh rate of pCR with or without
anthracyclines
‒ cT (0-2 vs 3-4)
‒ cN (negative vs positive)
‒ HR (negative vs positive)
‒ Age (<50 vs ≥50)
Van Ramshort. Lancet Oncol. 2018;19:1630. van der Voort. ASCO 2020. Abstr 501.
pCR Rate (ypT0/is, ypN0) (%)
Main outcome consistent across
levels of prespecified subgroups
P = .75
100
80
68%
67%
140/206
141/212
TCHP
FEC + HP
60
40
20
0
Slide credit: clinicaloptions.com
39.
TRAIN-2: Event-Free Survival and OSOS
100
90
80
70
60
50
40
30
20
10
0
TCHP
(n = 219)
FEC + HP
(n = 219)
21 (10)
23(11)
Events, n (%)
3-yr EFS, % (95% Cl) 93.5 (90.4-96.6) 92.7 (88.3-96.2)
HR (95% Cl)*
0.90 (0.50-1.63)
*HR <1 favors TCHP
0
1
2
3
4
100
90
80
70
60
50
40
30
20
10
0
Overall Survival (%)
Event-Free Survival (%)
Event-Free Survival
5
TCHP
(n = 219)
8 (4)
9(4)
Events, n (%)
3-yr EFS, % (95% Cl) 98.2 (96.4-100) 97.7 (95.7-99.7)
HR (95% Cl)*
0.91 (0.35-2.36)
*HR <1 favors TCHP
0
1
Yr Since Randomization
Patients at Risk, n
TCHP
219
FEC + HP 219
219
213
Van der Voort. ASCO 2020. Abstr. 501
212
209
203
200
FEC + HP
(n = 219)
2
3
4
5
110
111
21
20
Yr Since Randomization
106
103
Patients at Risk, n
219
19 TCHP
17 FEC + HP 219
219
218
216
218
213
211
Slide credit: clinicaloptions.com
40.
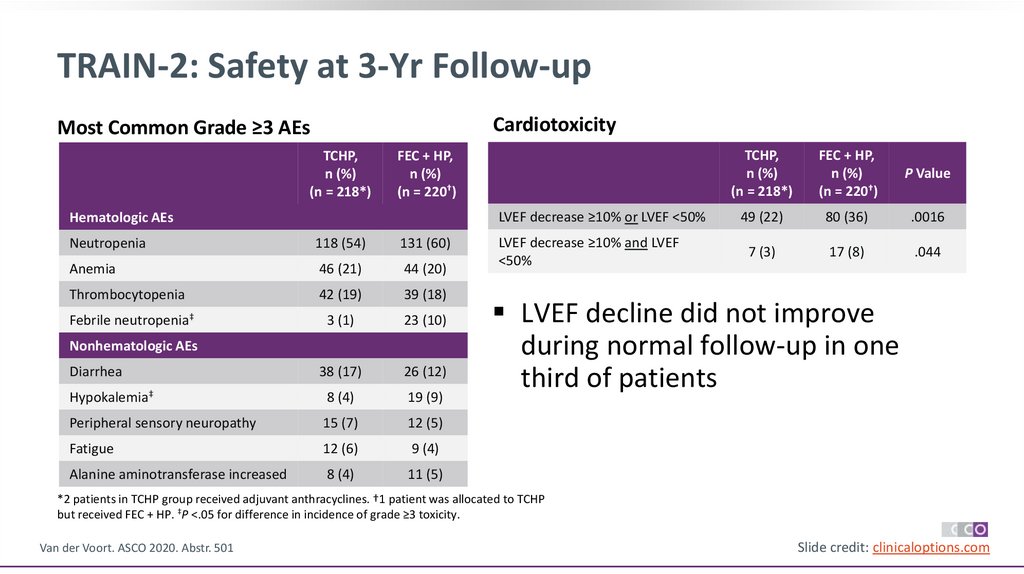
TRAIN-2: Safety at 3-Yr Follow-upCardiotoxicity
Most Common Grade ≥3 AEs
TCHP,
n (%)
(n = 218*)
TCHP,
n (%)
(n = 218*)
FEC + HP,
n (%)
(n = 220†)
P Value
LVEF decrease ≥10% or LVEF <50%
49 (22)
80 (36)
.0016
LVEF decrease ≥10% and LVEF
<50%
7 (3)
17 (8)
.044
FEC + HP,
n (%)
(n = 220†)
Hematologic AEs
Neutropenia
118 (54)
131 (60)
Anemia
46 (21)
44 (20)
Thrombocytopenia
42 (19)
39 (18)
Febrile neutropenia‡
3 (1)
23 (10)
Diarrhea
38 (17)
26 (12)
Hypokalemia‡
8 (4)
19 (9)
Peripheral sensory neuropathy
15 (7)
12 (5)
Fatigue
12 (6)
9 (4)
Alanine aminotransferase increased
8 (4)
11 (5)
Nonhematologic AEs
LVEF decline did not improve
during normal follow-up in one
third of patients
*2 patients in TCHP group received adjuvant anthracyclines. †1 patient was allocated to TCHP
but received FEC + HP. ‡P <.05 for difference in incidence of grade ≥3 toxicity.
Van der Voort. ASCO 2020. Abstr. 501
Slide credit: clinicaloptions.com
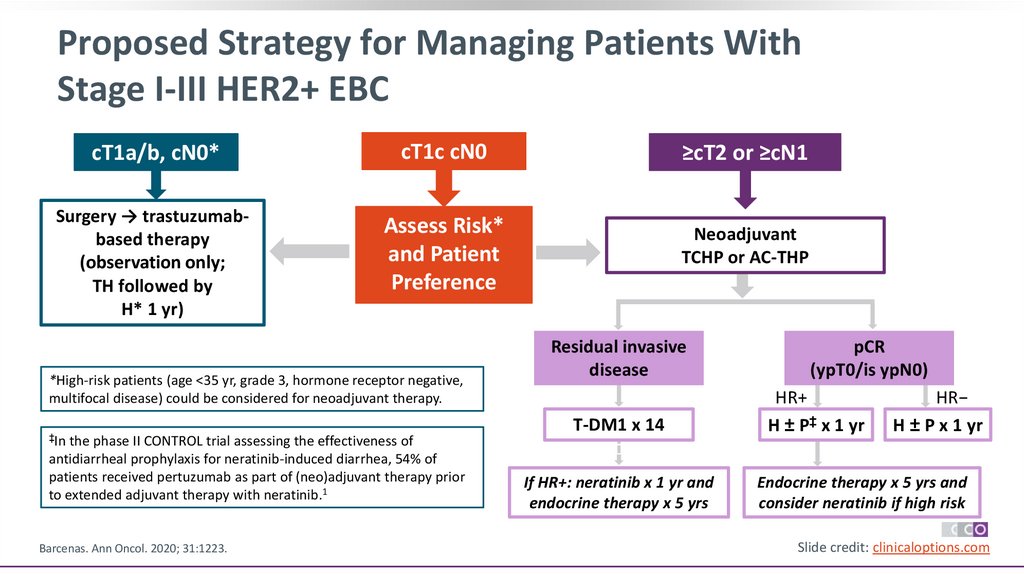
41.
Proposed Strategy for Managing Patients WithStage I-III HER2+ EBC
cT1a/b, cN0*
cT1c cN0
≥cT2 or ≥cN1
Surgery → trastuzumabbased therapy
(observation only;
TH followed by
H* 1 yr)
Assess Risk*
and Patient
Preference
Neoadjuvant
TCHP or AC-THP
*High-risk patients (age <35 yr, grade 3, hormone receptor negative,
multifocal disease) could be considered for neoadjuvant therapy.
‡In the phase II CONTROL trial assessing the effectiveness of
antidiarrheal prophylaxis for neratinib-induced diarrhea, 54% of
patients received pertuzumab as part of (neo)adjuvant therapy prior
to extended adjuvant therapy with neratinib.1
Barcenas. Ann Oncol. 2020; 31:1223.
Residual invasive
disease
T-DM1 x 14
If HR+: neratinib x 1 yr and
endocrine therapy x 5 yrs
pCR
(ypT0/is ypN0)
HR+
H ± P‡ x 1 yr
HR−
H ± P x 1 yr
Endocrine therapy x 5 yrs and
consider neratinib if high risk
Slide credit: clinicaloptions.com
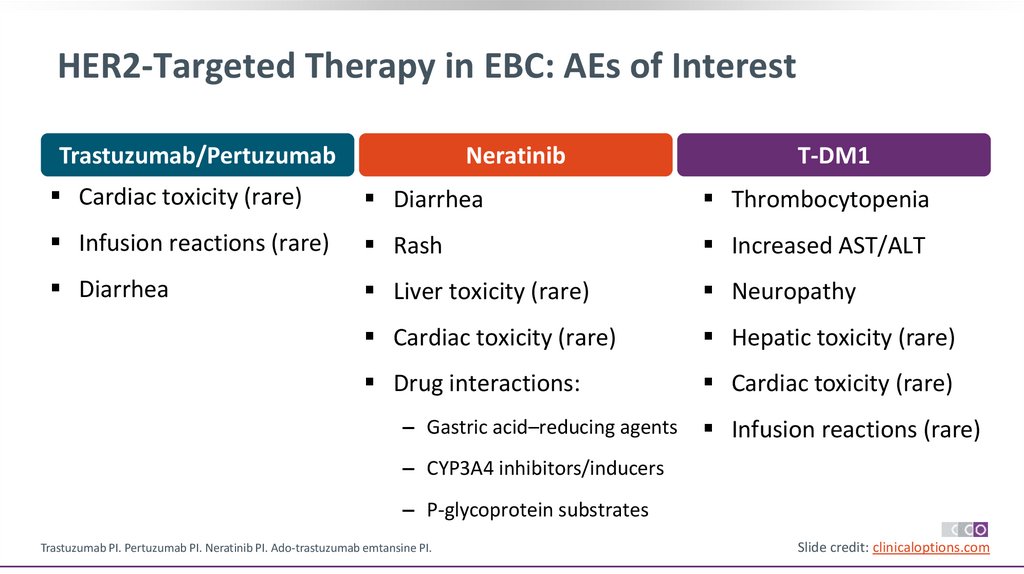
42.
HER2-Targeted Therapy in EBC: AEs of InterestTrastuzumab/Pertuzumab
Neratinib
T-DM1
Cardiac toxicity (rare)
Diarrhea
Thrombocytopenia
Infusion reactions (rare)
Rash
Increased AST/ALT
Diarrhea
Liver toxicity (rare)
Neuropathy
Cardiac toxicity (rare)
Hepatic toxicity (rare)
Drug interactions:
Cardiac toxicity (rare)
‒ Gastric acid–reducing agents
Infusion reactions (rare)
‒ CYP3A4 inhibitors/inducers
‒ P-glycoprotein substrates
Trastuzumab PI. Pertuzumab PI. Neratinib PI. Ado-trastuzumab emtansine PI.
Slide credit: clinicaloptions.com
43.
Considerations for Management ofPertuzumab-Induced Diarrhea
Diarrhea more common with
trastuzumab/pertuzumab vs
trastuzumab/placebo
‒ Grade ≥3: 9.8% vs 3.7%
Episodes of diarrhea most frequent
during cycle 1 of pertuzumab and
when given concurrently with chemo
Treatment delay or discontinuation
generally not necessary for
pertuzumab-associated diarrhea
von Minckwitz. NEJM. 2017;377:122. Bines. Clin Breast Cancer. 2020; 20:174.
Incidence of Grade ≥3 Diarrhea (APHINITY)
20
Patients (%)
‒ Any grade: 71.2% vs 45.2%
25
18%
15
10
8%
6%
5
3%
0
Anthracycline taxane + trastuzumab/pertuzumab (n = 1834)
Anthracycline taxane + trastuzumab/placebo (n = 1894)
Taxane/carboplatin + trastuzumab/pertuzumab (n = 528)
Taxane/carboplatin + trastuzumab/placebo (n = 510)
Slide credit: clinicaloptions.com
44.
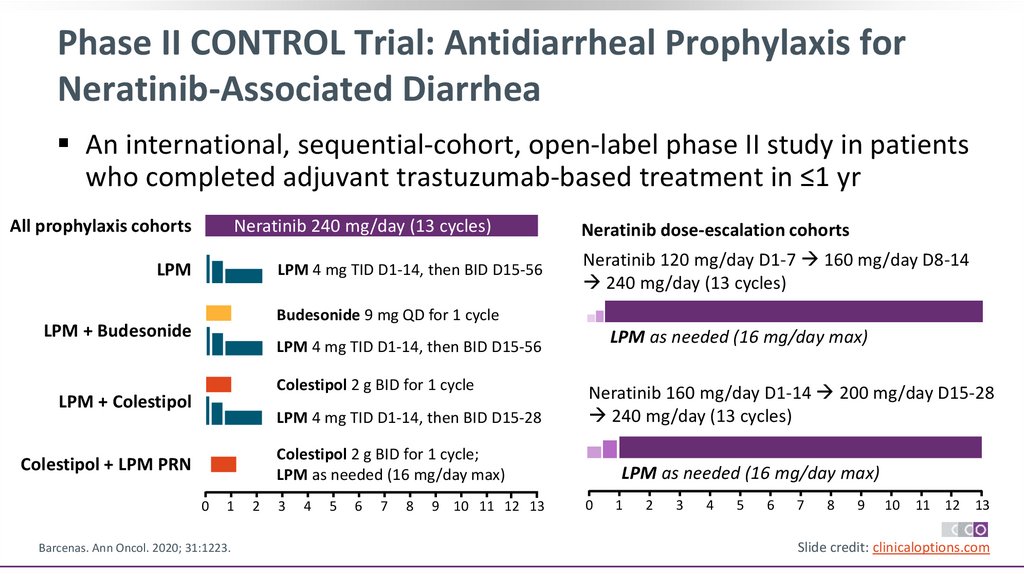
Phase II CONTROL Trial: Antidiarrheal Prophylaxis forNeratinib-Associated Diarrhea
An international, sequential-cohort, open-label phase II study in patients
who completed adjuvant trastuzumab-based treatment in ≤1 yr
All prophylaxis cohorts
Neratinib 240 mg/day (13 cycles)
LPM
LPM 4 mg TID D1-14, then BID D15-56
Neratinib dose-escalation cohorts
Neratinib 120 mg/day D1-7 160 mg/day D8-14
240 mg/day (13 cycles)
Budesonide 9 mg QD for 1 cycle
LPM + Budesonide
LPM as needed (16 mg/day max)
LPM 4 mg TID D1-14, then BID D15-56
Colestipol 2 g BID for 1 cycle
LPM + Colestipol
LPM 4 mg TID D1-14, then BID D15-28
Neratinib 160 mg/day D1-14 200 mg/day D15-28
240 mg/day (13 cycles)
Colestipol 2 g BID for 1 cycle;
LPM as needed (16 mg/day max)
Colestipol + LPM PRN
0
1
Barcenas. Ann Oncol. 2020; 31:1223.
2
3
4
5
6
7
8
9 10 11 12 13
LPM as needed (16 mg/day max)
0
1
2
3
4
5
6
7
8
9
10
11 12 13
Slide credit: clinicaloptions.com
45.
CONTROL: Patient DispositionCharacteristic1
Loperamide
(n = 137)
Budesonide +
Loperamide
(n = 64)
Colestipol +
Loperamide
(n = 136)
Colestipol +
Loperamide
PRN
(n = 104)
On neratinib tx, n
(%)
0
0
0
0
Completed 1 yr of
neratinib tx, n (%)
76 (55.5)
51 (79.7)
97 (71.3)
Characteristic2
Neratinib
Dose
Escalation
Cohort 1
(n = 60)
Neratinib
Dose
Escalation
Cohort 2
(n = 62)
On neratinib tx, n
(%)
0
23 (37.1)
75 (72.1)
Completed 1 yr of
neratinib tx, n (%)
47 (78.3)
24 (38.7)
13 (21.7)
15 (24.2)
11.96
(11.1-12.0)
9.17
D/c neratinib
before 1 yr for
any reason, n (%)
61 (44.5)
13 (20.3)
39 (28.7)
29 (27.9)
D/c neratinib
before 1 yr for
any reason, n (%)
Median duration
neratinib, mo
(range)
11. 63
(0.1-13.1)
11.96
(0.2-13.2)
11.94
(0-14.4)
11.96
(0.1-12.5)
Median duration
neratinib, mo
(IQR)
1. Barcenas. Ann Oncol. 2020; 31:1223.. 2. Ruiz-Borrego. SABCS 2020. Abstr PS13-20.
Slide credit: clinicaloptions.com
46.
CONTROL: Key Diarrhea Outcomes (All Cohorts)Grade 1
Grade 2
Grade 3
Grade 4
Neratinib
Dose
Escalation
Cohort 1
(n = 60)
Neratinib
Dose
Escalation
Cohort 2
(n = 62)
24 (40)
27 (45)
8 (13.3)
0
24 (38.7)
21 (33.9)
16 (25.8)
0
Median episodes
of grade 3 diarrhea
2
Median time to
first onset of grade
3 diarrhea, days
45
20
Median cumulative
duration of grade 3
diarrhea, days
2.5
2
1
35
32%
31%
30
Incidence (%)
Outcome, n (%)
28%
26%
25
20
15
21%
20%
13%
11%
10
5
8%
4%
3%
5%
0
Ruiz-Borrego. SABCS 2020. Abstr PS13-20
DE2 +
Loperamide Budesonide Colestipol Colestipol + DE1 +
+
+
Loperamide Loperamide Loperamide
(n = 137)
PRN
PRN
Loperamide Loperamide
PRN
(n = 60)
(n = 62)
(n = 64)
(n = 136)
(n = 104)
Grade 3 diarrhea
D/c due to diarrhea
Slide credit: clinicaloptions.com
47.
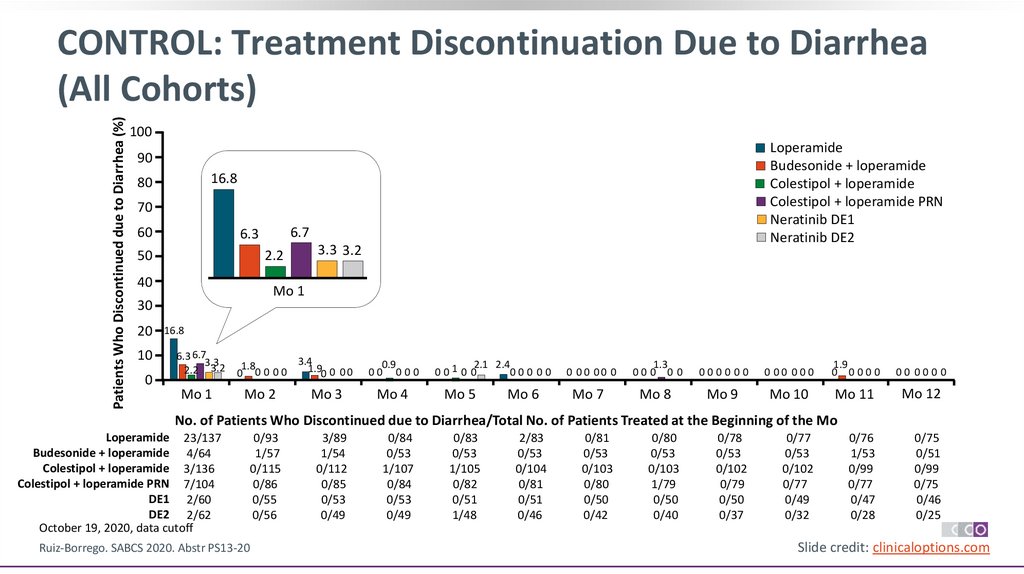
Patients Who Discontinued due to Diarrhea (%)CONTROL: Treatment Discontinuation Due to Diarrhea
(All Cohorts)
100
Loperamide
Budesonide + loperamide
Colestipol + loperamide
Colestipol + loperamide PRN
Neratinib DE1
Neratinib DE2
90
16.8
80
70
60
2.2
50
40
10
0
3.3 3.2
Mo 1
30
20
6.7
6.3
16.8
6.3 6.7
3.3
2.2 3.2
3.4
1.8
1.90 0 0 0
0 00 00
0.9
00 000
Mo 1
Mo 2
Mo 4
Mo 3
2.1 2.4
0010 0
00 0 00
Mo 5
Mo 6
0 00 00 0
1.3
00 0 0 0
00000 0
0 00 00 0
1.9
0 0000
00 000 0
Mo 7
Mo 8
Mo 9
Mo 10
Mo 11
Mo 12
No. of Patients Who Discontinued due to Diarrhea/Total No. of Patients Treated at the Beginning of the Mo
Loperamide 23/137
Budesonide + loperamide 4/64
Colestipol + loperamide 3/136
Colestipol + loperamide PRN 7/104
DE1 2/60
DE2 2/62
October 19, 2020, data cutoff
Ruiz-Borrego. SABCS 2020. Abstr PS13-20
0/93
1/57
0/115
0/86
0/55
0/56
3/89
1/54
0/112
0/85
0/53
0/49
0/84
0/53
1/107
0/84
0/53
0/49
0/83
0/53
1/105
0/82
0/51
1/48
2/83
0/53
0/104
0/81
0/51
0/46
0/81
0/53
0/103
0/80
0/50
0/42
0/80
0/53
0/103
1/79
0/50
0/40
0/78
0/53
0/102
0/79
0/50
0/37
0/77
0/53
0/102
0/77
0/49
0/32
0/76
1/53
0/99
0/77
0/47
0/28
0/75
0/51
0/99
0/75
0/46
0/25
Slide credit: clinicaloptions.com
48.
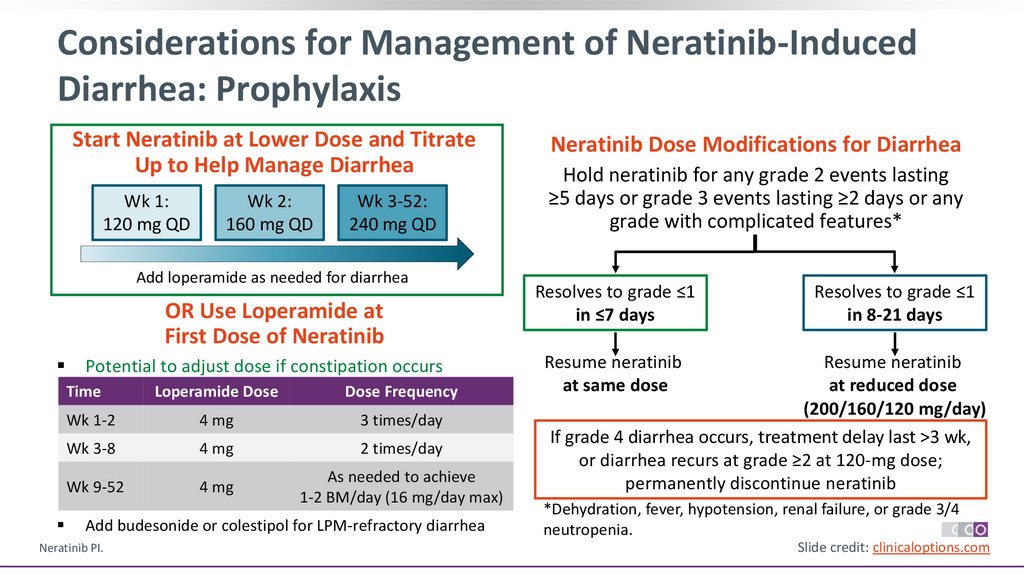
Considerations for Management of Neratinib-InducedDiarrhea: Prophylaxis
Start Neratinib at Lower Dose and Titrate
Up to Help Manage Diarrhea
Wk 1:
120 mg QD
Wk 2:
160 mg QD
Wk 3-52:
240 mg QD
Add loperamide as needed for diarrhea
OR Use Loperamide at
First Dose of Neratinib
Potential to adjust dose if constipation occurs
Time
Loperamide Dose
Dose Frequency
Wk 1-2
4 mg
3 times/day
Wk 3-8
4 mg
2 times/day
Wk 9-52
4 mg
As needed to achieve
1-2 BM/day (16 mg/day max)
Add budesonide or colestipol for LPM-refractory diarrhea
Neratinib PI.
Neratinib Dose Modifications for Diarrhea
Hold neratinib for any grade 2 events lasting
≥5 days or grade 3 events lasting ≥2 days or any
grade with complicated features*
Resolves to grade ≤1
in ≤7 days
Resolves to grade ≤1
in 8-21 days
Resume neratinib
at same dose
Resume neratinib
at reduced dose
(200/160/120 mg/day)
If grade 4 diarrhea occurs, treatment delay last >3 wk,
or diarrhea recurs at grade ≥2 at 120-mg dose;
permanently discontinue neratinib
*Dehydration, fever, hypotension, renal failure, or grade 3/4
neutropenia.
Slide credit: clinicaloptions.com
49.
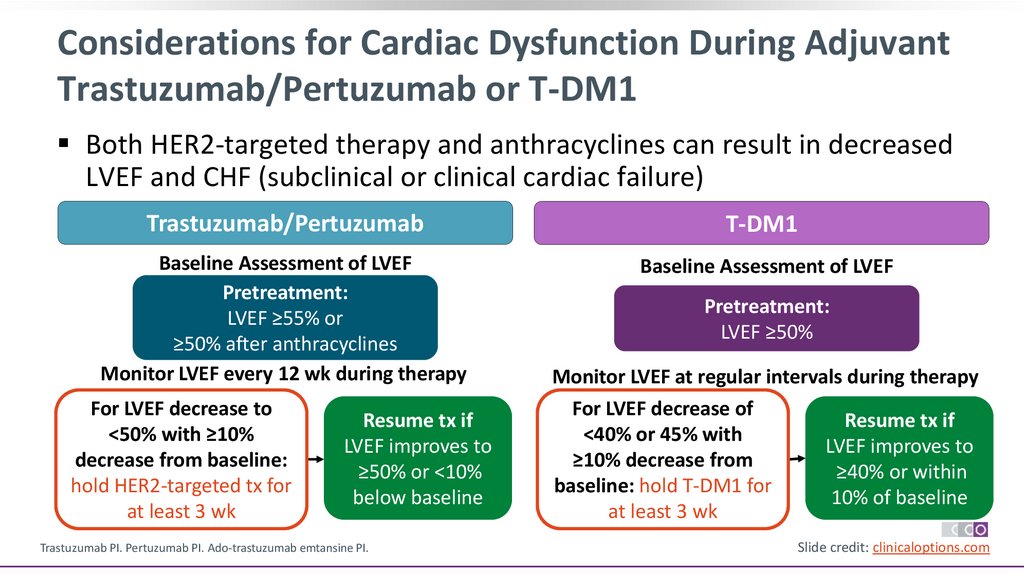
Considerations for Cardiac Dysfunction During AdjuvantTrastuzumab/Pertuzumab or T-DM1
Both HER2-targeted therapy and anthracyclines can result in decreased
LVEF and CHF (subclinical or clinical cardiac failure)
Trastuzumab/Pertuzumab
T-DM1
Baseline Assessment of LVEF
Pretreatment:
LVEF ≥55% or
≥50% after anthracyclines
Monitor LVEF every 12 wk during therapy
Baseline Assessment of LVEF
For LVEF decrease to
<50% with ≥10%
decrease from baseline:
hold HER2-targeted tx for
at least 3 wk
Resume tx if
LVEF improves to
≥50% or <10%
below baseline
Trastuzumab PI. Pertuzumab PI. Ado-trastuzumab emtansine PI.
Pretreatment:
LVEF ≥50%
Monitor LVEF at regular intervals during therapy
For LVEF decrease of
Resume tx if
<40% or 45% with
LVEF improves to
≥10% decrease from
≥40% or within
baseline: hold T-DM1 for
10% of baseline
at least 3 wk
Slide credit: clinicaloptions.com
50.
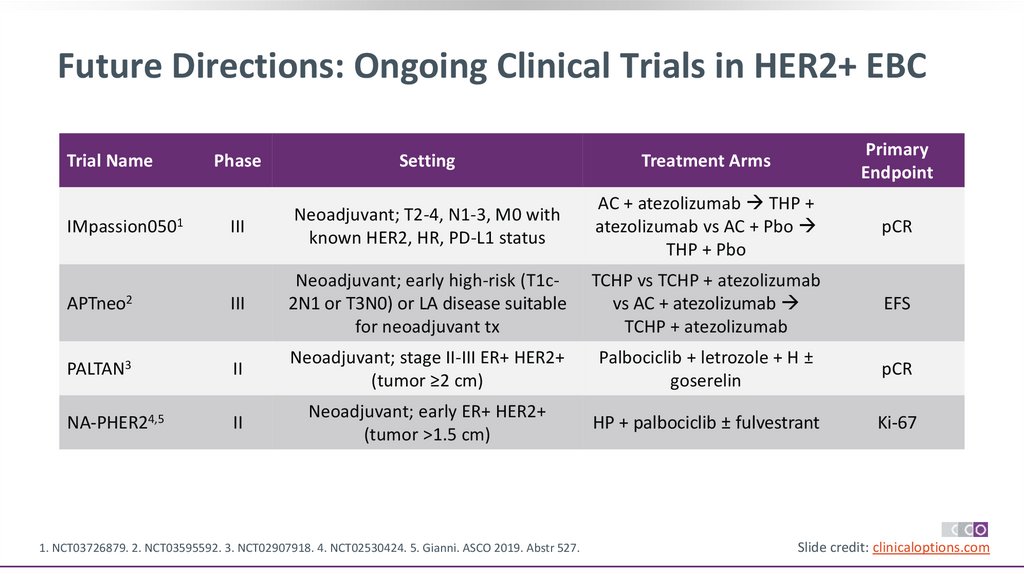
Future Directions: Ongoing Clinical Trials in HER2+ EBCPhase
Setting
Treatment Arms
Primary
Endpoint
III
Neoadjuvant; T2-4, N1-3, M0 with
known HER2, HR, PD-L1 status
AC + atezolizumab THP +
atezolizumab vs AC + Pbo
THP + Pbo
pCR
APTneo2
III
Neoadjuvant; early high-risk (T1c2N1 or T3N0) or LA disease suitable
for neoadjuvant tx
TCHP vs TCHP + atezolizumab
vs AC + atezolizumab
TCHP + atezolizumab
EFS
PALTAN3
II
Neoadjuvant; stage II-III ER+ HER2+
(tumor ≥2 cm)
Palbociclib + letrozole + H ±
goserelin
pCR
NA-PHER24,5
II
Neoadjuvant; early ER+ HER2+
(tumor >1.5 cm)
HP + palbociclib ± fulvestrant
Ki-67
Trial Name
IMpassion0501
1. NCT03726879. 2. NCT03595592. 3. NCT02907918. 4. NCT02530424. 5. Gianni. ASCO 2019. Abstr 527.
Slide credit: clinicaloptions.com
51.
ConclusionsFor patients with HER2+ BC, availability of HER2-targeted agents has markedly and rapidly improved
overall outcomes
Neoadj chemo plus trastuzumab/pertuzumab for patients with HER2+ EBC and a tumor ≥2 cm (T2)
diameter or with node-positive disease
Non-anthracycline regimens with trastuzumab/pertuzumab deliver similar efficacy with less cardiac
toxicity
For adjuvant therapy (after surgery first or neoadjuvant chemotherapy with <pCR after surgery:
‒ APHINITY: dual HER2-therapy with trastuzumab and pertuzumab (either continued for a total of 1 year
after neoadj chemo or with adj chemo for a total of 1 year)
‒ KATHERINE: T-DM1 as adjuvant therapy for patients with residual invasive disease after neoadjuvant
taxane and trastuzumab-based treatment
‒ ExteNET: extended adjuvant therapy with neratinib after anti-HER2 antibody therapy, particularly
hormone receptor positive disease and without pCR after neoadj therapy
52.
Go Online for More CCOCoverage of Breast Cancer!
Additional CME/CE-certified programs on treatment options for patients with breast cancer
Capsule Summaries with expert faculty commentary on all the key studies from recent
oncology conferences
Podcasts and ClinicalThought commentaries with information on
managing patients with breast cancer
clinicaloptions.com/oncology