


 finance
Similar presentations:


The income statement
1.
The income statementASB 1110 Financial Accounting
2.
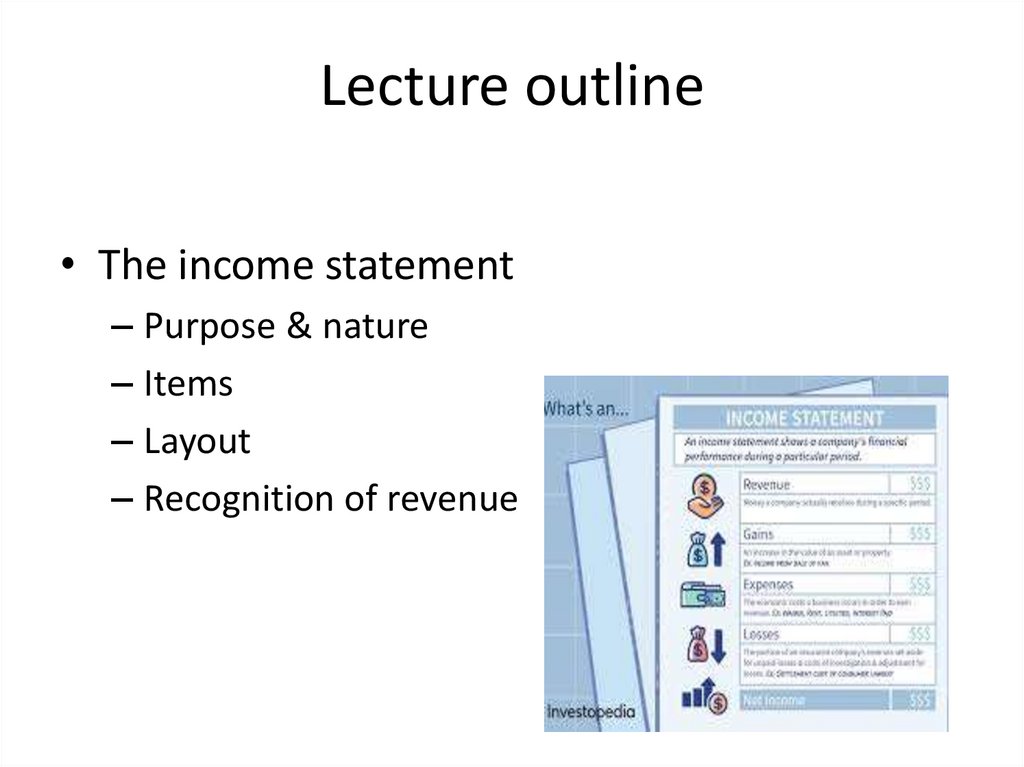
Lecture outline• The income statement
– Purpose & nature
– Items
– Layout
– Recognition of revenue
3.
The purpose of the income statement• Primary purpose of a business is to generate
wealth (profit)
– Statement of financial position lays out in which forms
this wealth is held
• Income statement
– measures and reports how much profit (wealth) the
business has generated over a period
– Helps users to understand how that profit was made
– Lists revenues (incomes) and expenses (costs)
4.
Revenue• Revenue =
a measure of the inflow of economic
benefits arising from the ordinary
operations of a business
• In order to measure profits, the total revenue
of a business, generated during a particular
period, must be identified
5.
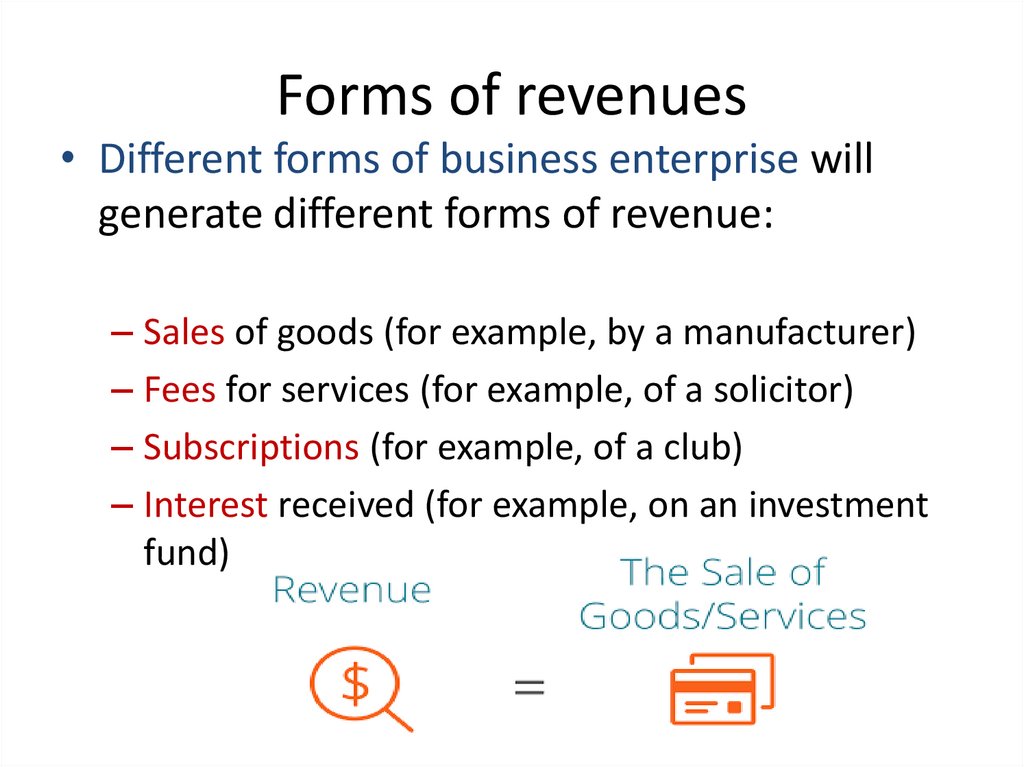
Forms of revenues• Different forms of business enterprise will
generate different forms of revenue:
– Sales of goods (for example, by a manufacturer)
– Fees for services (for example, of a solicitor)
– Subscriptions (for example, of a club)
– Interest received (for example, on an investment
fund)
6.
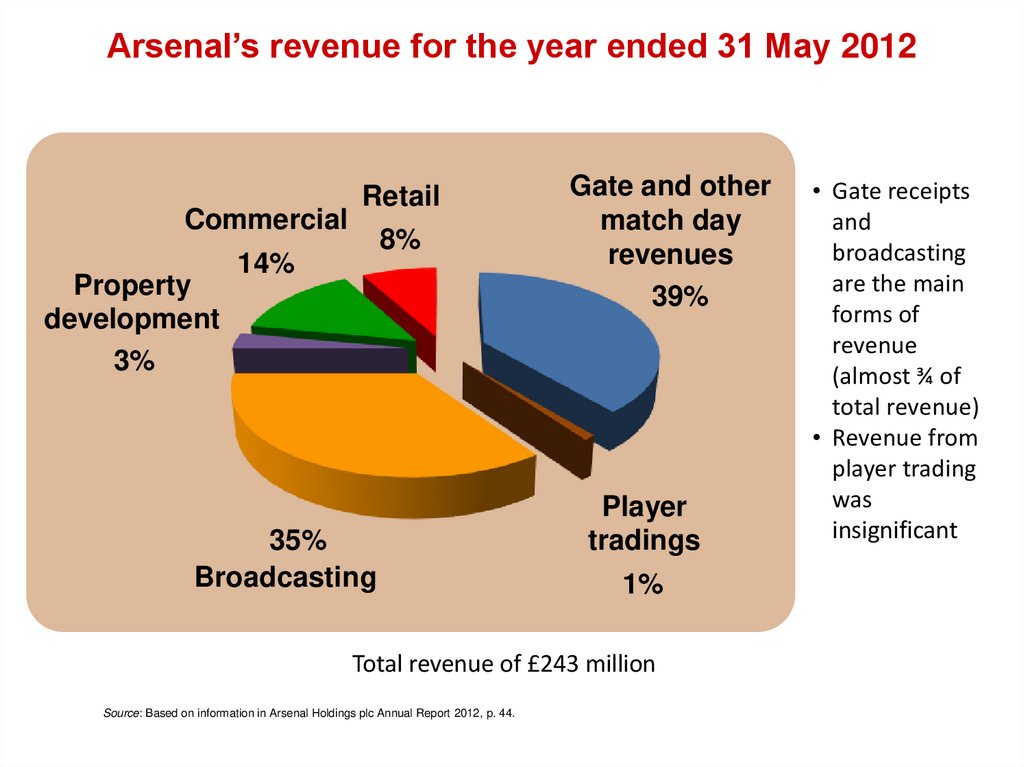
Arsenal’s revenue for the year ended 31 May 2012Commercial
Property
development
3%
Retail
8%
14%
35%
Broadcasting
Gate and other
match day
revenues
39%
Player
tradings
1%
Total revenue of £243 million
Source: Based on information in Arsenal Holdings plc Annual Report 2012, p. 44.
• Gate receipts
and
broadcasting
are the main
forms of
revenue
(almost ¾ of
total revenue)
• Revenue from
player trading
was
insignificant
7.
Expense• Expense =
the outflow of economic benefits arising from the
ordinary operations of a business
• In order to measure profits, the total expenses of a
business, generated during a particular period, must
also be identified
• It is the opposite of revenue
• Expenses are incurred in the process of generating, or
attempting to generate, revenue
8.
Forms of expense• The nature of the business will again determine the type
of expenses that will be incurred
• Common types of expenses:
– The cost of buying or making the goods that are sold during
the period concerned – cost of sales, costs of goods sold
– Salaries and wages
– Rent and rates
– Motor vehicle running expenses
– Insurance
– Printing and stationary
– Heat and light
– Telephone and postage
9.
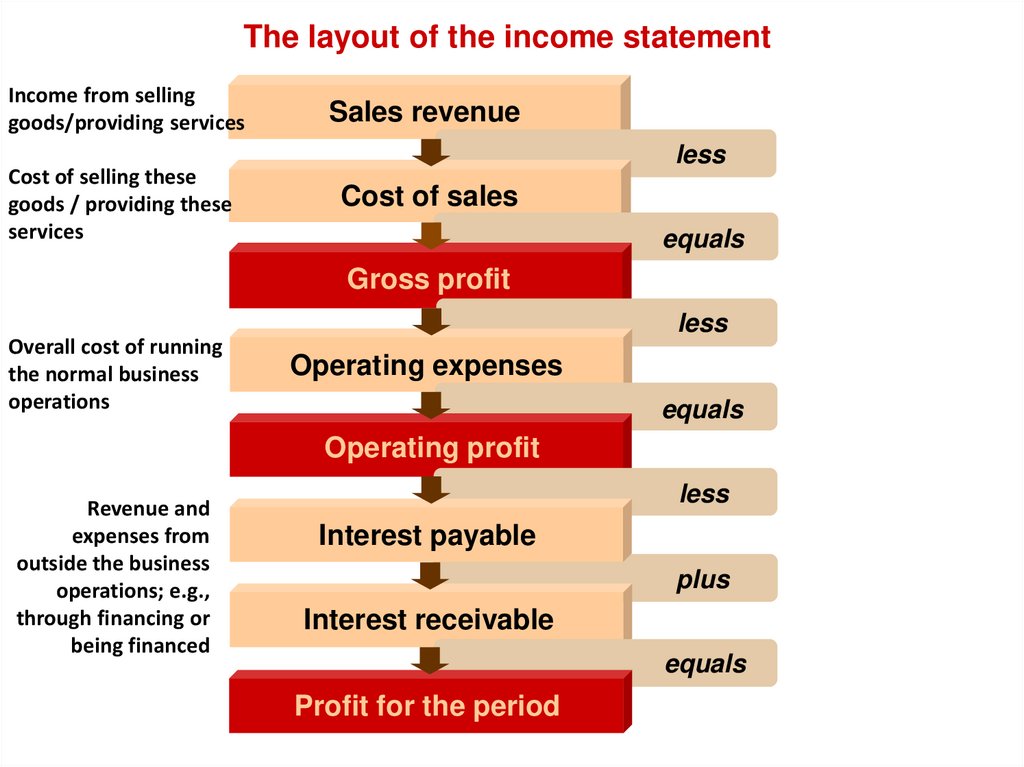
The layout of the income statementIncome from selling
goods/providing services
Cost of selling these
goods / providing these
services
Sales revenue
less
Cost of sales
equals
Gross profit
Overall cost of running
the normal business
operations
less
Operating expenses
equals
Operating profit
Revenue and
expenses from
outside the business
operations; e.g.,
through financing or
being financed
less
Interest payable
plus
Interest receivable
equals
Profit for the period
10.
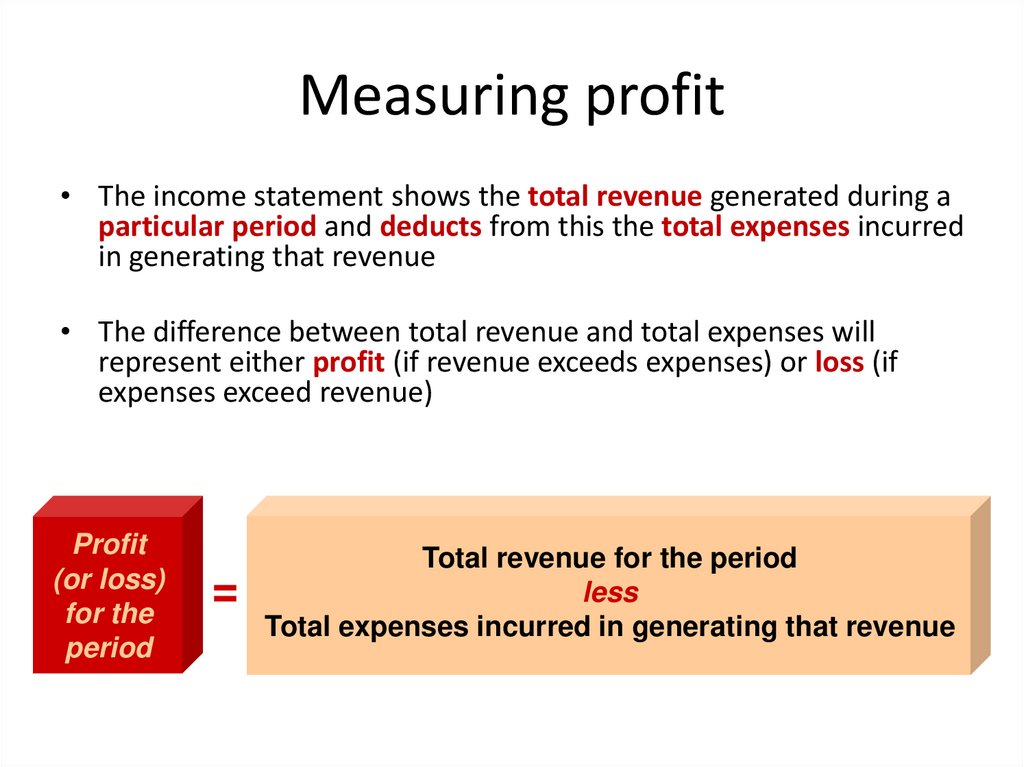
Measuring profit• The income statement shows the total revenue generated during a
particular period and deducts from this the total expenses incurred
in generating that revenue
• The difference between total revenue and total expenses will
represent either profit (if revenue exceeds expenses) or loss (if
expenses exceed revenue)
Profit
(or loss)
for the
period
=
Total revenue for the period
less
Total expenses incurred in generating that revenue
11.
Income statement layout• The layout will vary according to the type of
business to which it relates
• Let’s consider a retail business (a business that
buys goods in their complete state and resells
them)
12.
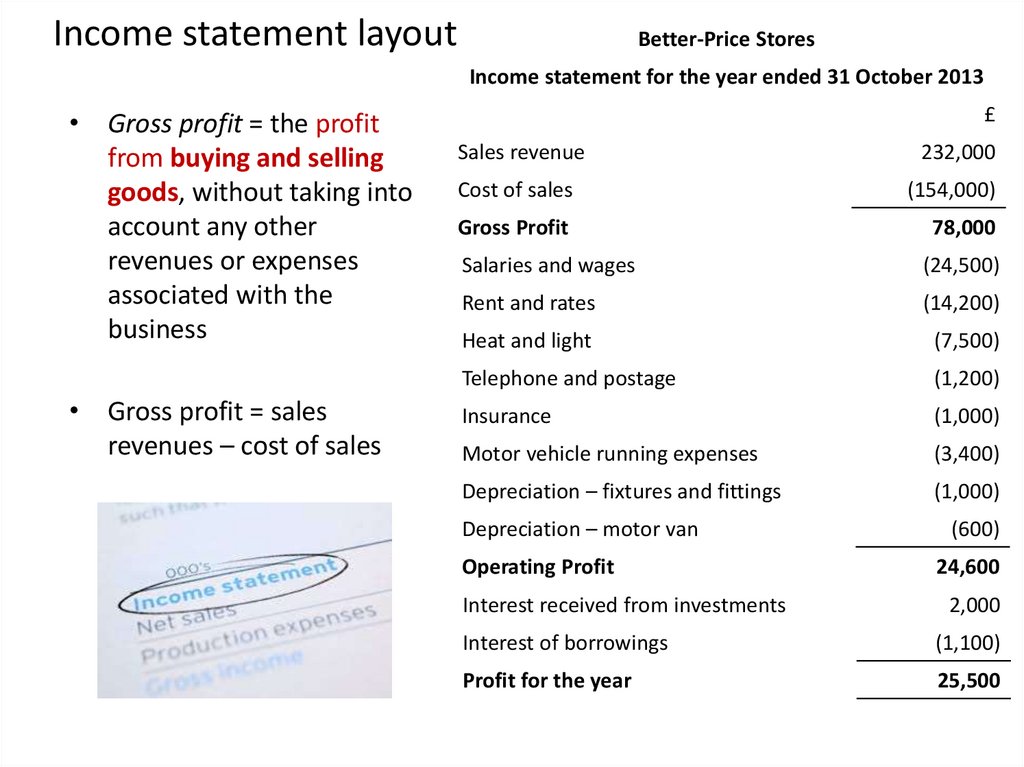
Income statement layoutBetter-Price Stores
Income statement for the year ended 31 October 2013
• Gross profit = the profit
from buying and selling
goods, without taking into
account any other
revenues or expenses
associated with the
business
• Gross profit = sales
revenues – cost of sales
£
Sales revenue
232,000
Cost of sales
(154,000)
Gross Profit
78,000
Salaries and wages
(24,500)
Rent and rates
(14,200)
Heat and light
(7,500)
Telephone and postage
(1,200)
Insurance
(1,000)
Motor vehicle running expenses
(3,400)
Depreciation – fixtures and fittings
(1,000)
Depreciation – motor van
(600)
Operating Profit
24,600
Interest received from investments
2,000
Interest of borrowings
(1,100)
Profit for the year
25,500
13.
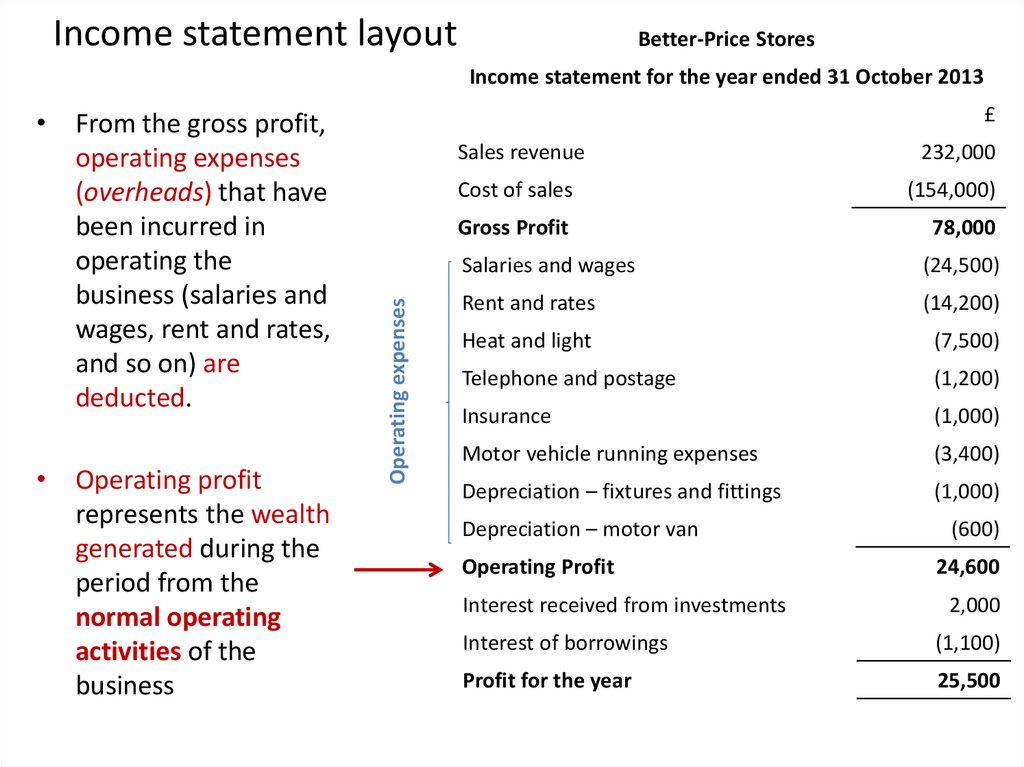
Income statement layoutBetter-Price Stores
Income statement for the year ended 31 October 2013
• Operating profit
represents the wealth
generated during the
period from the
normal operating
activities of the
business
£
Operating expenses
• From the gross profit,
operating expenses
(overheads) that have
been incurred in
operating the
business (salaries and
wages, rent and rates,
and so on) are
deducted.
Sales revenue
232,000
Cost of sales
(154,000)
Gross Profit
78,000
Salaries and wages
(24,500)
Rent and rates
(14,200)
Heat and light
(7,500)
Telephone and postage
(1,200)
Insurance
(1,000)
Motor vehicle running expenses
(3,400)
Depreciation – fixtures and fittings
(1,000)
Depreciation – motor van
(600)
Operating Profit
24,600
Interest received from investments
2,000
Interest of borrowings
(1,100)
Profit for the year
25,500
14.
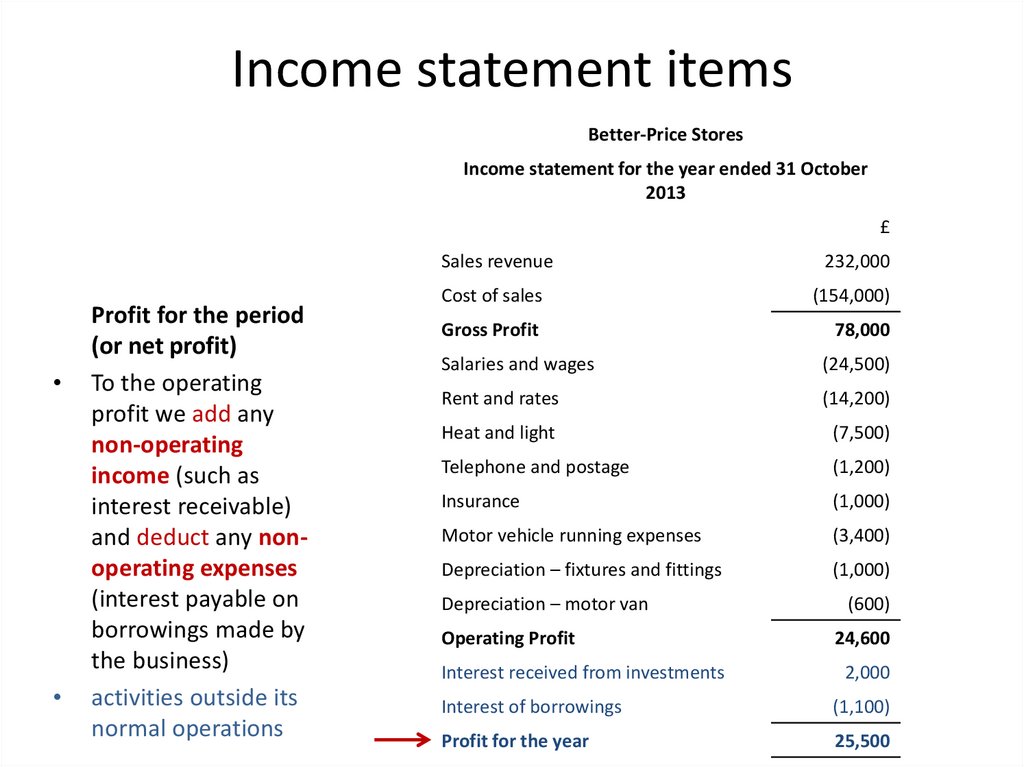
Income statement itemsBetter-Price Stores
Income statement for the year ended 31 October
2013
£
Profit for the period
(or net profit)
To the operating
profit we add any
non-operating
income (such as
interest receivable)
and deduct any nonoperating expenses
(interest payable on
borrowings made by
the business)
activities outside its
normal operations
Sales revenue
232,000
Cost of sales
(154,000)
Gross Profit
78,000
Salaries and wages
(24,500)
Rent and rates
(14,200)
Heat and light
(7,500)
Telephone and postage
(1,200)
Insurance
(1,000)
Motor vehicle running expenses
(3,400)
Depreciation – fixtures and fittings
(1,000)
Depreciation – motor van
(600)
Operating Profit
24,600
Interest received from investments
2,000
Interest of borrowings
(1,100)
Profit for the year
25,500
15.
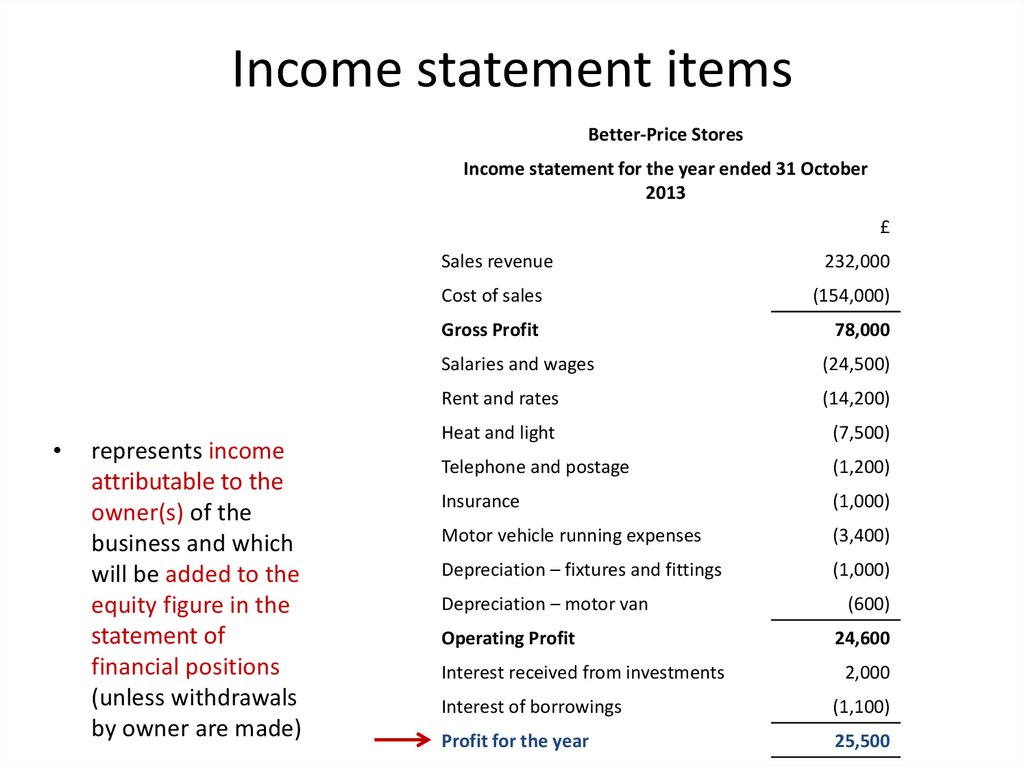
Income statement itemsBetter-Price Stores
Income statement for the year ended 31 October
2013
£
represents income
attributable to the
owner(s) of the
business and which
will be added to the
equity figure in the
statement of
financial positions
(unless withdrawals
by owner are made)
Sales revenue
232,000
Cost of sales
(154,000)
Gross Profit
78,000
Salaries and wages
(24,500)
Rent and rates
(14,200)
Heat and light
(7,500)
Telephone and postage
(1,200)
Insurance
(1,000)
Motor vehicle running expenses
(3,400)
Depreciation – fixtures and fittings
(1,000)
Depreciation – motor van
(600)
Operating Profit
24,600
Interest received from investments
2,000
Interest of borrowings
(1,100)
Profit for the year
25,500
16.
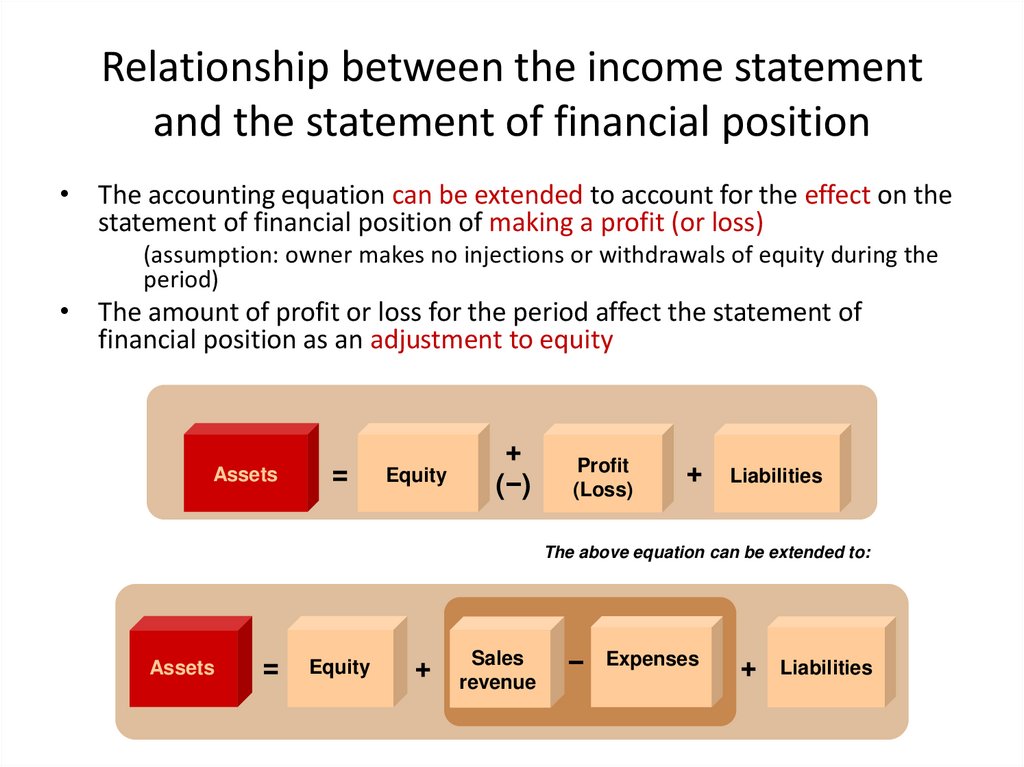
Relationship between the income statementand the statement of financial position
• The accounting equation can be extended to account for the effect on the
statement of financial position of making a profit (or loss)
(assumption: owner makes no injections or withdrawals of equity during the
period)
• The amount of profit or loss for the period affect the statement of
financial position as an adjustment to equity
Assets
=
Equity
+
(−)
Profit
(Loss)
+
Liabilities
The above equation can be extended to:
Assets
=
Equity
+
Sales
revenue
−
Expenses
+
Liabilities
17.
Relationship between the income statementand the statement of financial position
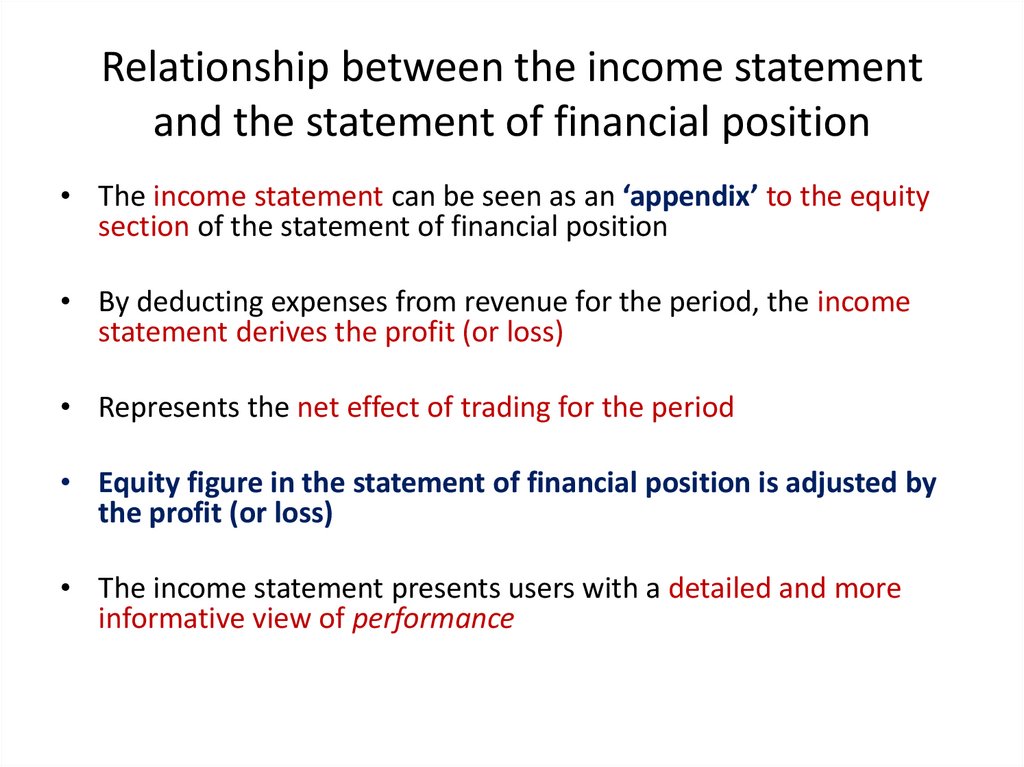
• The income statement can be seen as an ‘appendix’ to the equity
section of the statement of financial position
• By deducting expenses from revenue for the period, the income
statement derives the profit (or loss)
• Represents the net effect of trading for the period
• Equity figure in the statement of financial position is adjusted by
the profit (or loss)
• The income statement presents users with a detailed and more
informative view of performance
18.
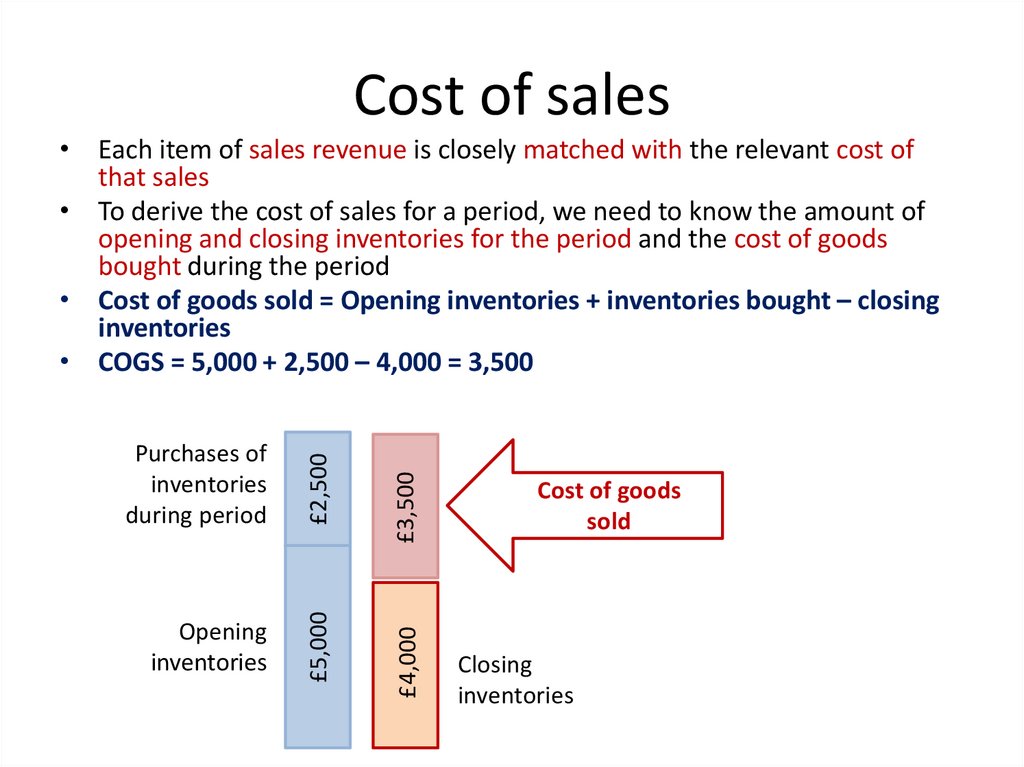
Cost of sales£3,500
£2,500
Opening
inventories
£4,000
Purchases of
inventories
during period
£5,000
• Each item of sales revenue is closely matched with the relevant cost of
that sales
• To derive the cost of sales for a period, we need to know the amount of
opening and closing inventories for the period and the cost of goods
bought during the period
• Cost of goods sold = Opening inventories + inventories bought – closing
inventories
• COGS = 5,000 + 2,500 – 4,000 = 3,500
Cost of goods
sold
Closing
inventories
19.
Example: Better-PriceStores
Inventories
Closing
Opening
inventories
inventories
bought
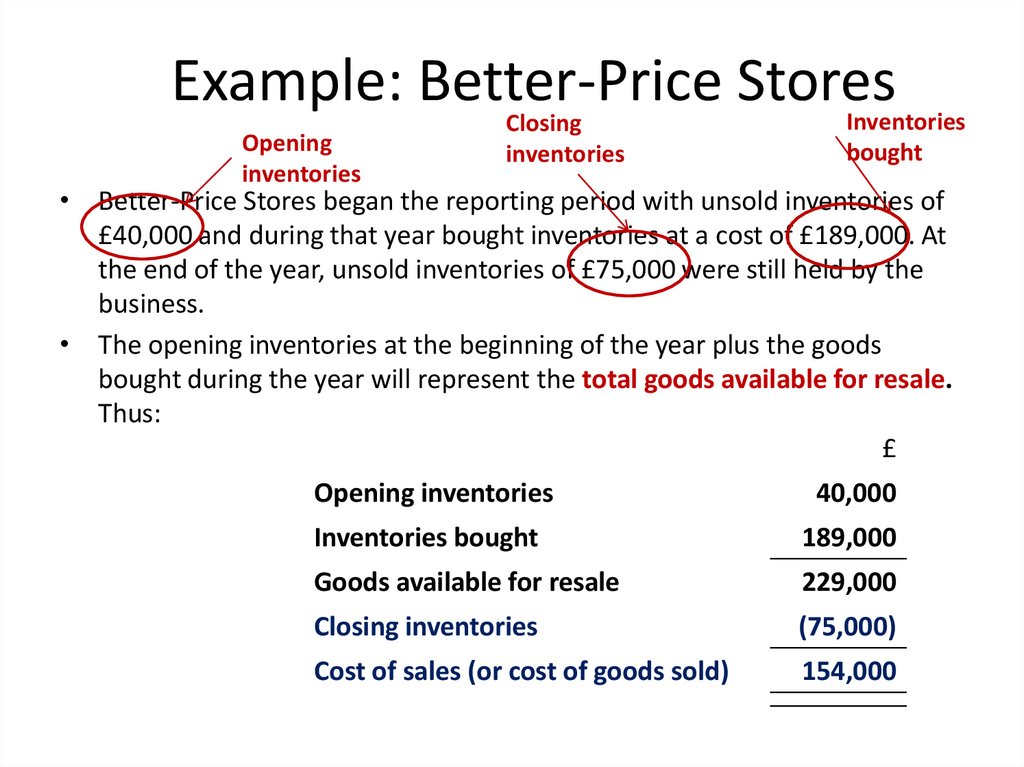
• Better-Price Stores began the reporting period with unsold inventories of
£40,000 and during that year bought inventories at a cost of £189,000. At
the end of the year, unsold inventories of £75,000 were still held by the
business.
• The opening inventories at the beginning of the year plus the goods
bought during the year will represent the total goods available for resale.
Thus:
£
Opening inventories
40,000
Inventories bought
189,000
Goods available for resale
229,000
Closing inventories
(75,000)
Cost of sales (or cost of goods sold)
154,000
20.
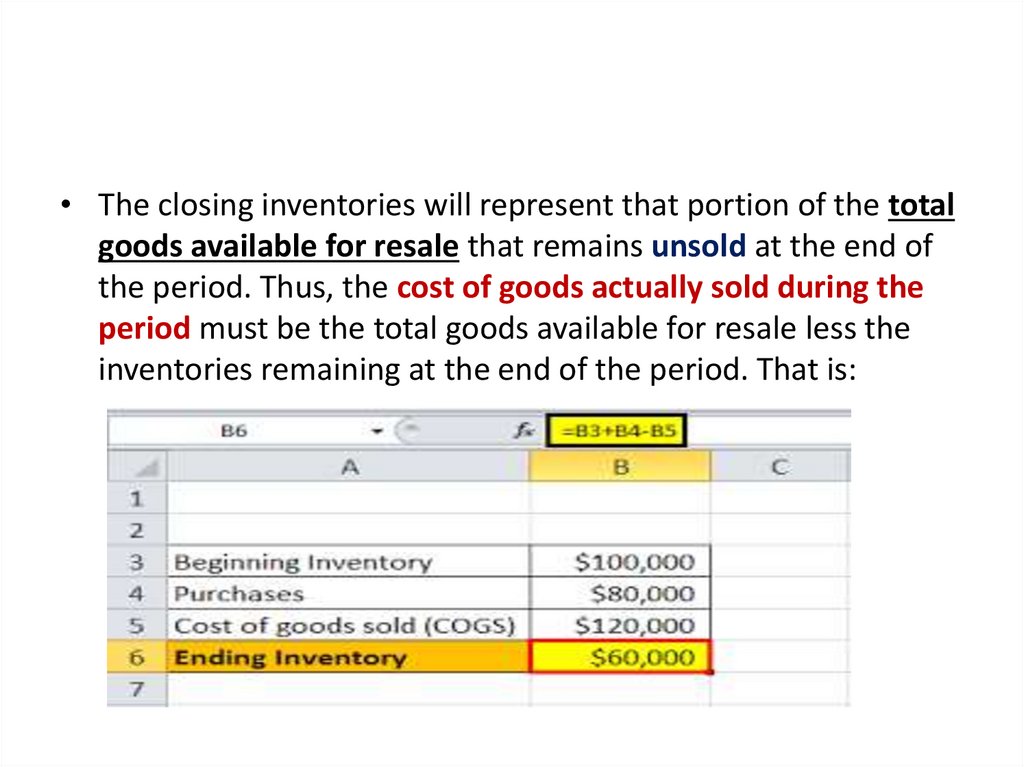
• The closing inventories will represent that portion of the totalgoods available for resale that remains unsold at the end of
the period. Thus, the cost of goods actually sold during the
period must be the total goods available for resale less the
inventories remaining at the end of the period. That is:
21.
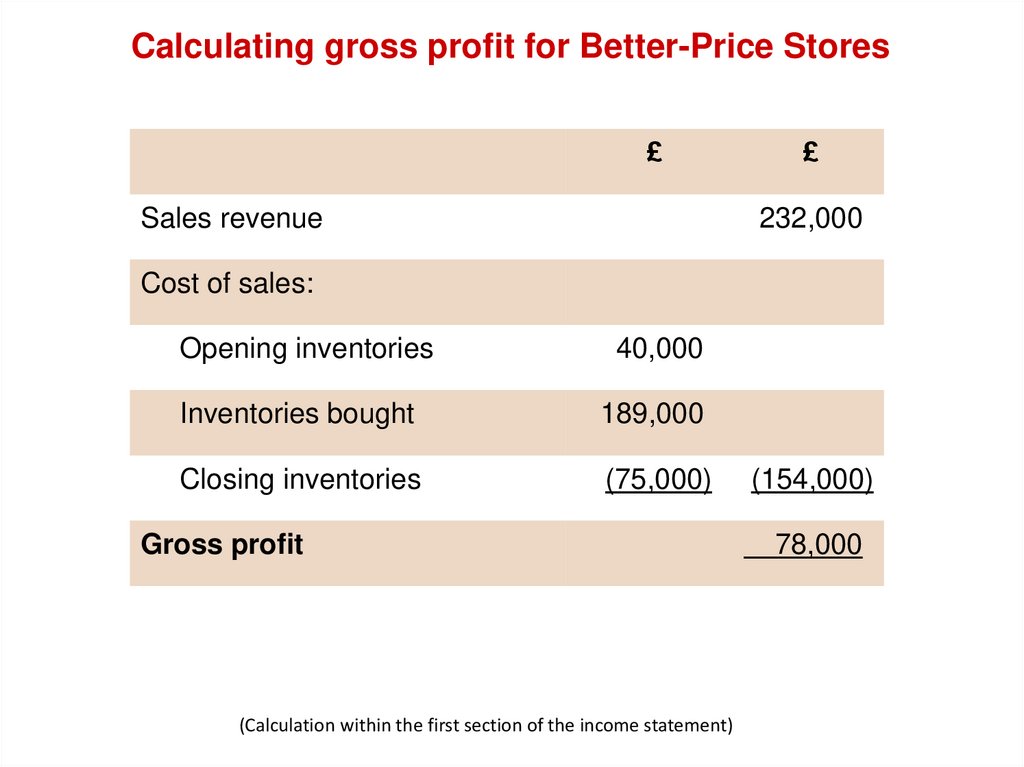
Calculating gross profit for Better-Price Stores£
Sales revenue
£
232,000
Cost of sales:
Opening inventories
40,000
Inventories bought
189,000
Closing inventories
(75,000)
Gross profit
(Calculation within the first section of the income statement)
(154,000)
78,000
22.
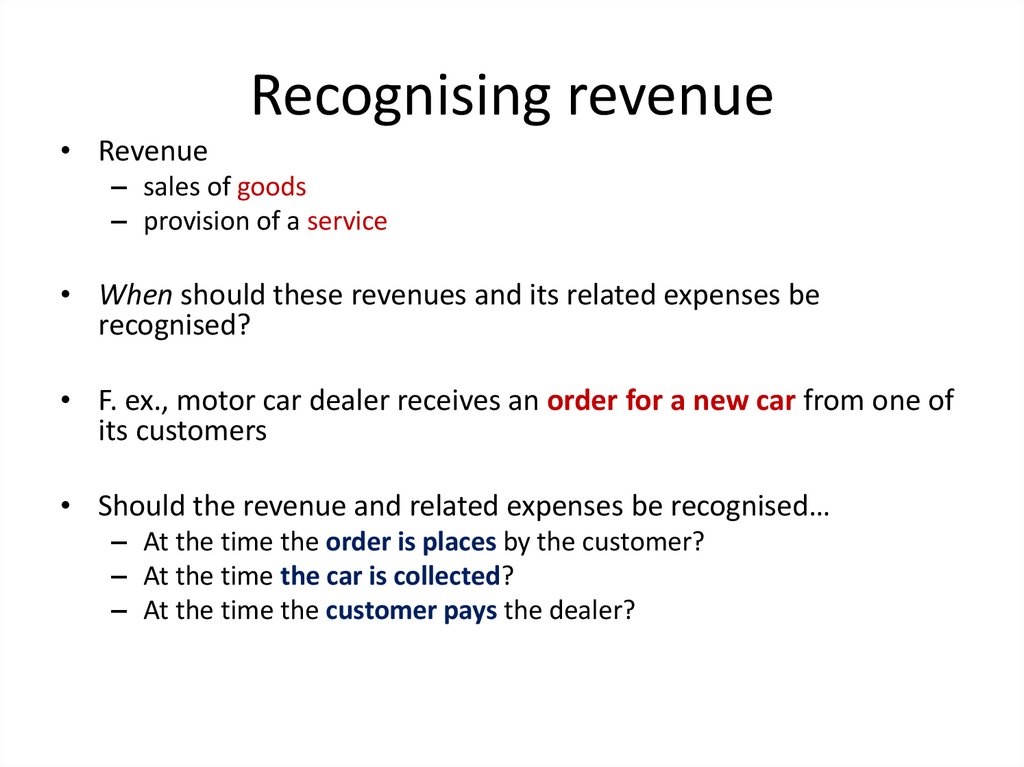
Recognising revenue• Revenue
– sales of goods
– provision of a service
• When should these revenues and its related expenses be
recognised?
• F. ex., motor car dealer receives an order for a new car from one of
its customers
• Should the revenue and related expenses be recognised…
– At the time the order is places by the customer?
– At the time the car is collected?
– At the time the customer pays the dealer?
23.
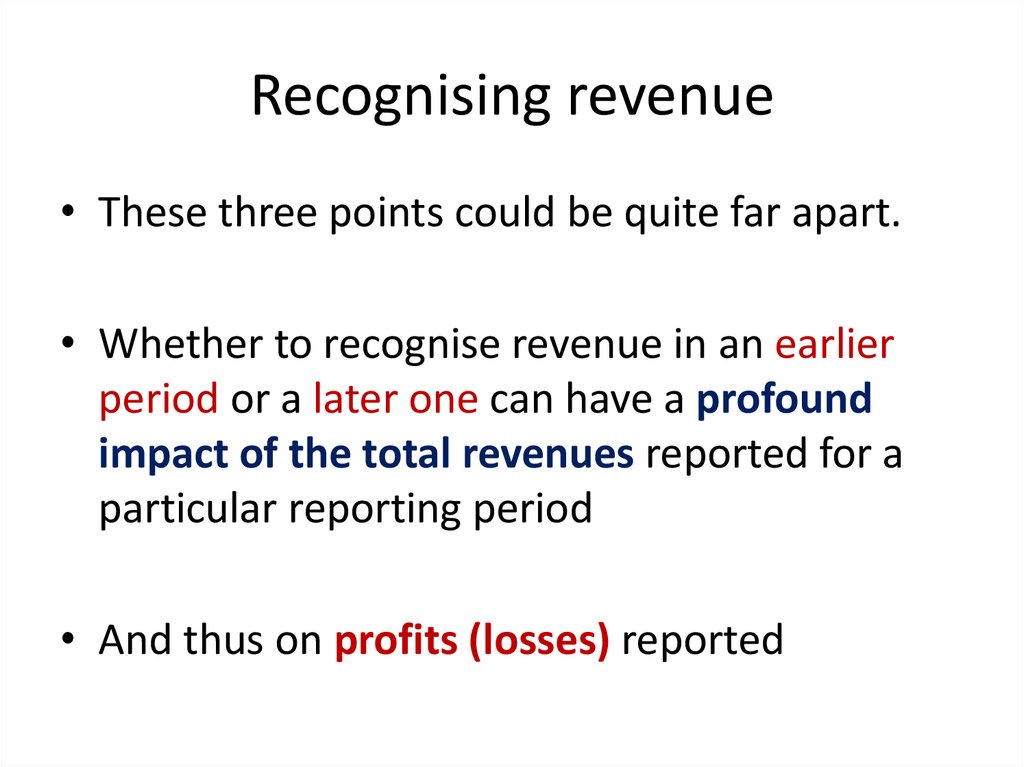
Recognising revenue• These three points could be quite far apart.
• Whether to recognise revenue in an earlier
period or a later one can have a profound
impact of the total revenues reported for a
particular reporting period
• And thus on profits (losses) reported
24.
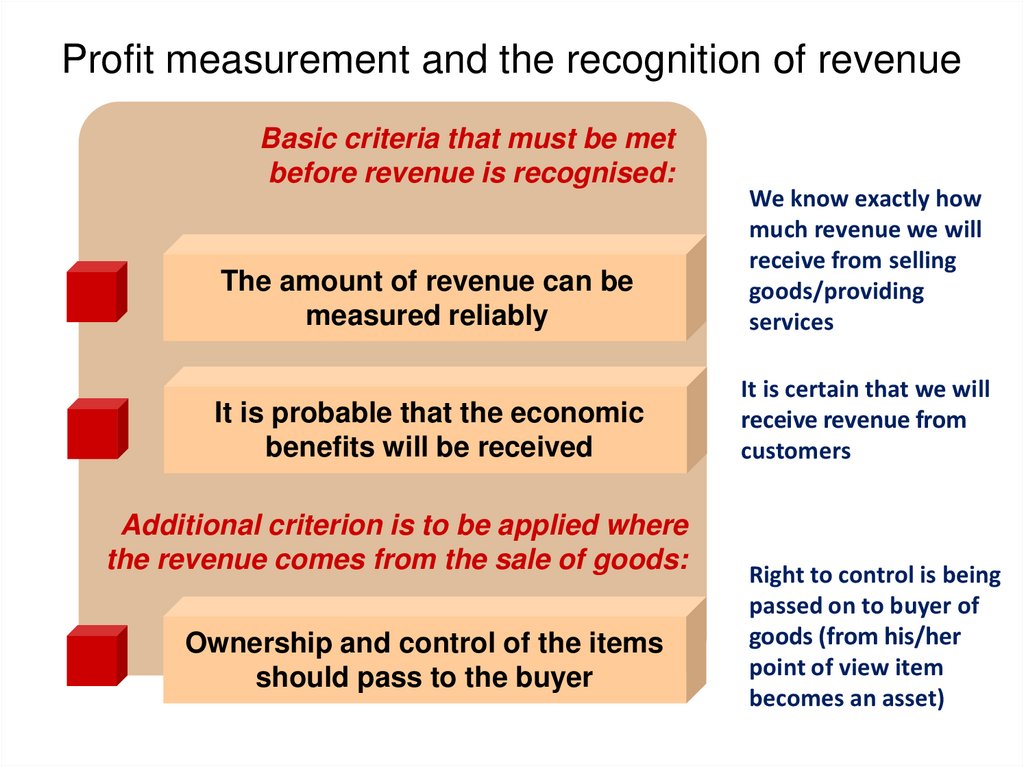
Profit measurement and the recognition of revenueBasic criteria that must be met
before revenue is recognised:
The amount of revenue can be
measured reliably
We know exactly how
much revenue we will
receive from selling
goods/providing
services
It is probable that the economic
benefits will be received
It is certain that we will
receive revenue from
customers
Additional criterion is to be applied where
the revenue comes from the sale of goods:
Ownership and control of the items
should pass to the buyer
Right to control is being
passed on to buyer of
goods (from his/her
point of view item
becomes an asset)
25.
Recognising revenue• Problems arise when revenues and its
expenses stretch over more than one
reporting period
– Revenues from long-contracts
– Revenues from services
26.
Recognising revenue from long-termcontracts
• Contracts can last for more than one reporting period
• If the business waits until the contract is completely
fulfilled before recognising revenue, the income statement
could give a misleading picture of the wealth generated in
the various reporting periods covered by the contract
• Example: construction contract to build a new factory over
three years
– It is possible to recognise revenue before that factory is
completed, provided that the building work can be broken down
into a number of stages and each stage can be measured
reliably
27.
Example: construction contractsStage 1: clearing and levelling the land and putting in the
foundations
Stage 2: building the walls
Stage 3: putting on the roof
Stage 4: putting in the windows and completing all the interior
work
• Each stage can be awarded a separate price with the total
for all the stages being equal to the total contract price for
the factory
• Builder can recognise the price for each completed stage as
revenue and bill the customer accordingly
28.
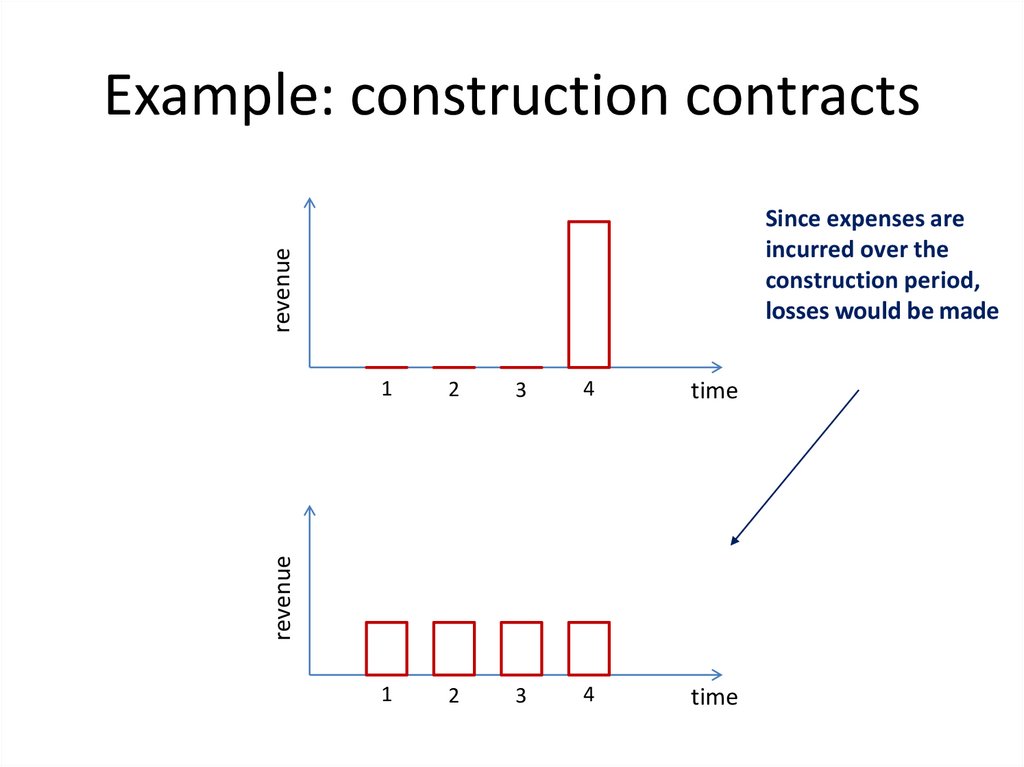
Example: construction contractsrevenue
Since expenses are
incurred over the
construction period,
losses would be made
2
3
4
time
1
2
3
4
time
revenue
1
29.
Recognising revenue from services• Same approach as that used in the construction
contract
• Example: introduction of a new computer system for a
government, which take several years to complete
– Broken down into stages, and each stage can be measured
reliably
• Continuous services
– Benefits from providing the service are usually assumed to
flow evenly over time and so revenue is recognised evenly
over the subscription period
30.
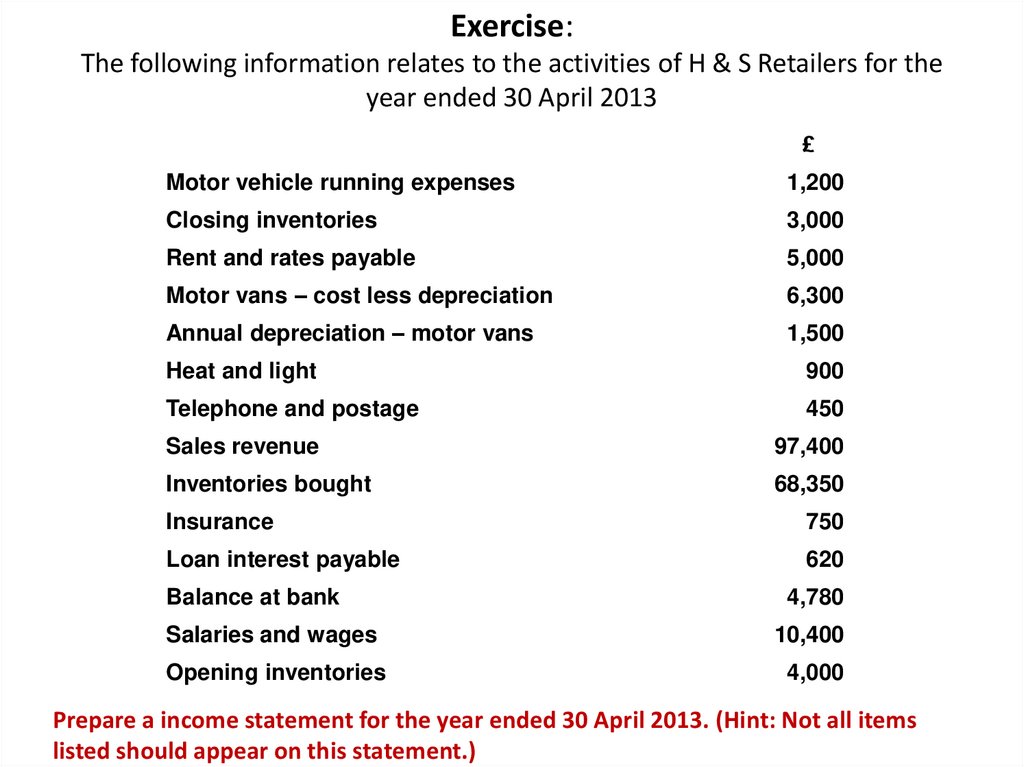
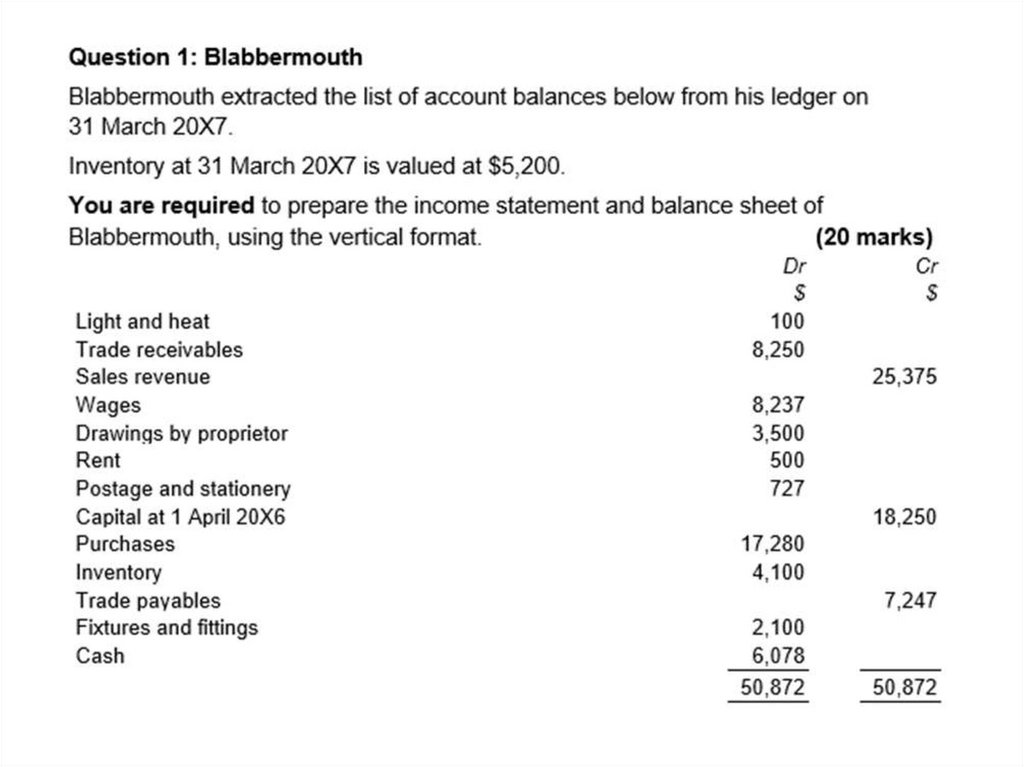
Exercise:The following information relates to the activities of H & S Retailers for the
year ended 30 April 2013
£
Motor vehicle running expenses
1,200
Closing inventories
3,000
Rent and rates payable
5,000
Motor vans – cost less depreciation
6,300
Annual depreciation – motor vans
1,500
Heat and light
900
Telephone and postage
450
Sales revenue
97,400
Inventories bought
68,350
Insurance
750
Loan interest payable
620
Balance at bank
4,780
Salaries and wages
10,400
Opening inventories
4,000
Prepare a income statement for the year ended 30 April 2013. (Hint: Not all items
listed should appear on this statement.)
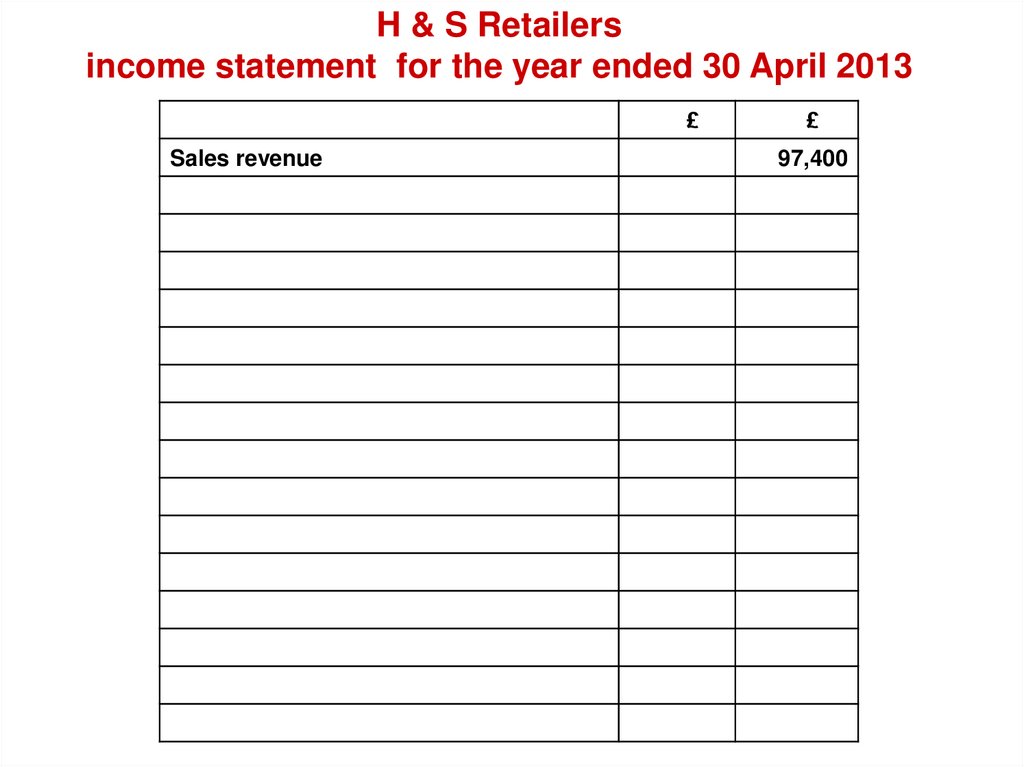
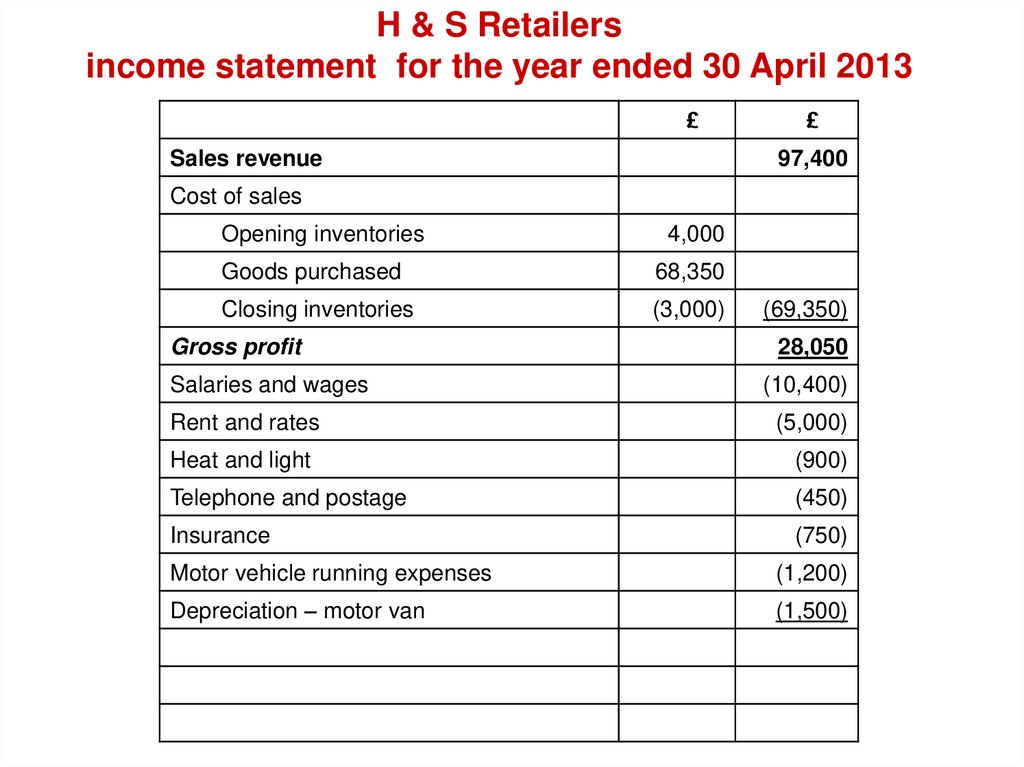
31.
H & S Retailersincome statement for the year ended 30 April 2013
£
£
32.
H & S Retailersincome statement for the year ended 30 April 2013
£
Sales revenue
£
97,400
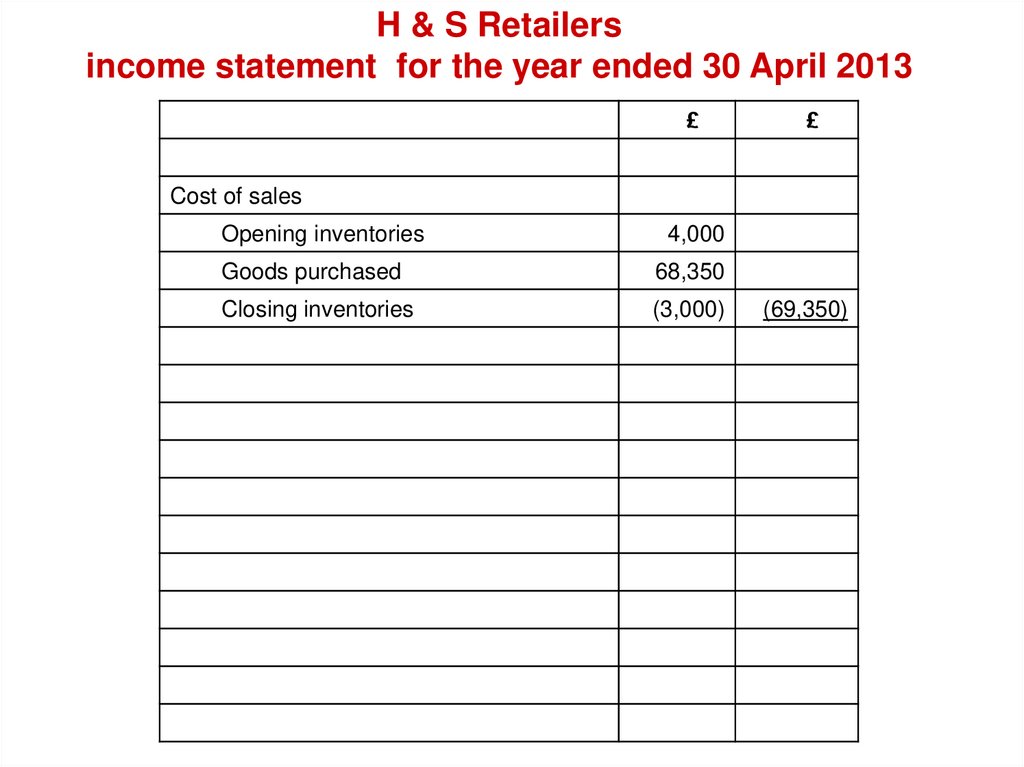
33.
H & S Retailersincome statement for the year ended 30 April 2013
£
£
Cost of sales
Opening inventories
4,000
Goods purchased
68,350
Closing inventories
(3,000)
(69,350)
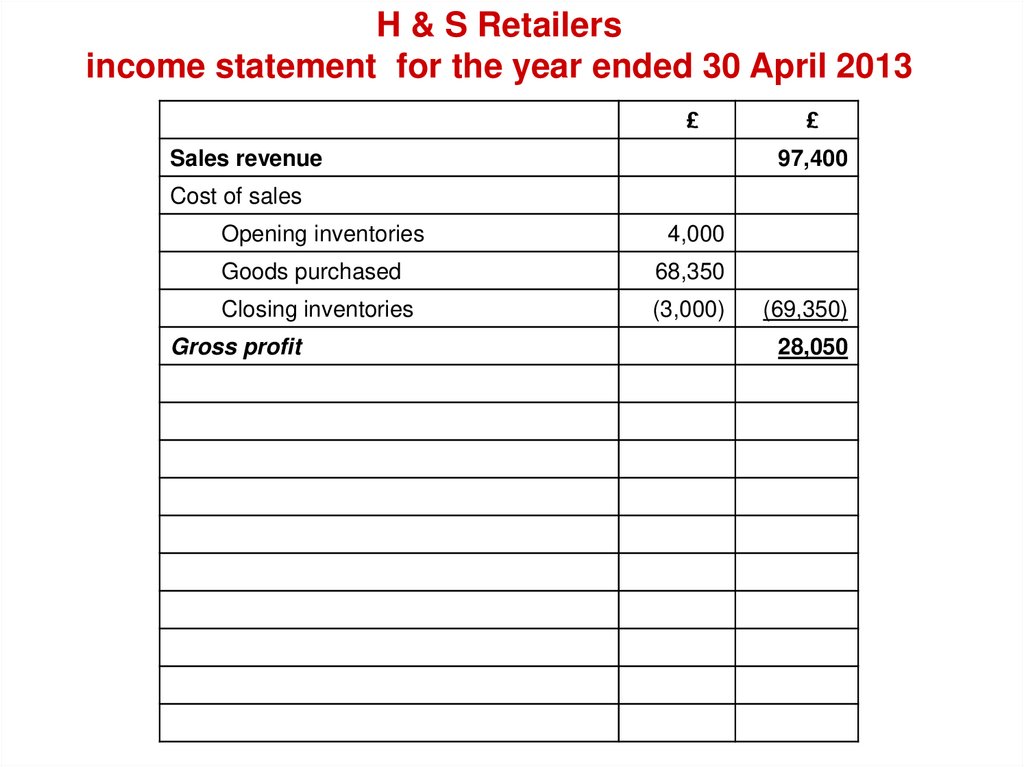
34.
H & S Retailersincome statement for the year ended 30 April 2013
£
Sales revenue
£
97,400
Cost of sales
Opening inventories
4,000
Goods purchased
68,350
Closing inventories
(3,000)
Gross profit
(69,350)
28,050
35.
H & S Retailersincome statement for the year ended 30 April 2013
£
Sales revenue
£
97,400
Cost of sales
Opening inventories
4,000
Goods purchased
68,350
Closing inventories
(3,000)
(69,350)
Gross profit
28,050
Salaries and wages
(10,400)
Rent and rates
(5,000)
Heat and light
(900)
Telephone and postage
(450)
Insurance
(750)
Motor vehicle running expenses
(1,200)
Depreciation – motor van
(1,500)
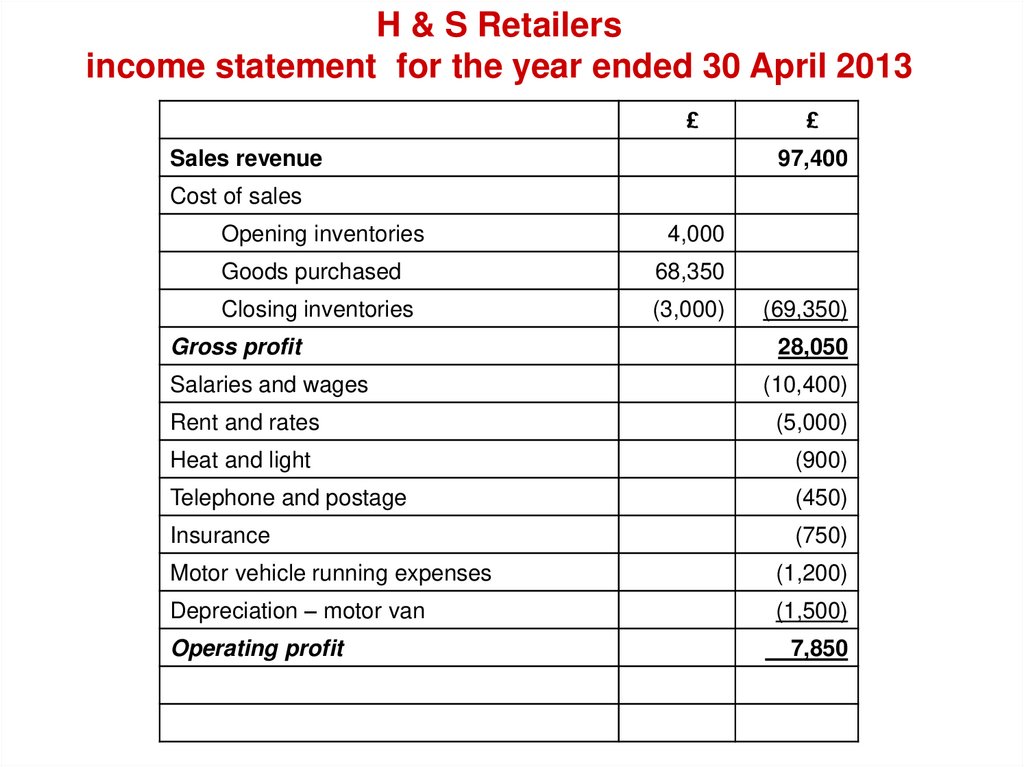
36.
H & S Retailersincome statement for the year ended 30 April 2013
£
Sales revenue
£
97,400
Cost of sales
Opening inventories
4,000
Goods purchased
68,350
Closing inventories
(3,000)
(69,350)
Gross profit
28,050
Salaries and wages
(10,400)
Rent and rates
(5,000)
Heat and light
(900)
Telephone and postage
(450)
Insurance
(750)
Motor vehicle running expenses
(1,200)
Depreciation – motor van
(1,500)
Operating profit
7,850
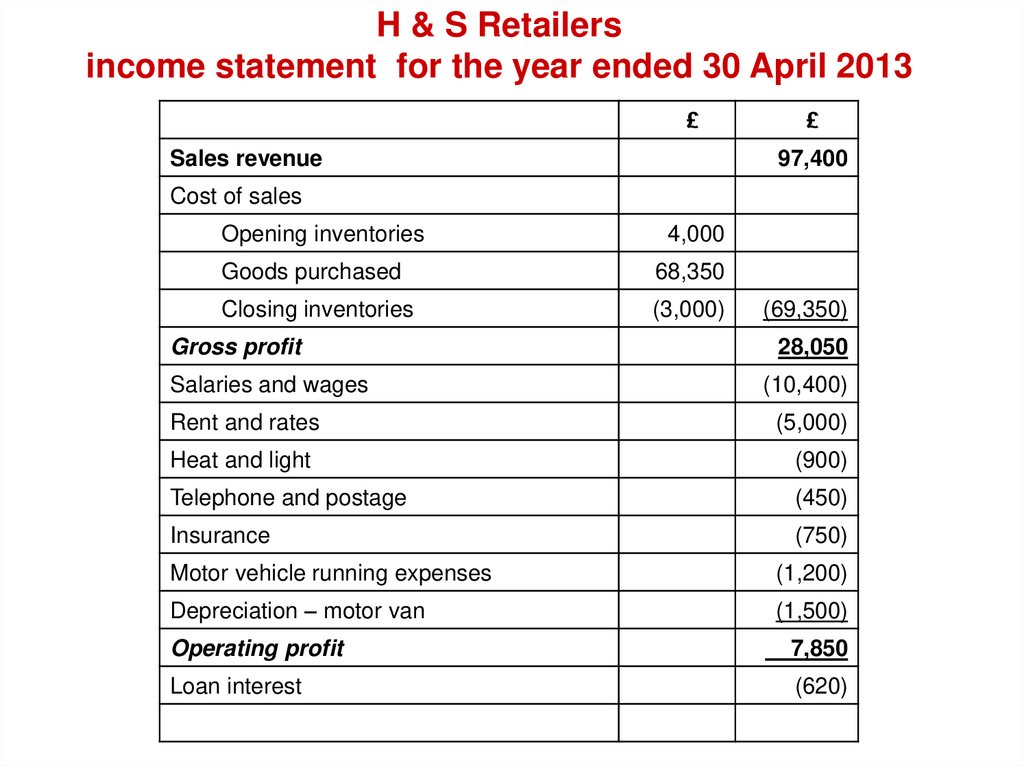
37.
H & S Retailersincome statement for the year ended 30 April 2013
£
Sales revenue
£
97,400
Cost of sales
Opening inventories
4,000
Goods purchased
68,350
Closing inventories
(3,000)
(69,350)
Gross profit
28,050
Salaries and wages
(10,400)
Rent and rates
(5,000)
Heat and light
(900)
Telephone and postage
(450)
Insurance
(750)
Motor vehicle running expenses
(1,200)
Depreciation – motor van
(1,500)
Operating profit
7,850
Loan interest
(620)
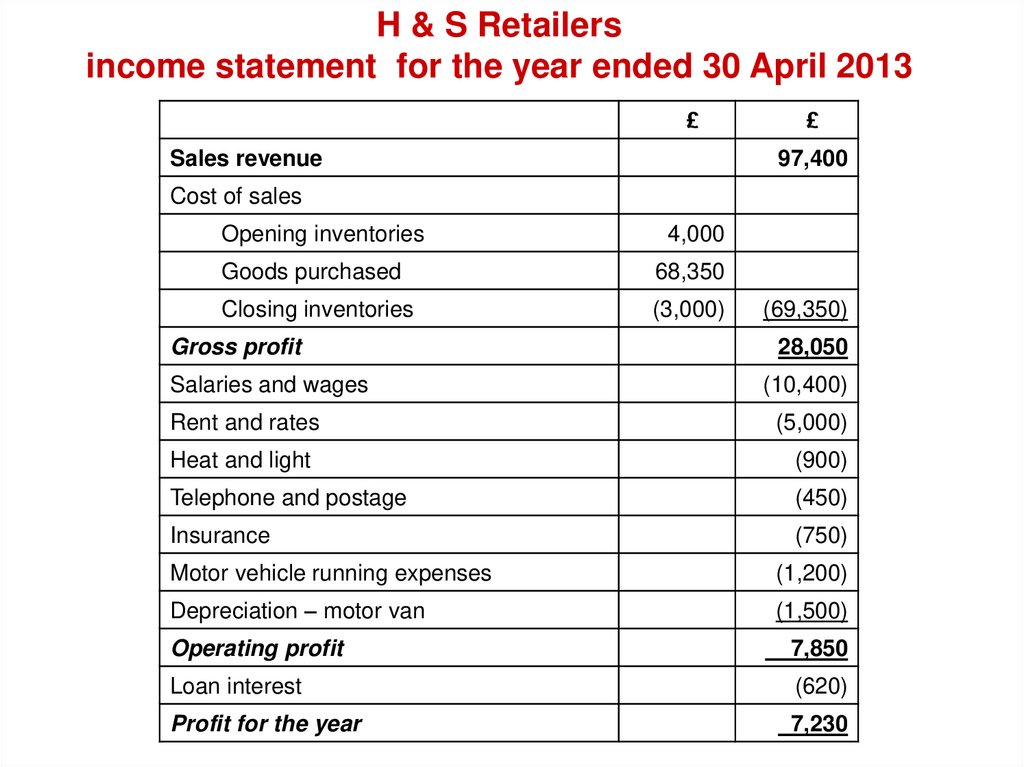
38.
H & S Retailersincome statement for the year ended 30 April 2013
£
Sales revenue
£
97,400
Cost of sales
Opening inventories
4,000
Goods purchased
68,350
Closing inventories
(3,000)
(69,350)
Gross profit
28,050
Salaries and wages
(10,400)
Rent and rates
(5,000)
Heat and light
(900)
Telephone and postage
(450)
Insurance
(750)
Motor vehicle running expenses
(1,200)
Depreciation – motor van
(1,500)
Operating profit
7,850
Loan interest
(620)
Profit for the year
7,230
39.
40.
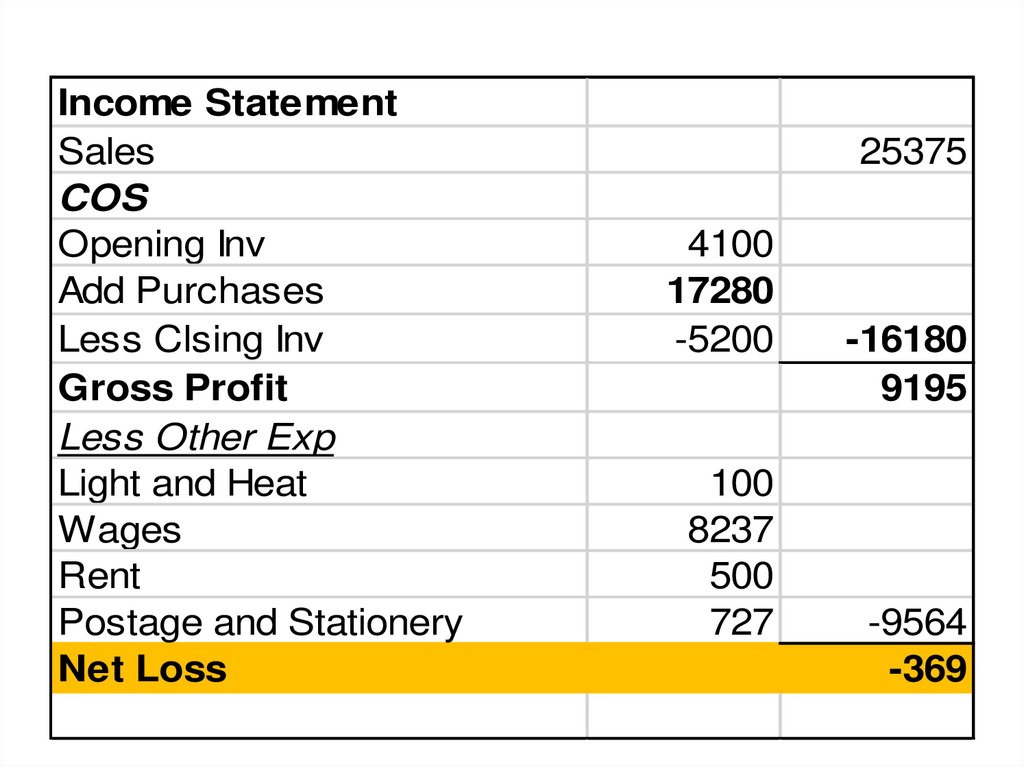
Income StatementSales
COS
Opening Inv
Add Purchases
Less Clsing Inv
Gross Profit
Less Other Exp
Light and Heat
Wages
Rent
Postage and Stationery
Net Loss
25375
4100
17280
-5200
100
8237
500
727
-16180
9195
-9564
-369
41.
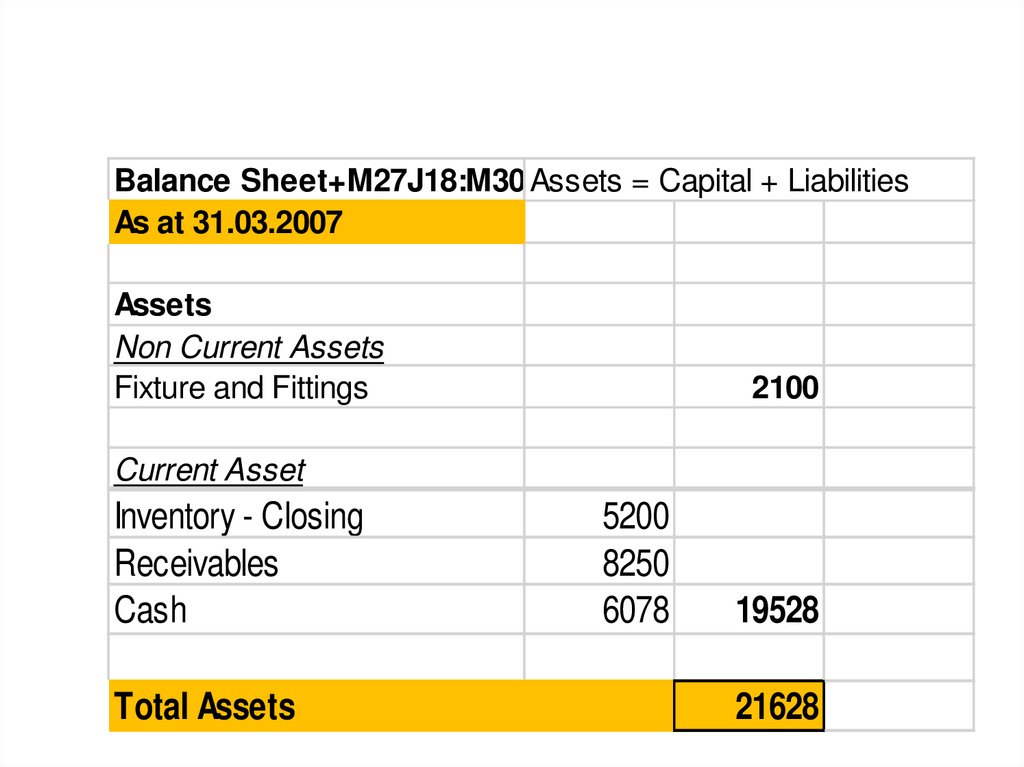
Balance Sheet+M27J18:M30 Assets = Capital + LiabilitiesAs at 31.03.2007
Assets
Non Current Assets
Fixture and Fittings
2100
Current Asset
Inventory - Closing
Receivables
Cash
Total Assets
5200
8250
6078
19528
21628
42.
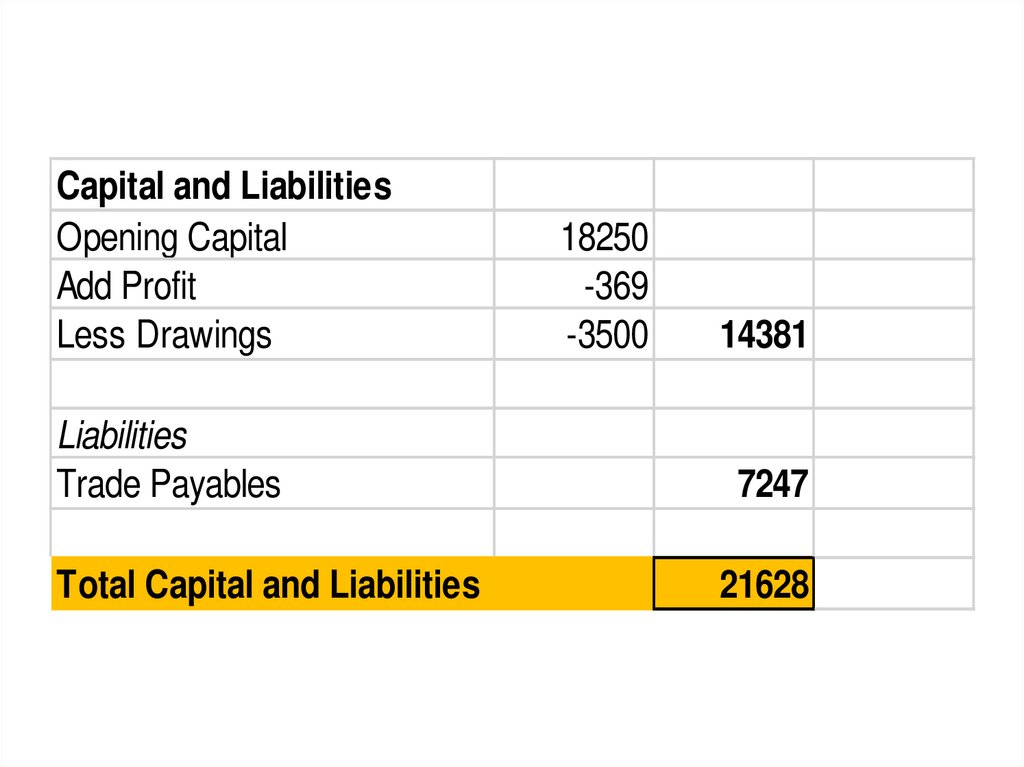
Capital and LiabilitiesOpening Capital
Add Profit
Less Drawings
18250
-369
-3500
14381
Liabilities
Trade Payables
7247
Total Capital and Liabilities
21628
43.
Exercise44.
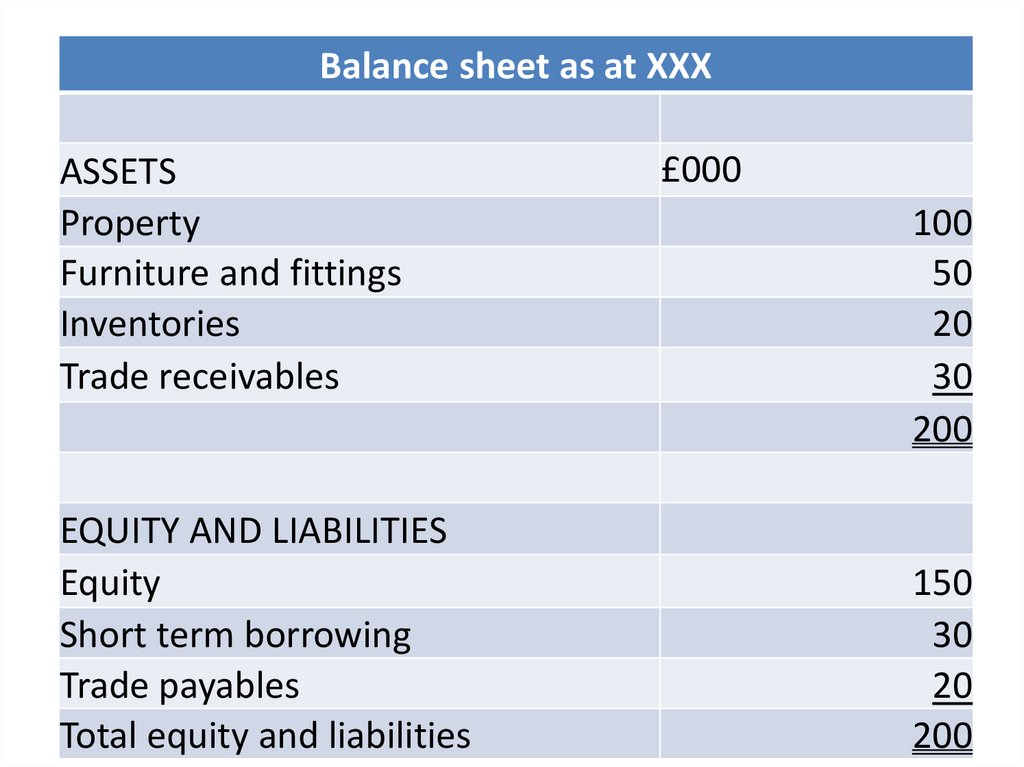
Balance sheet as at XXXASSETS
Property
Furniture and fittings
Inventories
Trade receivables
EQUITY AND LIABILITIES
Equity
Short term borrowing
Trade payables
Total equity and liabilities
£000
100
50
20
30
200
150
30
20
200
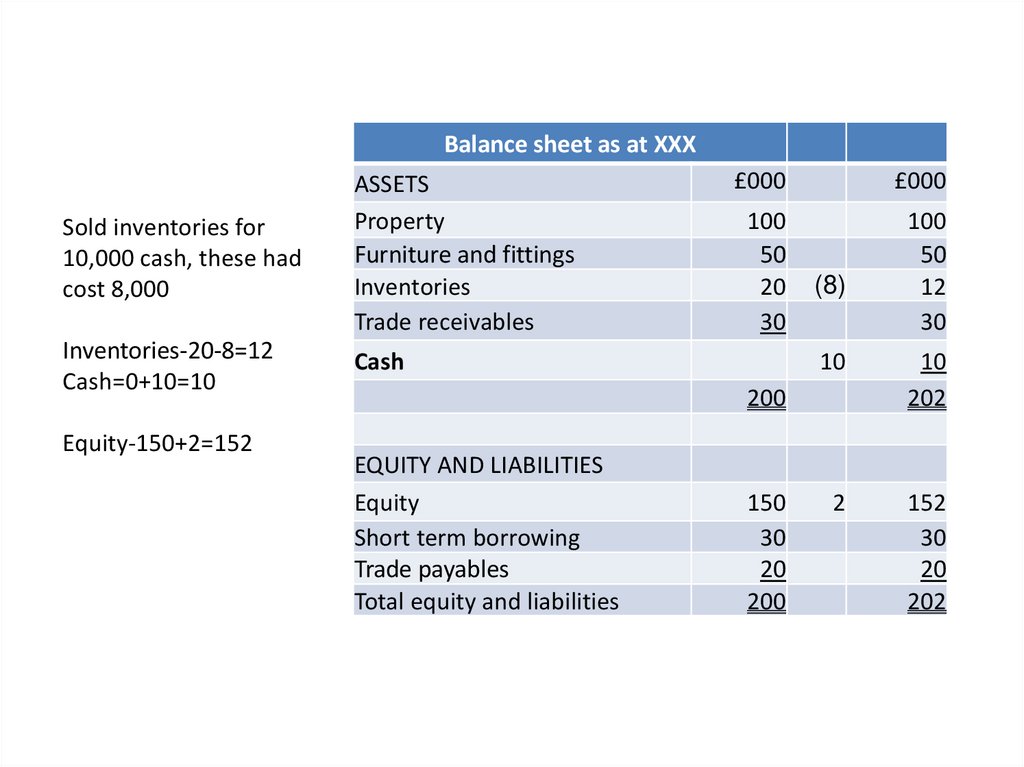
45.
Balance sheet as at XXXSold inventories for
10,000 cash, these had
cost 8,000
ASSETS
Property
Furniture and fittings
Inventories
Trade receivables
Inventories-20-8=12
Cash=0+10=10
Cash
Equity-150+2=152
£000
£000
100
50
20
30
100
50
12
30
(8)
10
10
202
2
152
30
20
202
200
EQUITY AND LIABILITIES
Equity
Short term borrowing
Trade payables
Total equity and liabilities
150
30
20
200
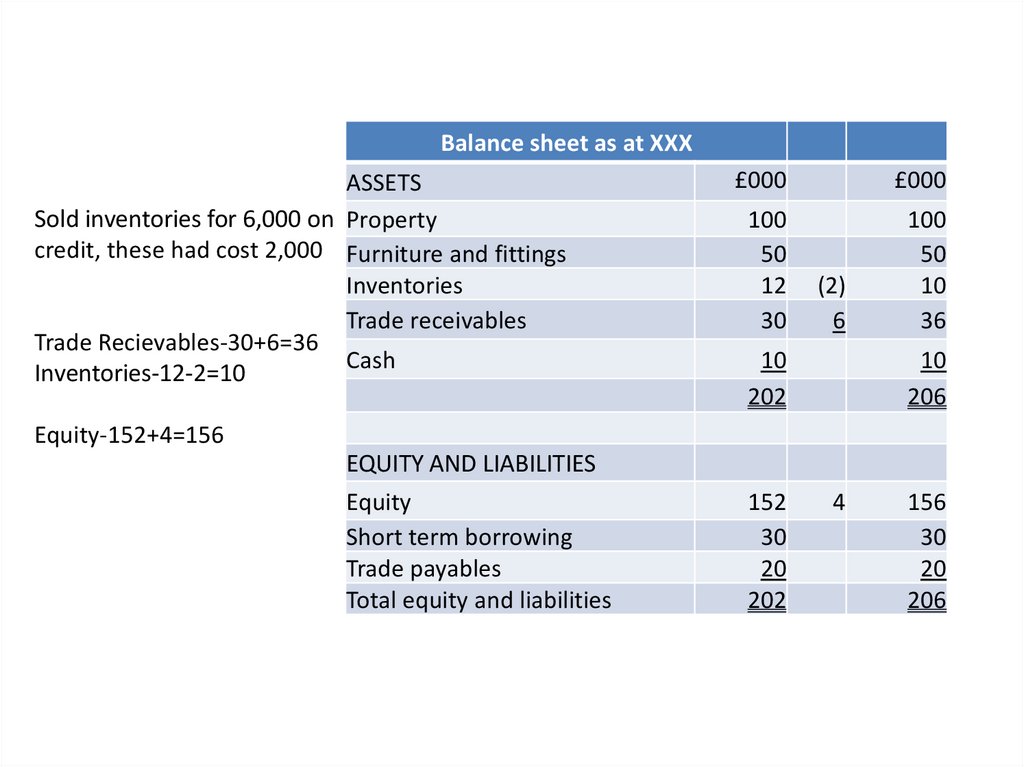
46.
Balance sheet as at XXXASSETS
Sold inventories for 6,000 on Property
credit, these had cost 2,000 Furniture and fittings
Inventories
Trade receivables
Trade Recievables-30+6=36
Cash
Inventories-12-2=10
£000
£000
100
50
12
30
100
50
10
36
(2)
6
10
202
10
206
Equity-152+4=156
EQUITY AND LIABILITIES
Equity
Short term borrowing
Trade payables
Total equity and liabilities
152
30
20
202
4
156
30
20
206
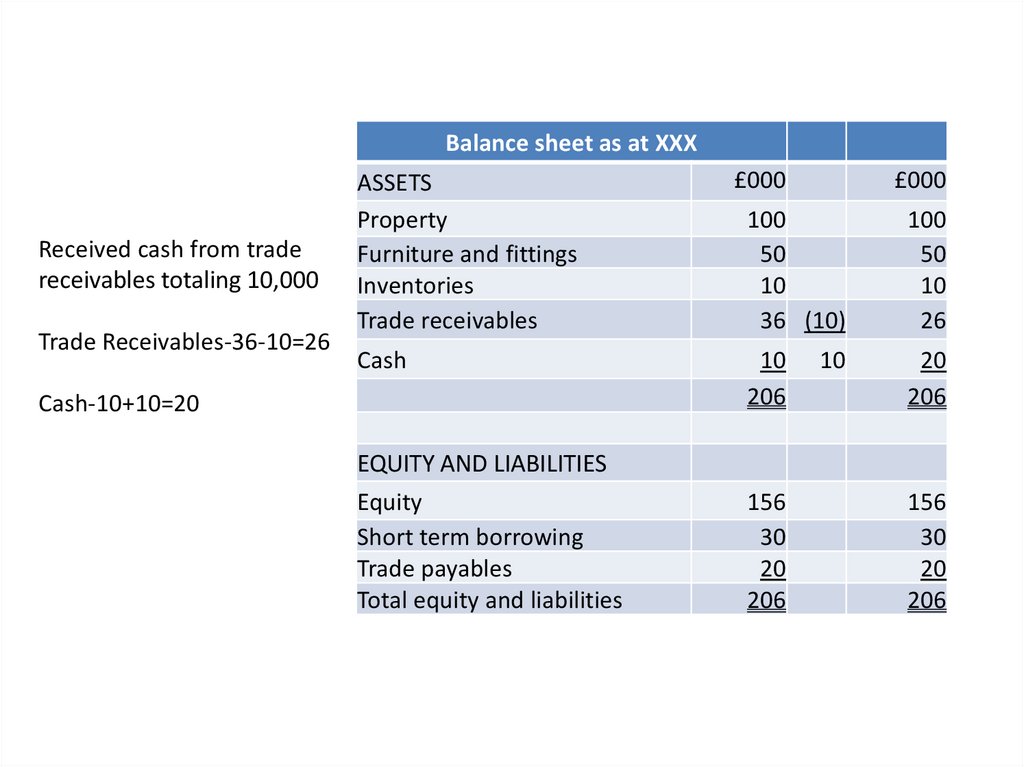
47.
Balance sheet as at XXXReceived cash from trade
receivables totaling 10,000
Trade Receivables-36-10=26
ASSETS
Property
Furniture and fittings
Inventories
Trade receivables
£000
£000
100
50
10
36 (10)
100
50
10
26
Cash
10
206
20
206
Cash-10+10=20
EQUITY AND LIABILITIES
Equity
Short term borrowing
Trade payables
Total equity and liabilities
156
30
20
206
10
156
30
20
206
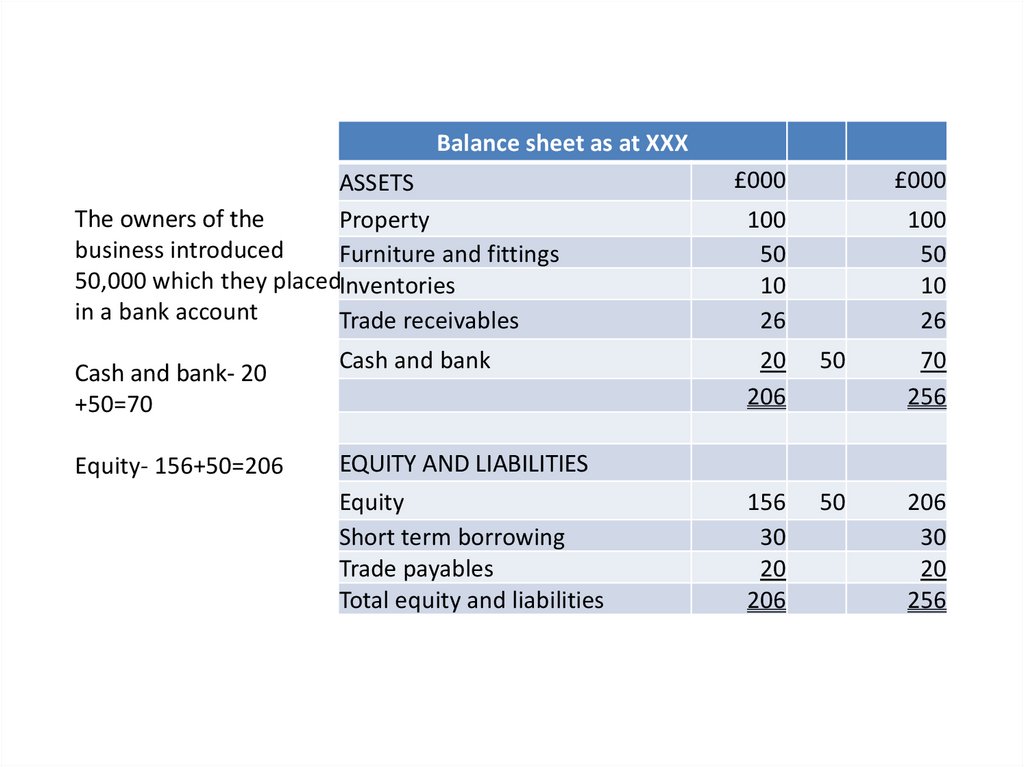
48.
Balance sheet as at XXXASSETS
The owners of the
Property
business introduced
Furniture and fittings
50,000 which they placedInventories
in a bank account
Trade receivables
Cash and bank- 20
+50=70
Equity- 156+50=206
Cash and bank
EQUITY AND LIABILITIES
Equity
Short term borrowing
Trade payables
Total equity and liabilities
£000
£000
100
50
10
26
100
50
10
26
20
206
50
70
256
156
30
20
206
50
206
30
20
256
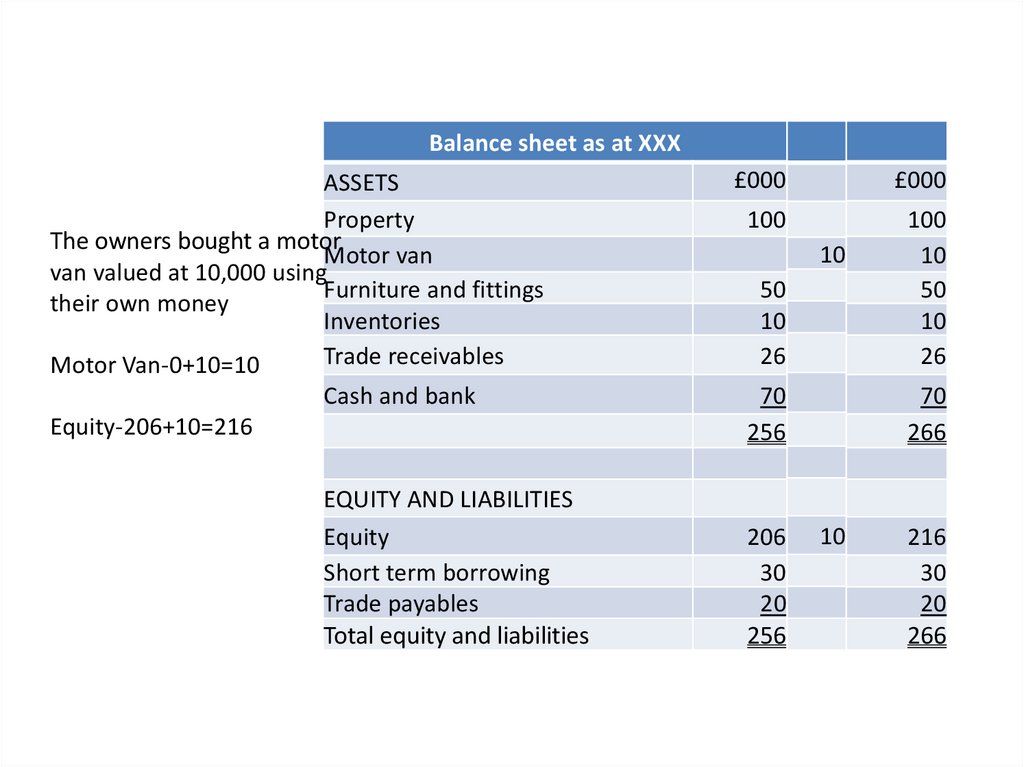
49.
Balance sheet as at XXXASSETS
Property
The owners bought a motor
Motor van
van valued at 10,000 using
Furniture and fittings
their own money
Inventories
Trade receivables
Motor Van-0+10=10
Cash and bank
Equity-206+10=216
EQUITY AND LIABILITIES
Equity
Short term borrowing
Trade payables
Total equity and liabilities
£000
£000
100
50
10
26
100
10
50
10
26
70
256
70
266
10
206
30
20
256
10
216
30
20
266
50.
Balance sheet as at XXXASSETS
Property
Bought inventories on credit Motor van
Furniture and fittings
for 14,000
Inventories
Trade receivables
Inventories-10+14=24
Trade Payables- 20+14=34
Cash and bank
EQUITY AND LIABILITIES
Equity
Short term borrowing
Trade payables
Total equity and liabilities
£000
£000
100
10
50
10
26
100
10
50
24
26
14
70
266
70
280
216
30
20
266
216
30
34
280
14
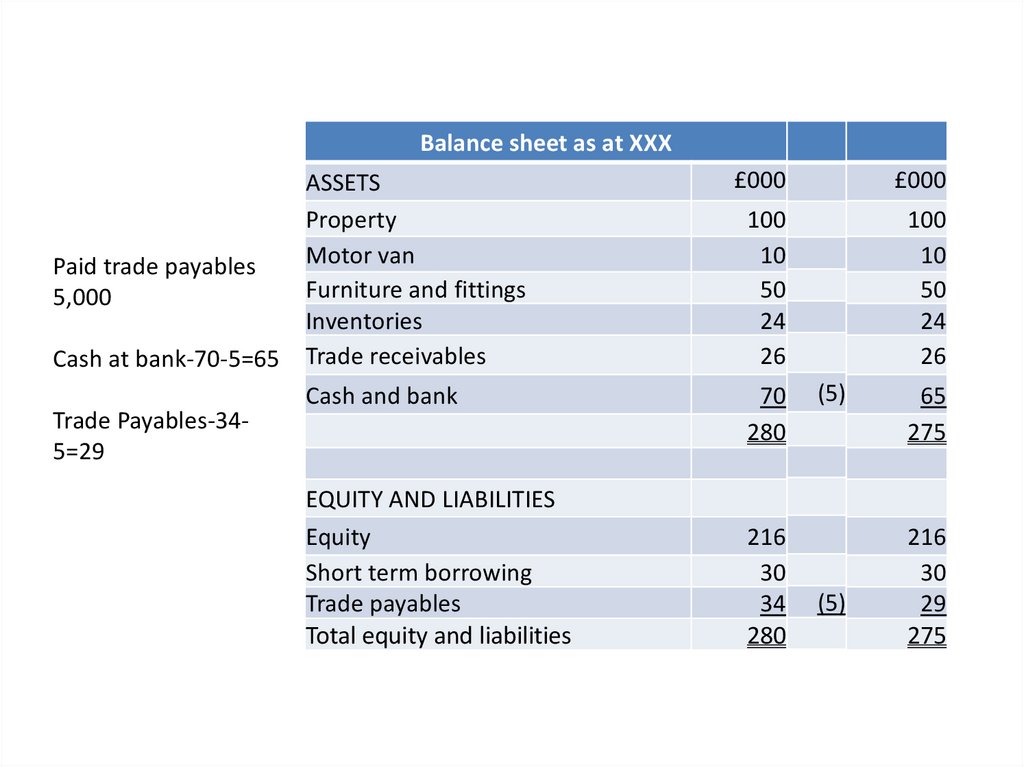
51.
Balance sheet as at XXXPaid trade payables
5,000
Cash at bank-70-5=65
Trade Payables-345=29
ASSETS
Property
Motor van
Furniture and fittings
Inventories
Trade receivables
£000
£000
100
10
50
24
26
100
10
50
24
26
Cash and bank
70
280
EQUITY AND LIABILITIES
Equity
Short term borrowing
Trade payables
Total equity and liabilities
216
30
34
280
(5)
(5)
65
275
216
30
29
275
52.
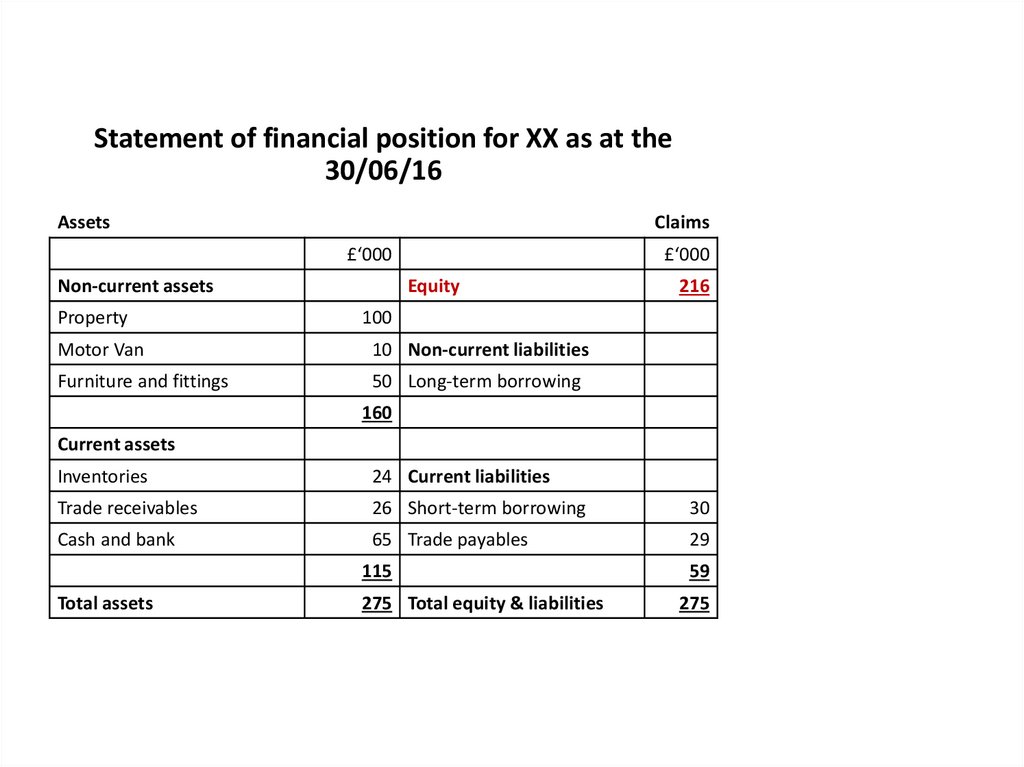
Statement of financial position for XX as at the30/06/16
Assets
Claims
£‘000
Non-current assets
£‘000
Equity
Property
100
Motor Van
10 Non-current liabilities
Furniture and fittings
50 Long-term borrowing
216
160
Current assets
Inventories
24 Current liabilities
Trade receivables
26 Short-term borrowing
30
Cash and bank
65 Trade payables
29
115
59
275 Total equity & liabilities
275
Total assets