


Similar presentations:
")


HP Network Visualizer SDN Application
1.
Lecture 4HP Network
Visualizer SDN
1
2.
Objectives1. HP Network Visualizer SDN benefits
2. Install and configure the HP Network
Visualizer SDN
3. . Create capture sessions using the Create
Capture Session wizard
4. Integrate HP Network Visualizer SDN with
HP switches
5. Active Directory integration
2
3.
HP NetworkVisualizer SDN
1. HP Network Visualizer
SDN benefits
3
4.
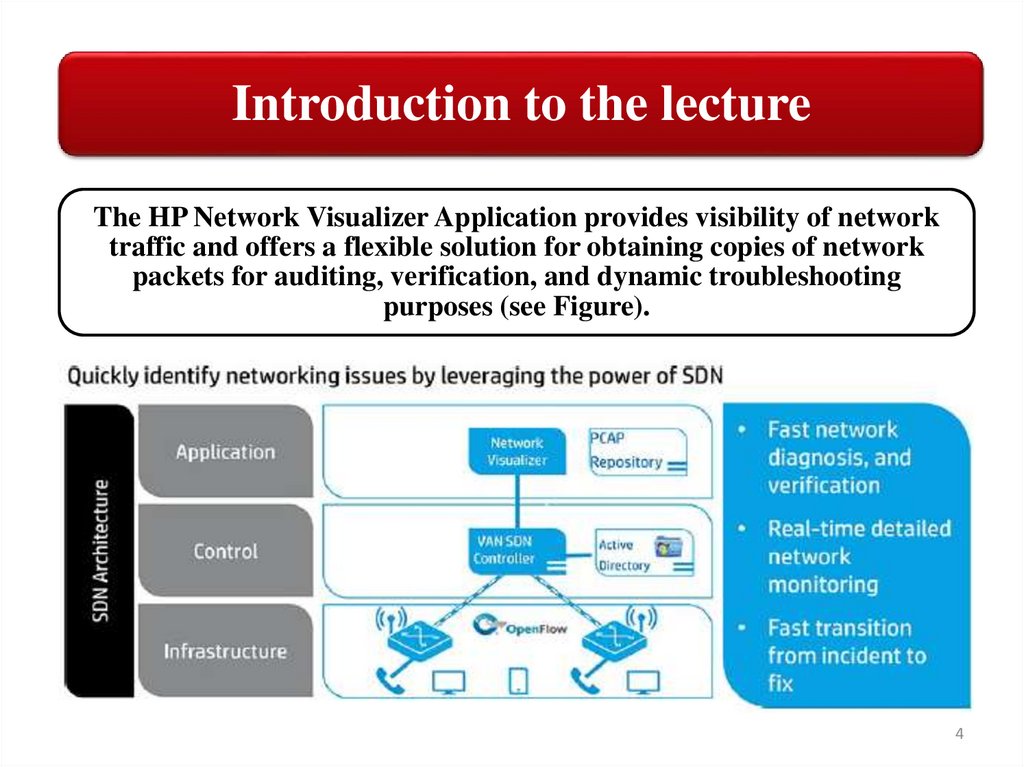
Introduction to the lectureThe HP Network Visualizer Application provides visibility of network
traffic and offers a flexible solution for obtaining copies of network
packets for auditing, verification, and dynamic troubleshooting
purposes (see Figure).
4
5.
Introduction to the lectureThe Network Visualizer application is installed on the HP
Controller and can dynamically forward traffic to a
monitoring device located in either an OpenFlow or nonOpenFlow-enabled network.
The network monitoring device could even be separated from
the monitored devices by a wide area network (WAN). This
would require enough bandwidth for captured traffic, IP
connectivity from the OpenFlow-enabled switch to the capture
device, and Generic Routing Encapsulation (GRE) tunnels
permitted by firewalls.
Automatic captures can be scheduled to take place at specific
times in the future.
5
6.
Introduction to the lectureYou can get copies of network packets from multiple source devices and forward
captured packets to a collection device located almost anywhere in the network
using a GRE tunnel.
Network Visualizer dynamically installs OpenFlow rules to monitor the network
traffic using the filter criteria specified by the network administrator via the
graphical user interface (GUI). Filter criteria is specified with SDN policy
attributes built on access control list (ACL) networking match attributes and
legacy actions.
The SDN policy attributes are the
following:
• Users
• User devices
• Location
• Application
• Status of network
• Time
The Network Visualizer obtains the integration information on user devices from
HP VAN SDN Controller.
6
7.
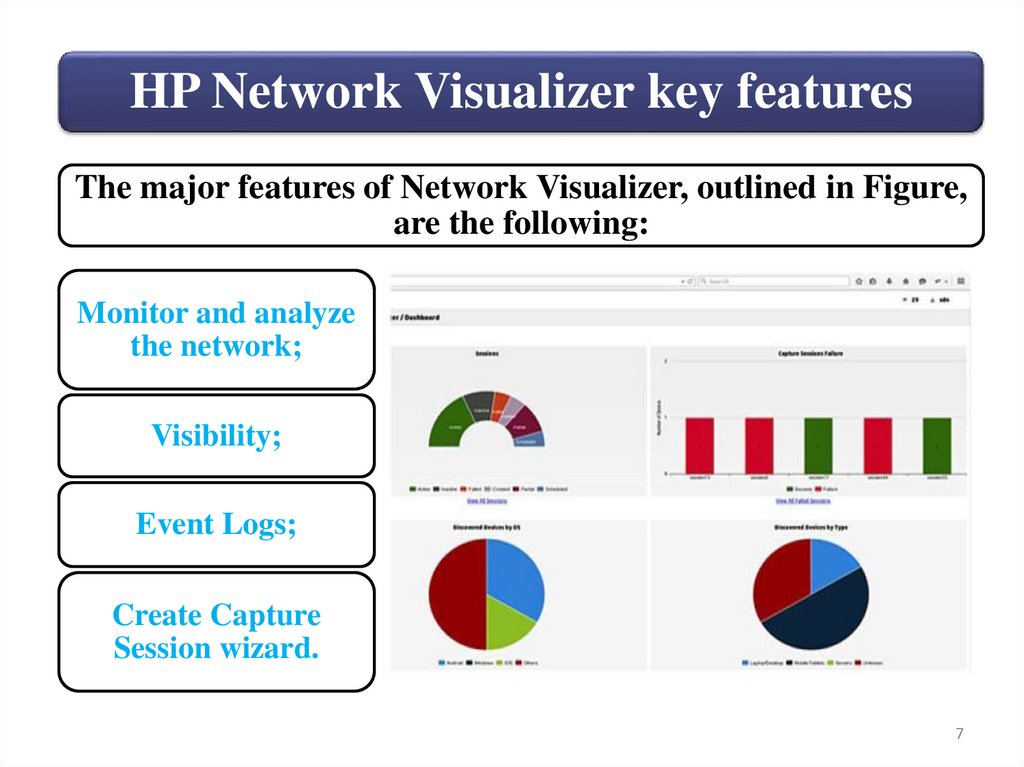
HP Network Visualizer key featuresThe major features of Network Visualizer, outlined in Figure,
are the following:
Monitor and analyze
the network;
Visibility;
Event Logs;
Create Capture
Session wizard.
7
8.
HP Network Visualizer key featuresMonitor and analyze the network: You can narrow down the source of
network problems, know the traffic peaks from any network device, and
validate network connectivity.
Visibility: The Network Visualizer
uses tshark for providing network
visibility by capturing session
activity, status, and summary
information. A combination of the
following features provides network
visibility:
• Client address identification
• GUI-based real-time
monitoring of captured packets
• Dashboard charts
• Detailed capture session view
Network visibility ensures that a given capture session is functional on a
per network device basis. If not functional, the reason for capture session
failure is noted.
You can view the most recent 100 packets in the packet capture (pcap)
file for a session. To view all of the packets and to analyze the packets,
open the pcap file in tshark.
8
9.
Event Logs:The network visibility and monitoring tool must be
reliable and provide good debugging abilities.
Event logs are a primary source of debug information.
For example, if a capture session is active and no
packet is captured, the network administrator must be
informed that there is no matching traffic sent from the
monitored source.
The event log captures the source and reason for
capture failure. The event log retains the event entries
for 180 days. The Network Visualizer generates an alert
when the event log is purged by the network
administrator or the system.
9
10.
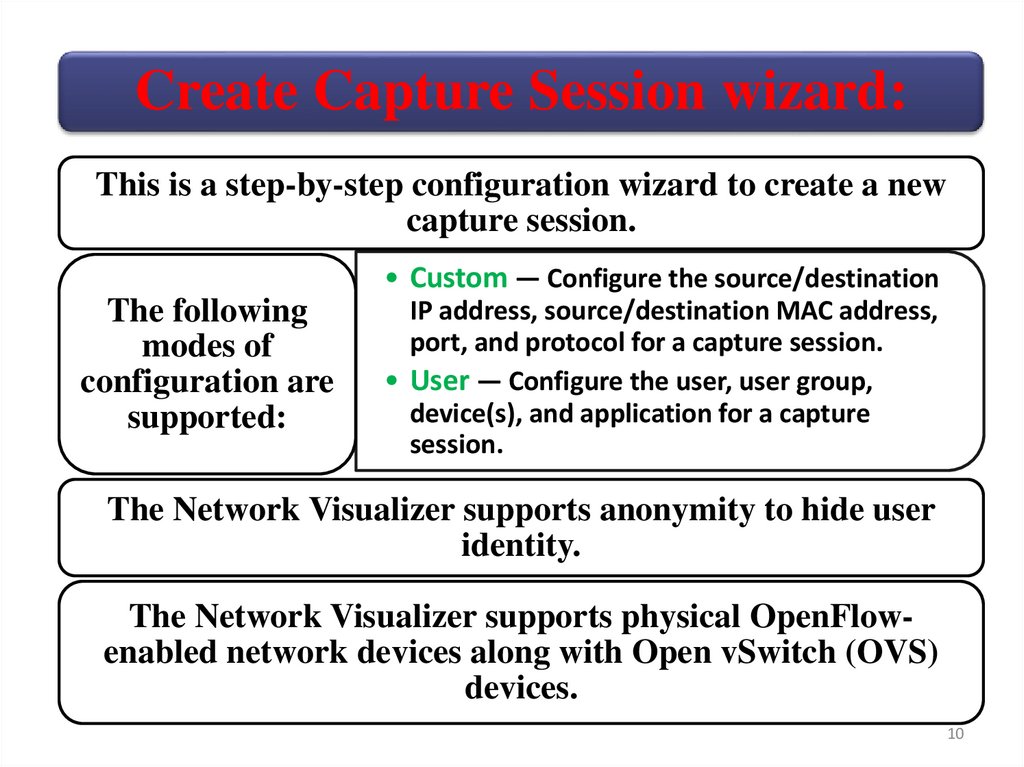
Create Capture Session wizard:This is a step-by-step configuration wizard to create a new
capture session.
• Custom — Configure the source/destination
The following
modes of
configuration are
supported:
IP address, source/destination MAC address,
port, and protocol for a capture session.
• User — Configure the user, user group,
device(s), and application for a capture
session.
The Network Visualizer supports anonymity to hide user
identity.
The Network Visualizer supports physical OpenFlowenabled network devices along with Open vSwitch (OVS)
devices.
10
11.
HP NetworkVisualizer SDN
2. Install and configure the HP
Network Visualizer SDN
11
12.
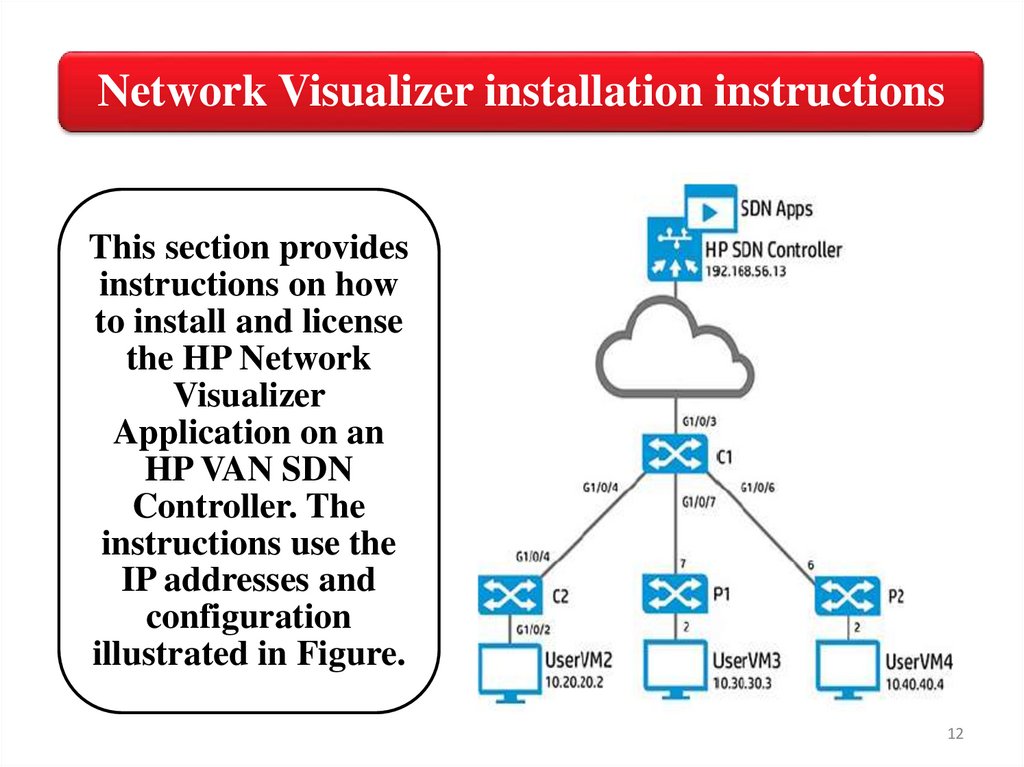
Network Visualizer installation instructionsThis section provides
instructions on how
to install and license
the HP Network
Visualizer
Application on an
HP VAN SDN
Controller. The
instructions use the
IP addresses and
configuration
illustrated in Figure.
12
13.
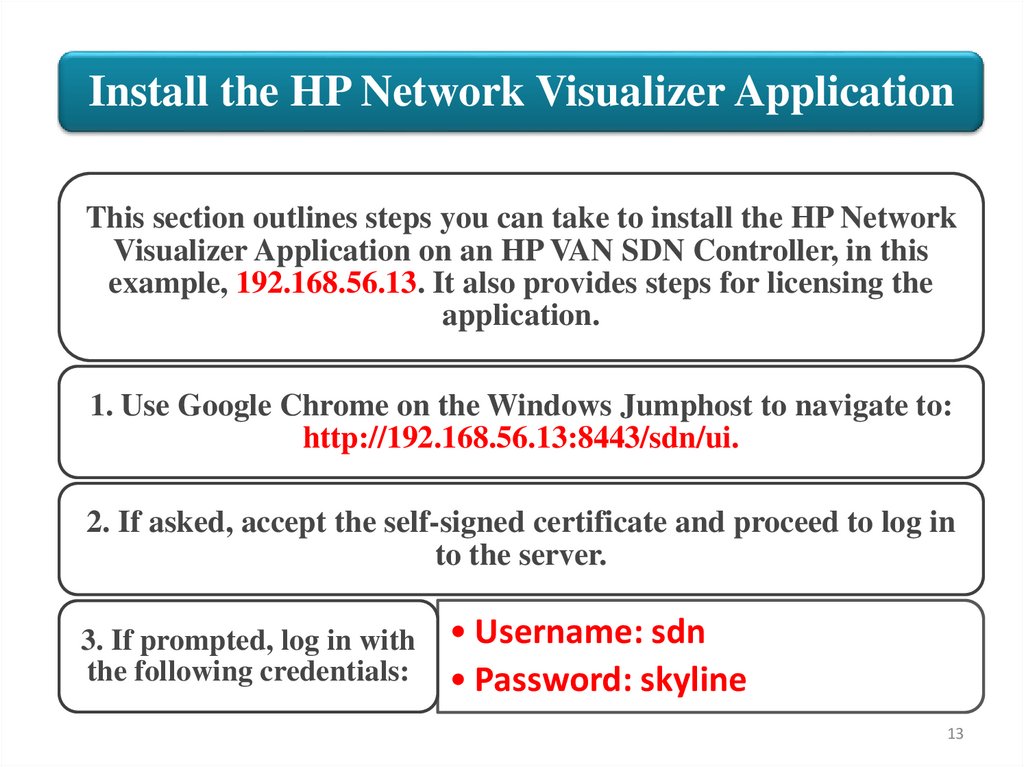
Install the HP Network Visualizer ApplicationThis section outlines steps you can take to install the HP Network
Visualizer Application on an HP VAN SDN Controller, in this
example, 192.168.56.13. It also provides steps for licensing the
application.
1. Use Google Chrome on the Windows Jumphost to navigate to:
http://192.168.56.13:8443/sdn/ui.
2. If asked, accept the self-signed certificate and proceed to log in
to the server.
3. If prompted, log in with
the following credentials:
• Username: sdn
• Password: skyline
13
14.
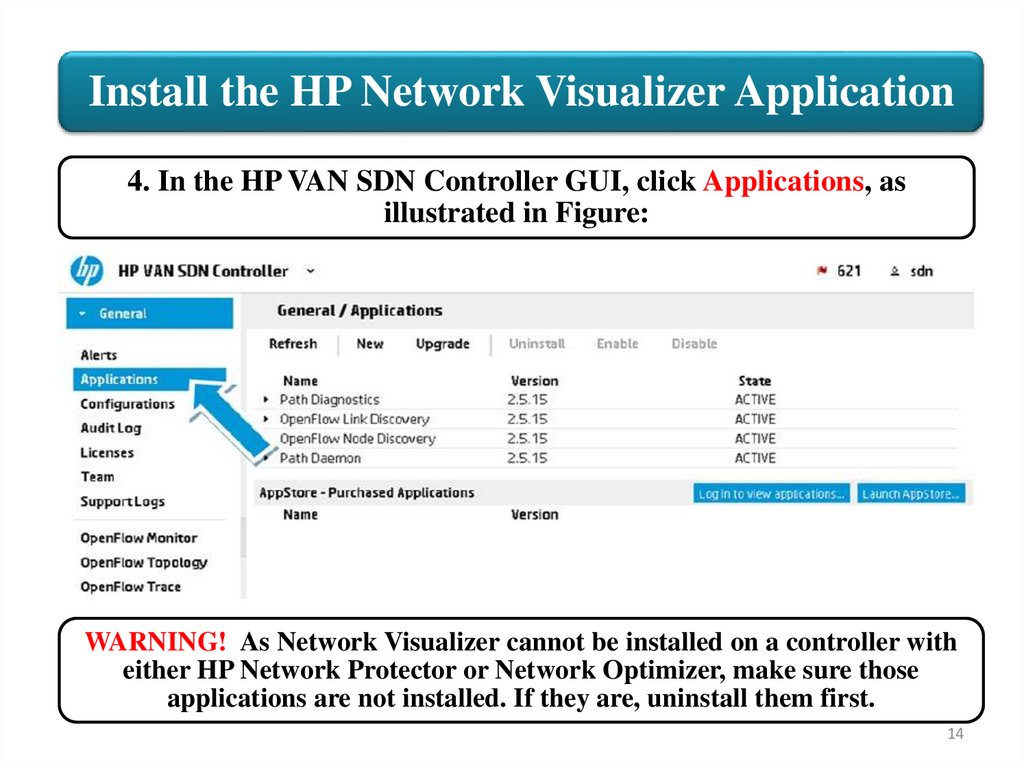
Install the HP Network Visualizer Application4. In the HP VAN SDN Controller GUI, click Applications, as
illustrated in Figure:
WARNING! As Network Visualizer cannot be installed on a controller with
either HP Network Protector or Network Optimizer, make sure those
applications are not installed. If they are, uninstall them first.
14
15.
Install the HP Network Visualizer Application5. You need to install the HP Network Visualizer manually if you
have no Internet access. If you have Internet access, you can
install the application directly from the HP App Store.
6. Click New, as illustrated in Figure:
15
16.
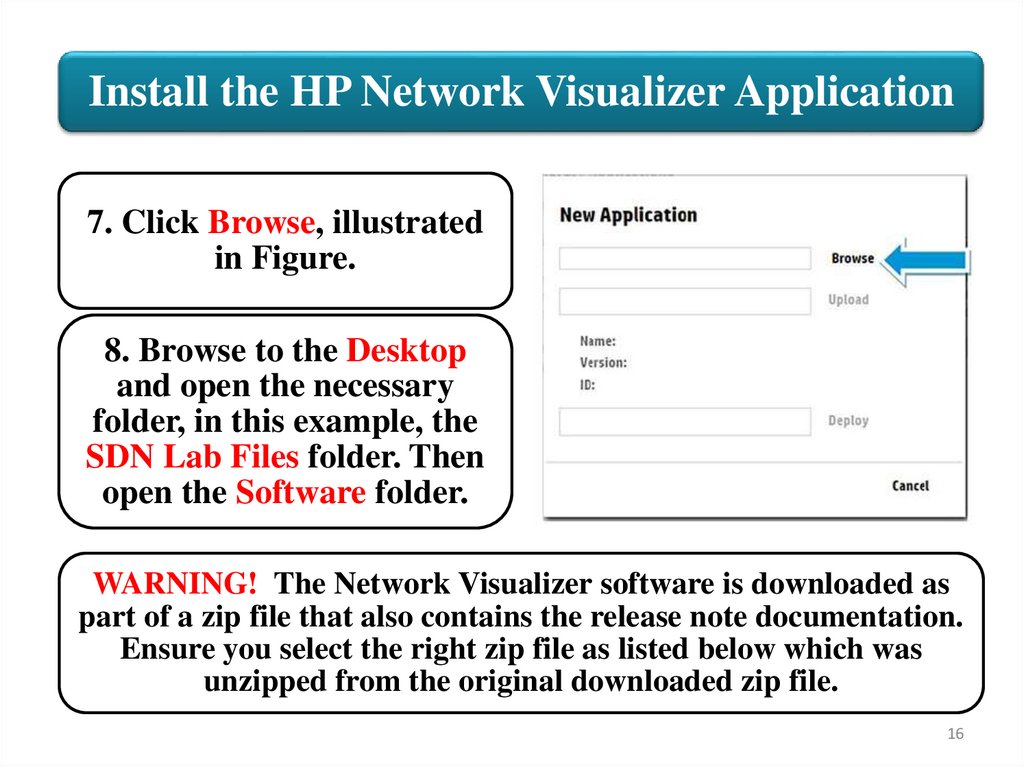
Install the HP Network Visualizer Application7. Click Browse, illustrated
in Figure.
8. Browse to the Desktop
and open the necessary
folder, in this example, the
SDN Lab Files folder. Then
open the Software folder.
WARNING! The Network Visualizer software is downloaded as
part of a zip file that also contains the release note documentation.
Ensure you select the right zip file as listed below which was
unzipped from the original downloaded zip file.
16
17.
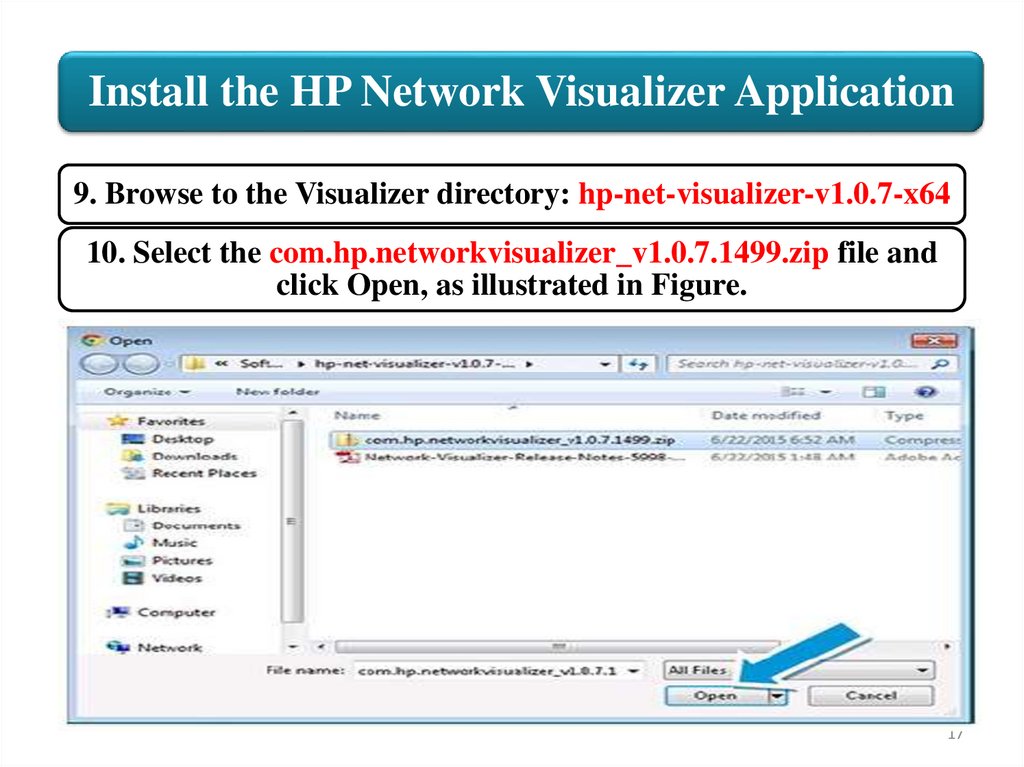
Install the HP Network Visualizer Application9. Browse to the Visualizer directory: hp-net-visualizer-v1.0.7-x64
10. Select the com.hp.networkvisualizer_v1.0.7.1499.zip file and
click Open, as illustrated in Figure.
17
18.
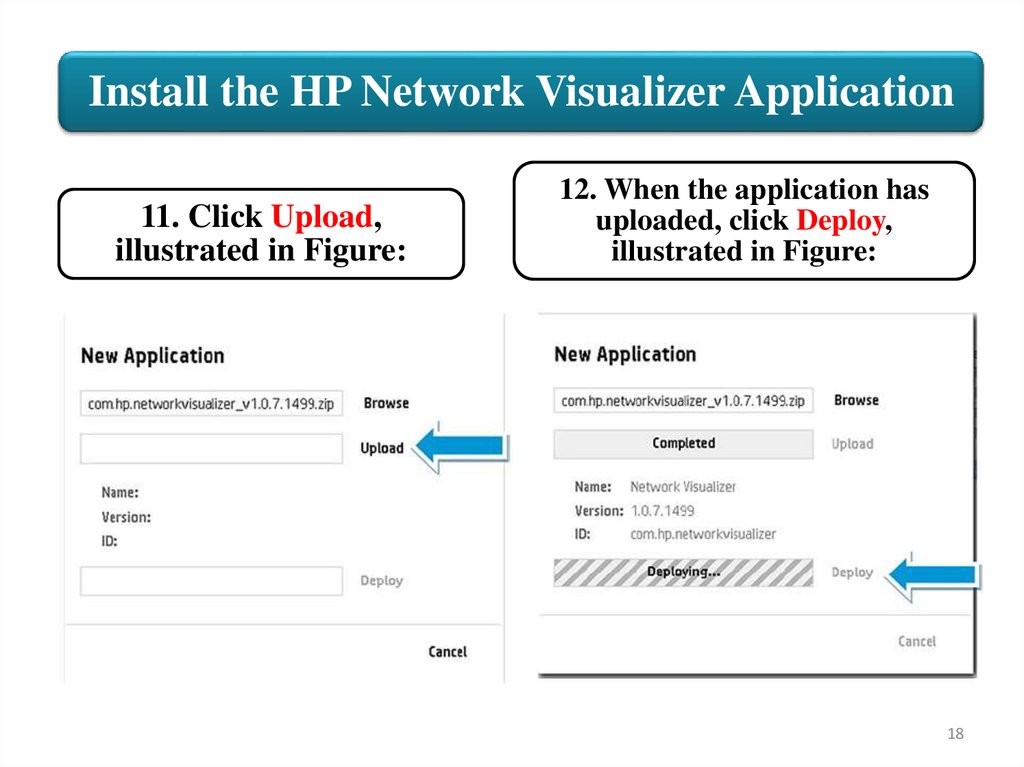
Install the HP Network Visualizer Application11. Click Upload,
illustrated in Figure:
12. When the application has
uploaded, click Deploy,
illustrated in Figure:
18
19.
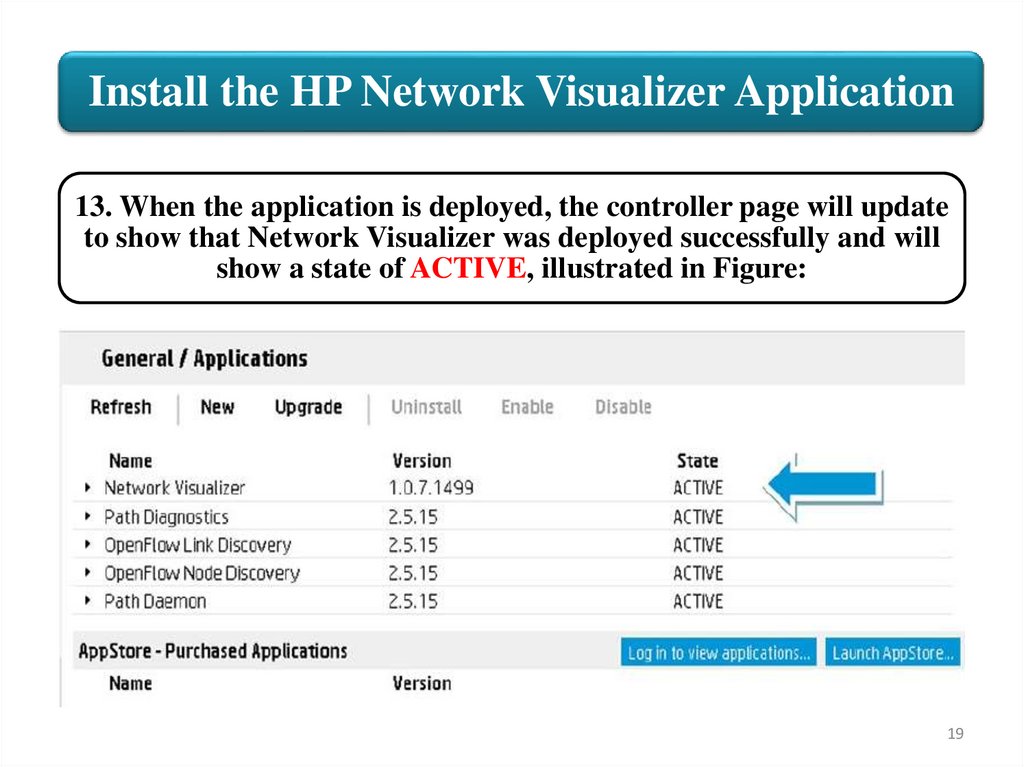
Install the HP Network Visualizer Application13. When the application is deployed, the controller page will update
to show that Network Visualizer was deployed successfully and will
show a state of ACTIVE, illustrated in Figure:
19
20.
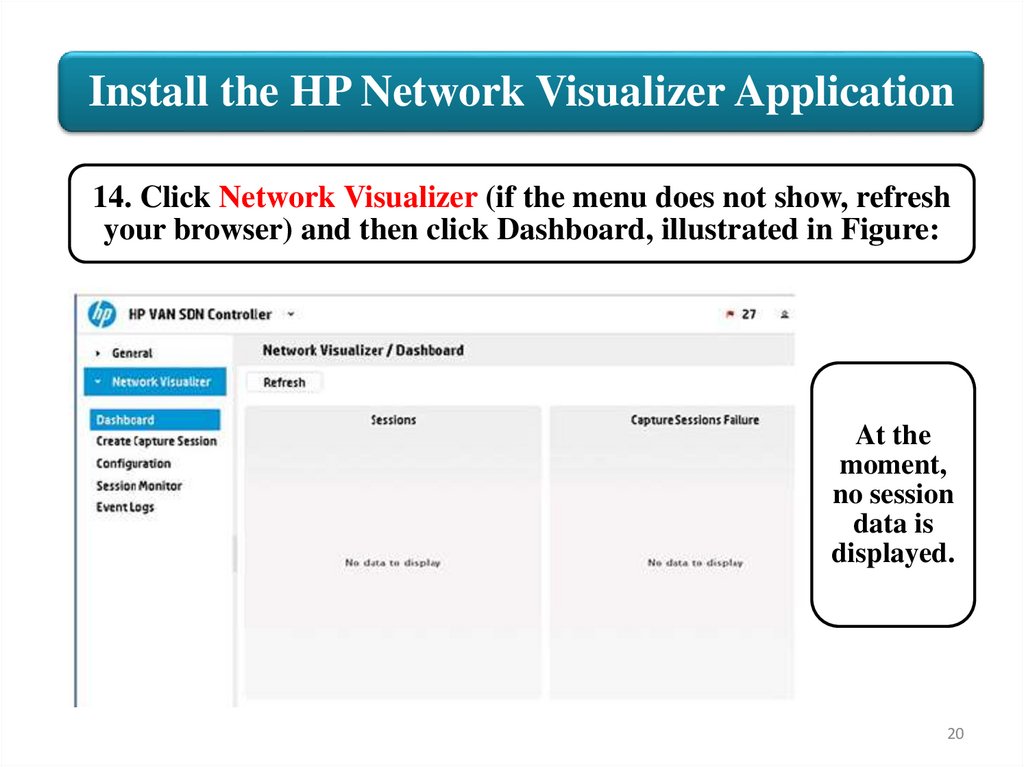
Install the HP Network Visualizer Application14. Click Network Visualizer (if the menu does not show, refresh
your browser) and then click Dashboard, illustrated in Figure:
At the
moment,
no session
data is
displayed.
20
21.
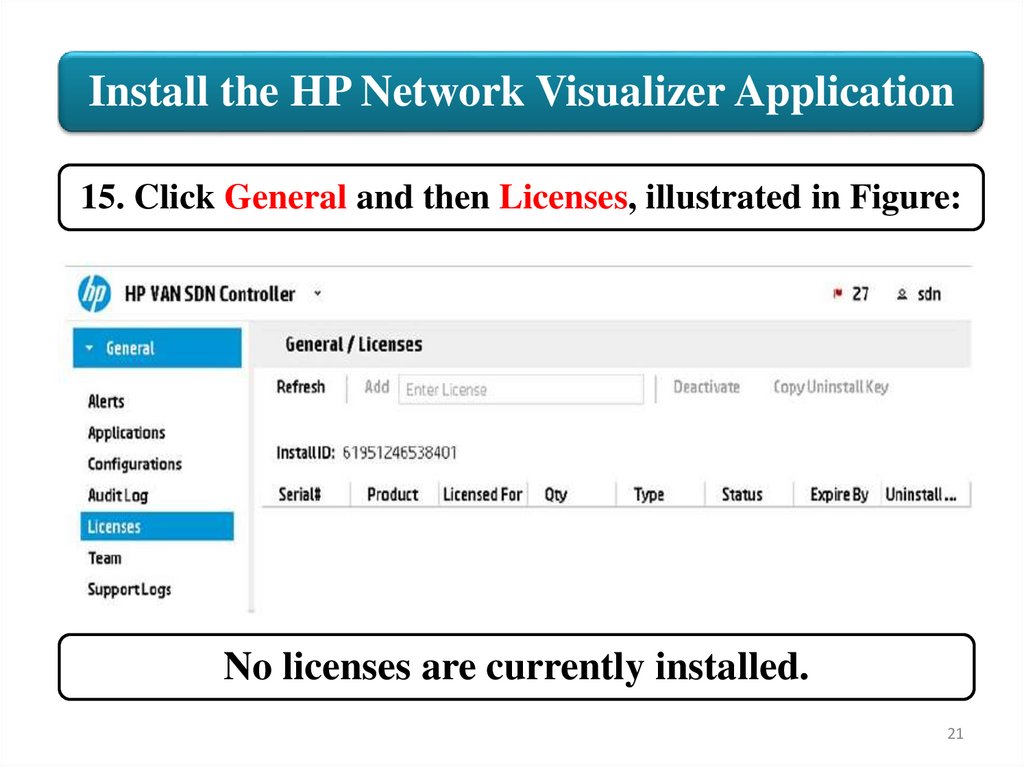
Install the HP Network Visualizer Application15. Click General and then Licenses, illustrated in Figure:
No licenses are currently installed.
21
22.
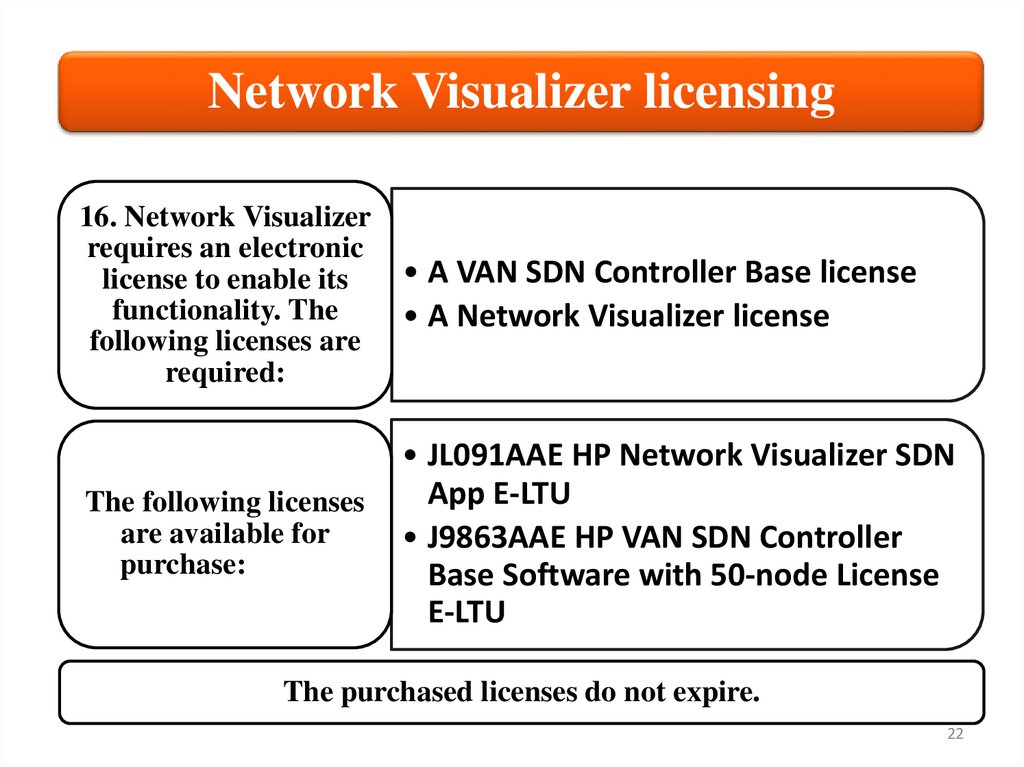
Network Visualizer licensing16. Network Visualizer
requires an electronic
license to enable its
functionality. The
following licenses are
required:
• A VAN SDN Controller Base license
• A Network Visualizer license
The following licenses
are available for
purchase:
• JL091AAE HP Network Visualizer SDN
App E-LTU
• J9863AAE HP VAN SDN Controller
Base Software with 50-node License
E-LTU
The purchased licenses do not expire.
22
23.
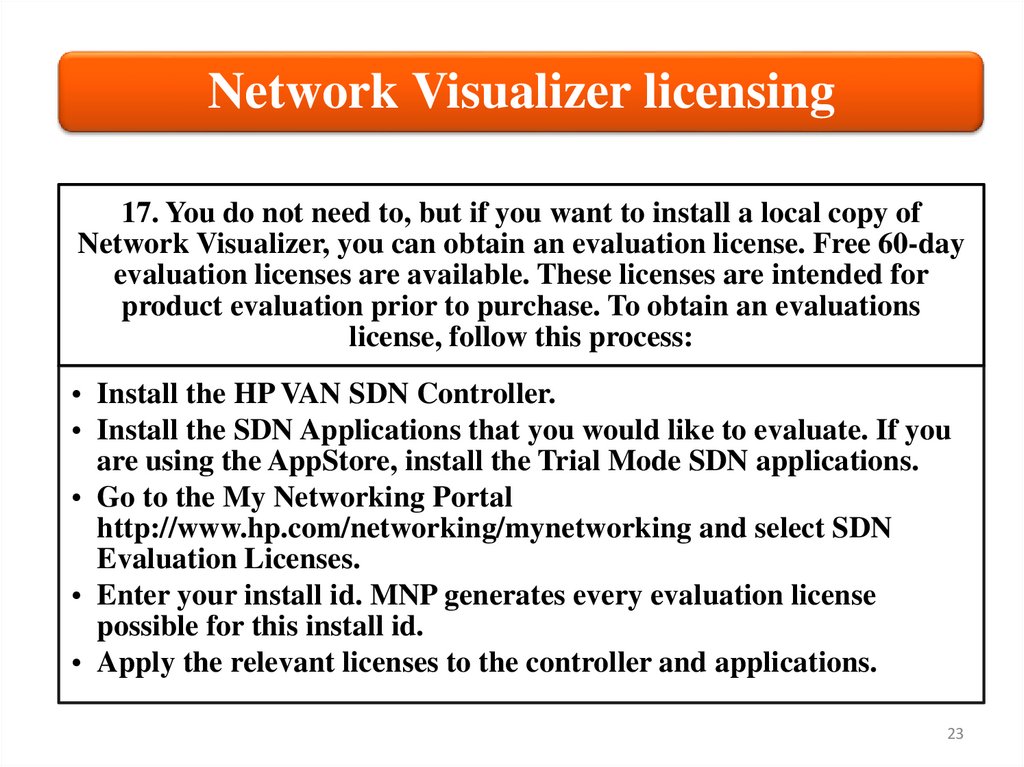
Network Visualizer licensing17. You do not need to, but if you want to install a local copy of
Network Visualizer, you can obtain an evaluation license. Free 60-day
evaluation licenses are available. These licenses are intended for
product evaluation prior to purchase. To obtain an evaluations
license, follow this process:
• Install the HP VAN SDN Controller.
• Install the SDN Applications that you would like to evaluate. If you
are using the AppStore, install the Trial Mode SDN applications.
• Go to the My Networking Portal
http://www.hp.com/networking/mynetworking and select SDN
Evaluation Licenses.
• Enter your install id. MNP generates every evaluation license
possible for this install id.
• Apply the relevant licenses to the controller and applications.
23
24.
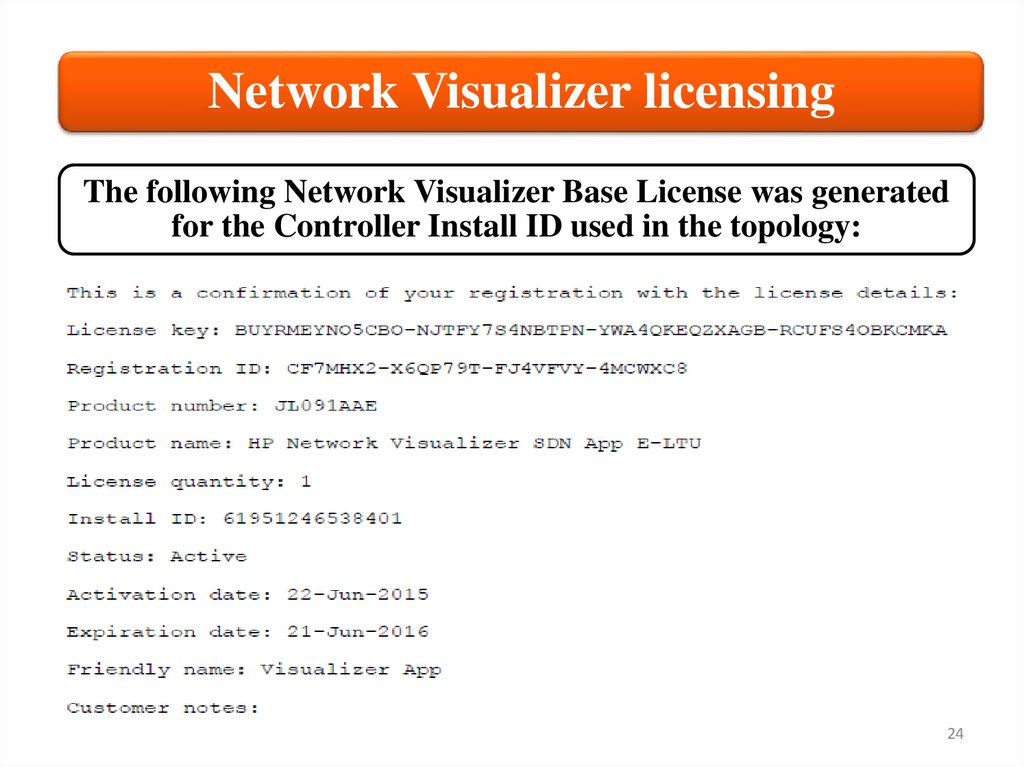
Network Visualizer licensingThe following Network Visualizer Base License was generated
for the Controller Install ID used in the topology:
24
25.
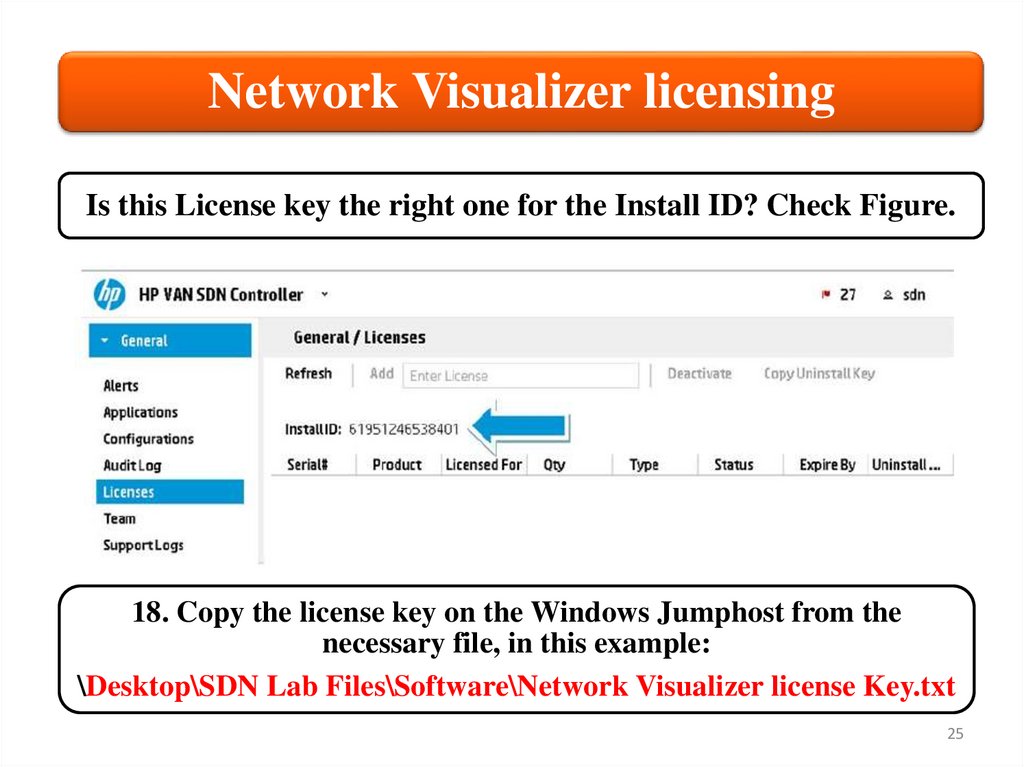
Network Visualizer licensingIs this License key the right one for the Install ID? Check Figure.
18. Copy the license key on the Windows Jumphost from the
necessary file, in this example:
\Desktop\SDN Lab Files\Software\Network Visualizer license Key.txt
25
26.
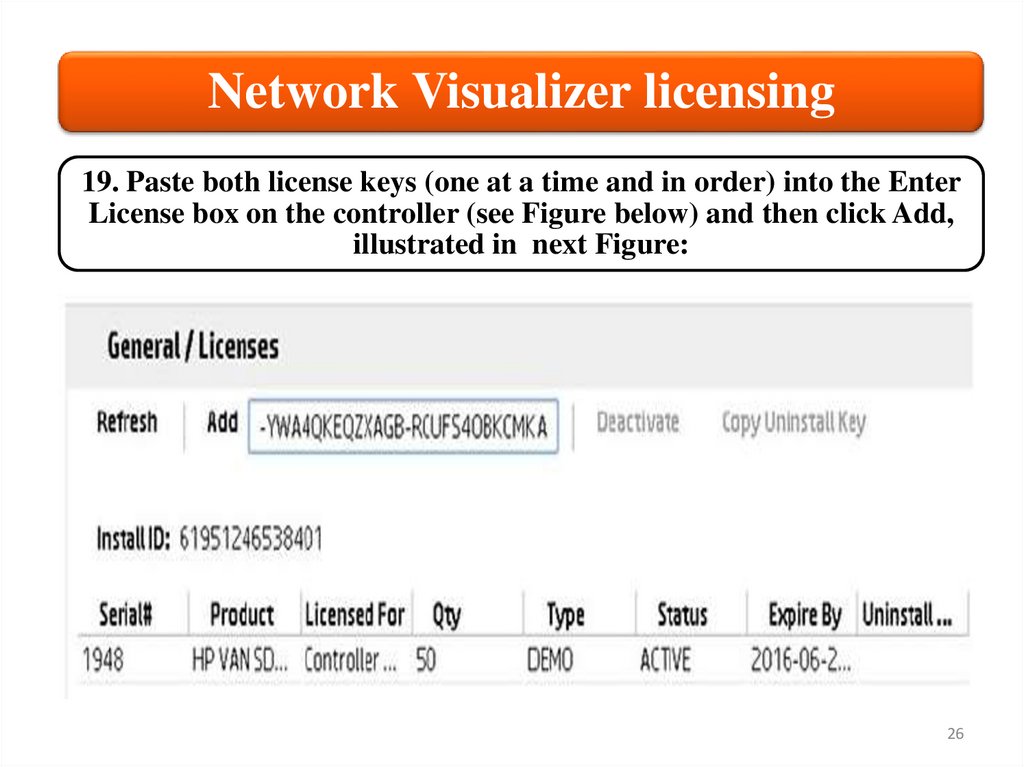
Network Visualizer licensing19. Paste both license keys (one at a time and in order) into the Enter
License box on the controller (see Figure below) and then click Add,
illustrated in next Figure:
26
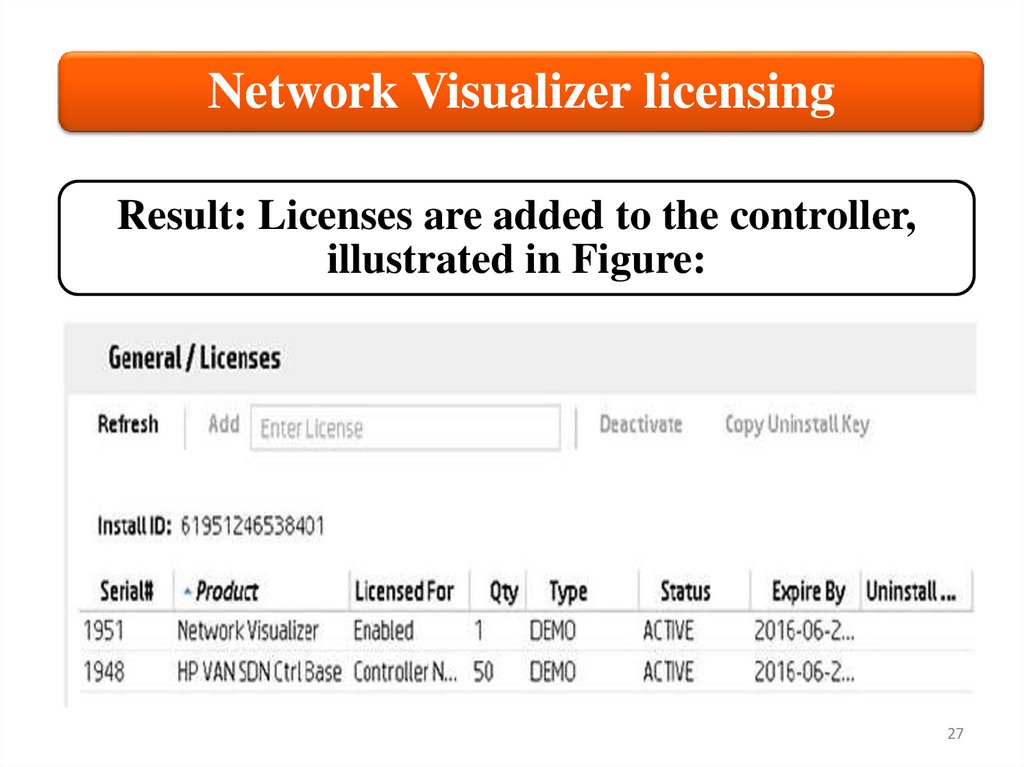
27.
Network Visualizer licensingResult: Licenses are added to the controller,
illustrated in Figure:
27
28.
HP NetworkVisualizer SDN
3. Create capture sessions
using the Create Capture
Session wizard
28
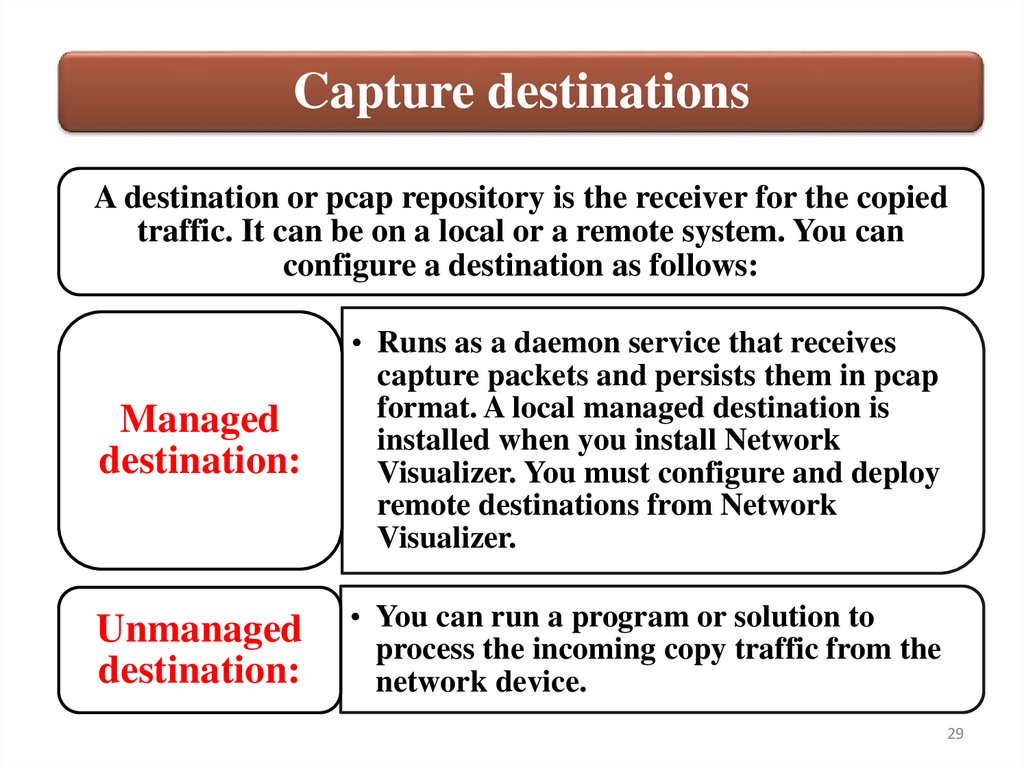
29.
Capture destinationsA destination or pcap repository is the receiver for the copied
traffic. It can be on a local or a remote system. You can
configure a destination as follows:
Managed
destination:
• Runs as a daemon service that receives
capture packets and persists them in pcap
format. A local managed destination is
installed when you install Network
Visualizer. You must configure and deploy
remote destinations from Network
Visualizer.
Unmanaged
destination:
• You can run a program or solution to
process the incoming copy traffic from the
network device.
29
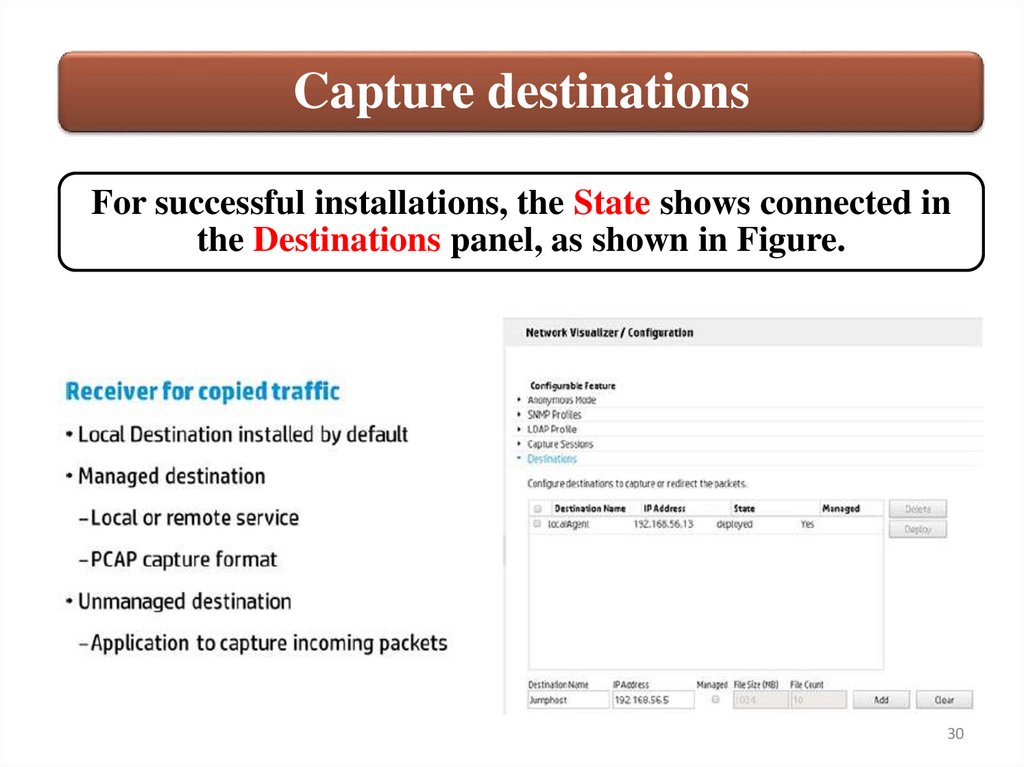
30.
Capture destinationsFor successful installations, the State shows connected in
the Destinations panel, as shown in Figure.
30
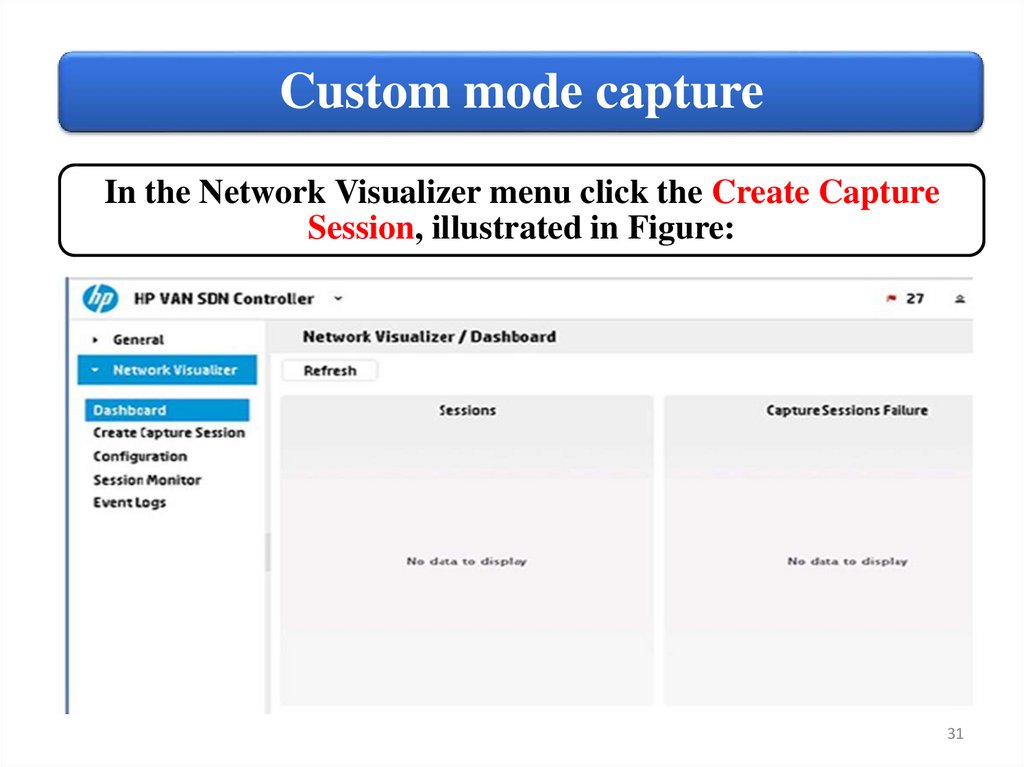
31.
Custom mode captureIn the Network Visualizer menu click the Create Capture
Session, illustrated in Figure:
31
32.
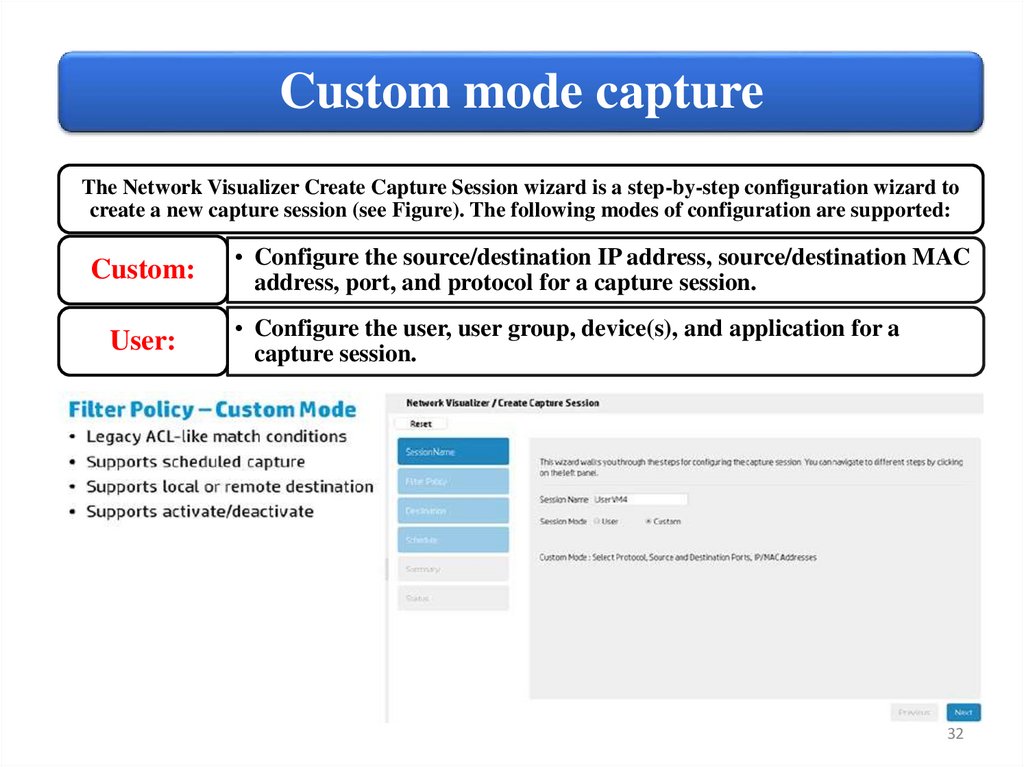
Custom mode captureThe Network Visualizer Create Capture Session wizard is a step-by-step configuration wizard to
create a new capture session (see Figure). The following modes of configuration are supported:
Custom:
User:
• Configure the source/destination IP address, source/destination MAC
address, port, and protocol for a capture session.
• Configure the user, user group, device(s), and application for a
capture session.
32
33.
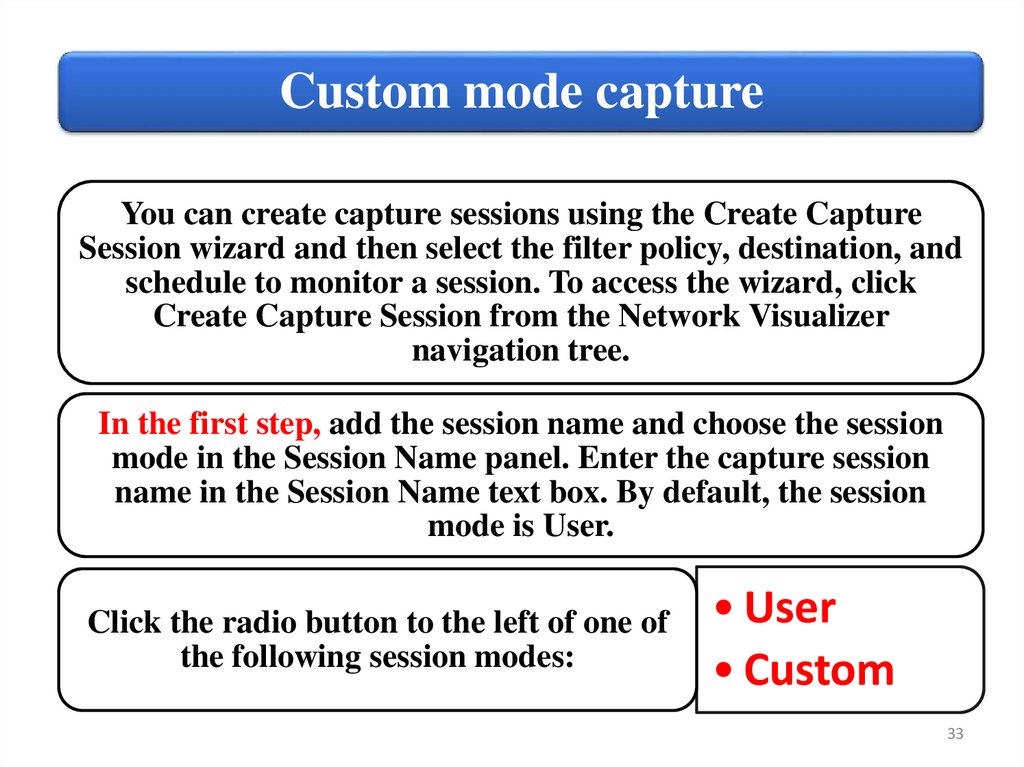
Custom mode captureYou can create capture sessions using the Create Capture
Session wizard and then select the filter policy, destination, and
schedule to monitor a session. To access the wizard, click
Create Capture Session from the Network Visualizer
navigation tree.
In the first step, add the session name and choose the session
mode in the Session Name panel. Enter the capture session
name in the Session Name text box. By default, the session
mode is User.
Click the radio button to the left of one of
the following session modes:
• User
• Custom
33
34.
Custom mode captureIn the second step, set the filter criteria, as shown in Figure:
34
35.
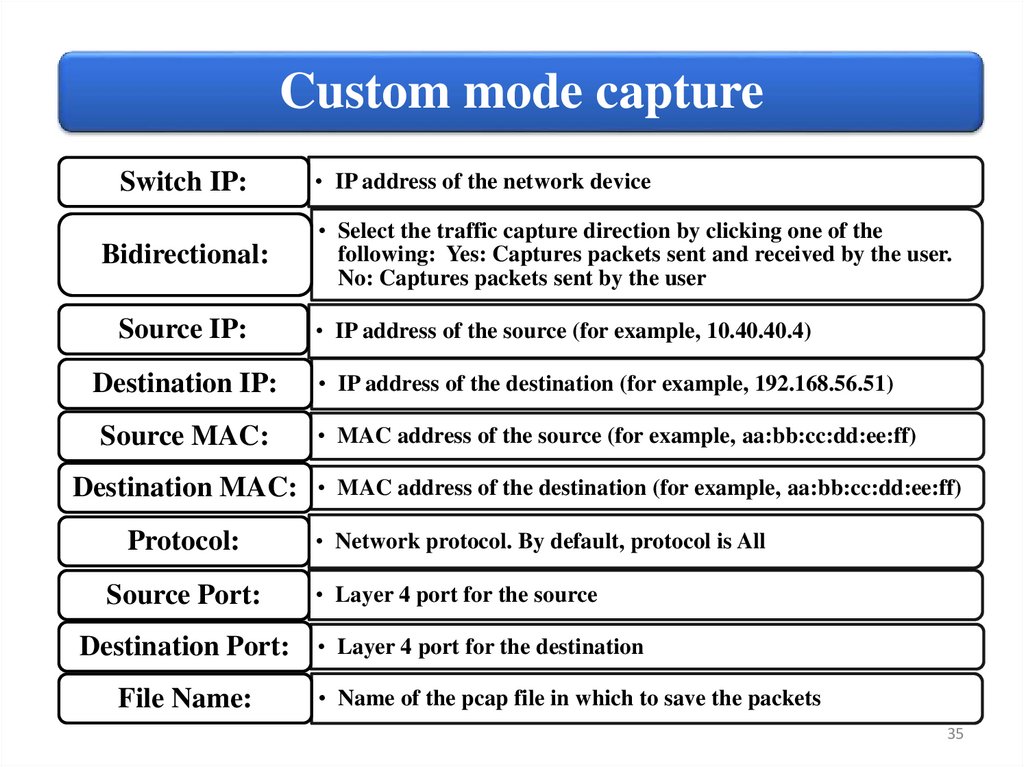
Custom mode captureSwitch IP:
Bidirectional:
Source IP:
Destination IP:
Source MAC:
Destination MAC:
Protocol:
Source Port:
Destination Port:
File Name:
• IP address of the network device
• Select the traffic capture direction by clicking one of the
following: Yes: Captures packets sent and received by the user.
No: Captures packets sent by the user
• IP address of the source (for example, 10.40.40.4)
• IP address of the destination (for example, 192.168.56.51)
• MAC address of the source (for example, aa:bb:cc:dd:ee:ff)
• MAC address of the destination (for example, aa:bb:cc:dd:ee:ff)
• Network protocol. By default, protocol is All
• Layer 4 port for the source
• Layer 4 port for the destination
• Name of the pcap file in which to save the packets
35
36.
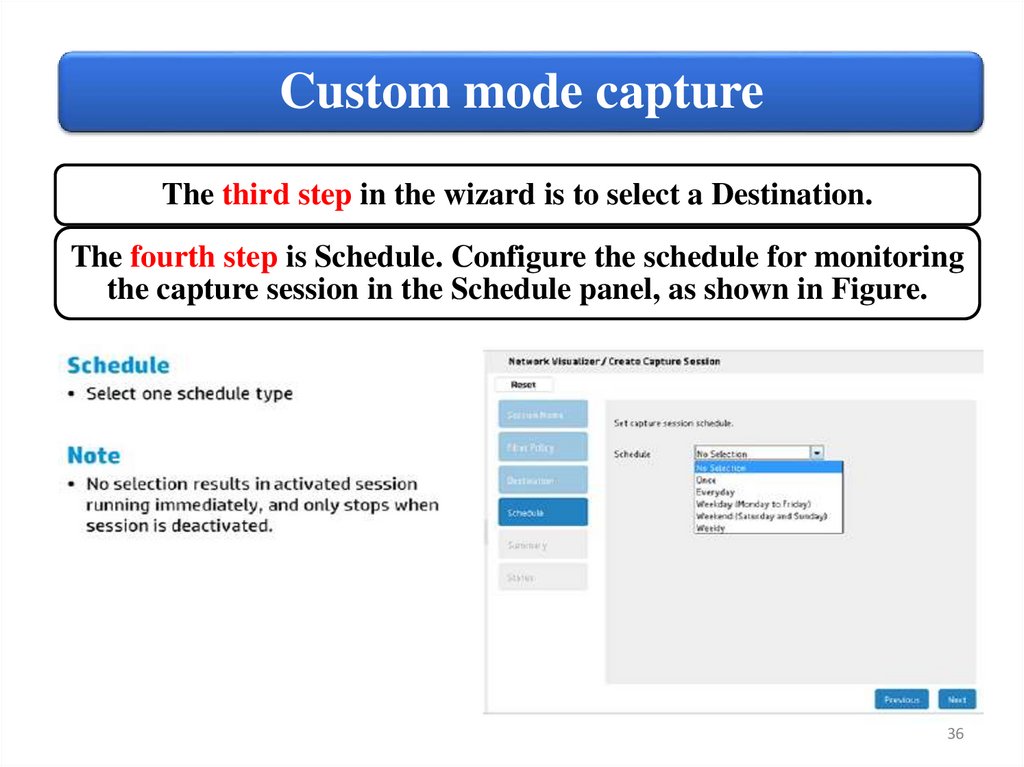
Custom mode captureThe third step in the wizard is to select a Destination.
The fourth step is Schedule. Configure the schedule for monitoring
the capture session in the Schedule panel, as shown in Figure.
36
37.
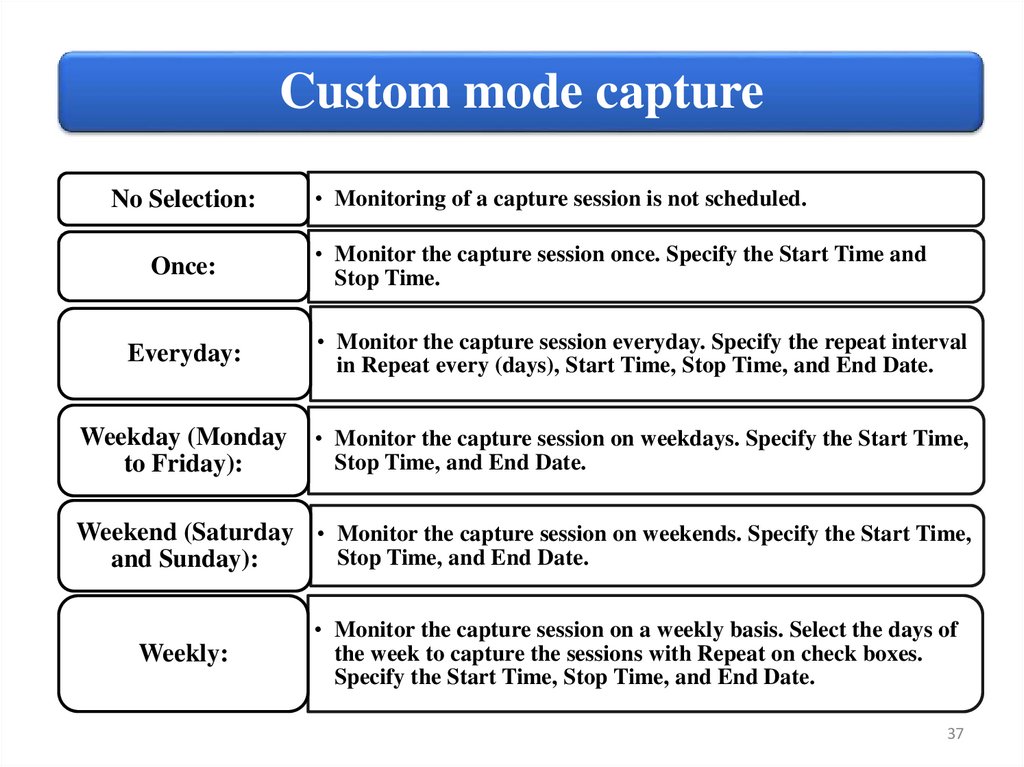
Custom mode captureNo Selection:
Once:
• Monitoring of a capture session is not scheduled.
• Monitor the capture session once. Specify the Start Time and
Stop Time.
Everyday:
• Monitor the capture session everyday. Specify the repeat interval
in Repeat every (days), Start Time, Stop Time, and End Date.
Weekday (Monday
to Friday):
• Monitor the capture session on weekdays. Specify the Start Time,
Stop Time, and End Date.
Weekend (Saturday • Monitor the capture session on weekends. Specify the Start Time,
Stop Time, and End Date.
and Sunday):
Weekly:
• Monitor the capture session on a weekly basis. Select the days of
the week to capture the sessions with Repeat on check boxes.
Specify the Start Time, Stop Time, and End Date.
37
38.
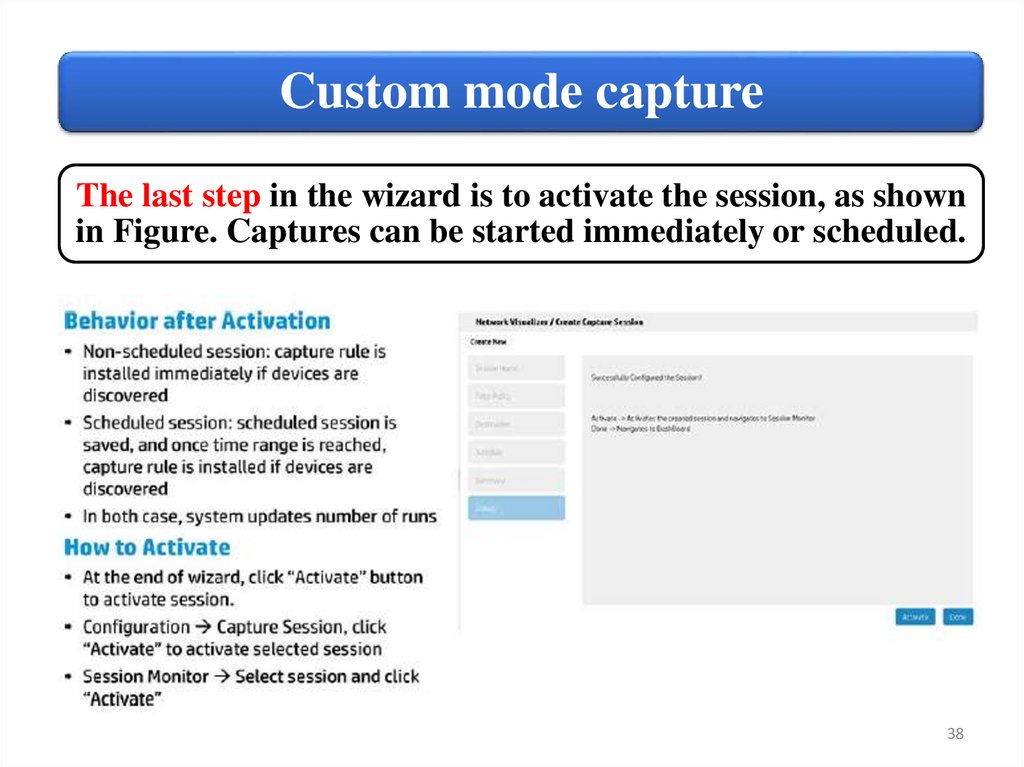
Custom mode captureThe last step in the wizard is to activate the session, as shown
in Figure. Captures can be started immediately or scheduled.
38
39.
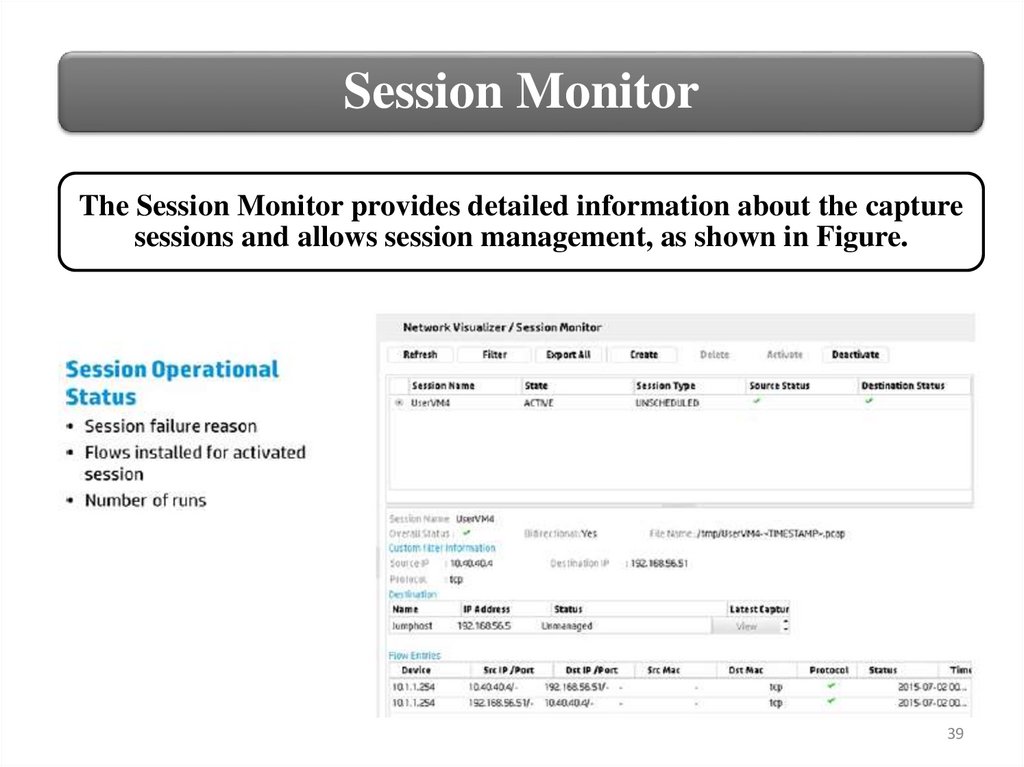
Session MonitorThe Session Monitor provides detailed information about the capture
sessions and allows session management, as shown in Figure.
39
40.
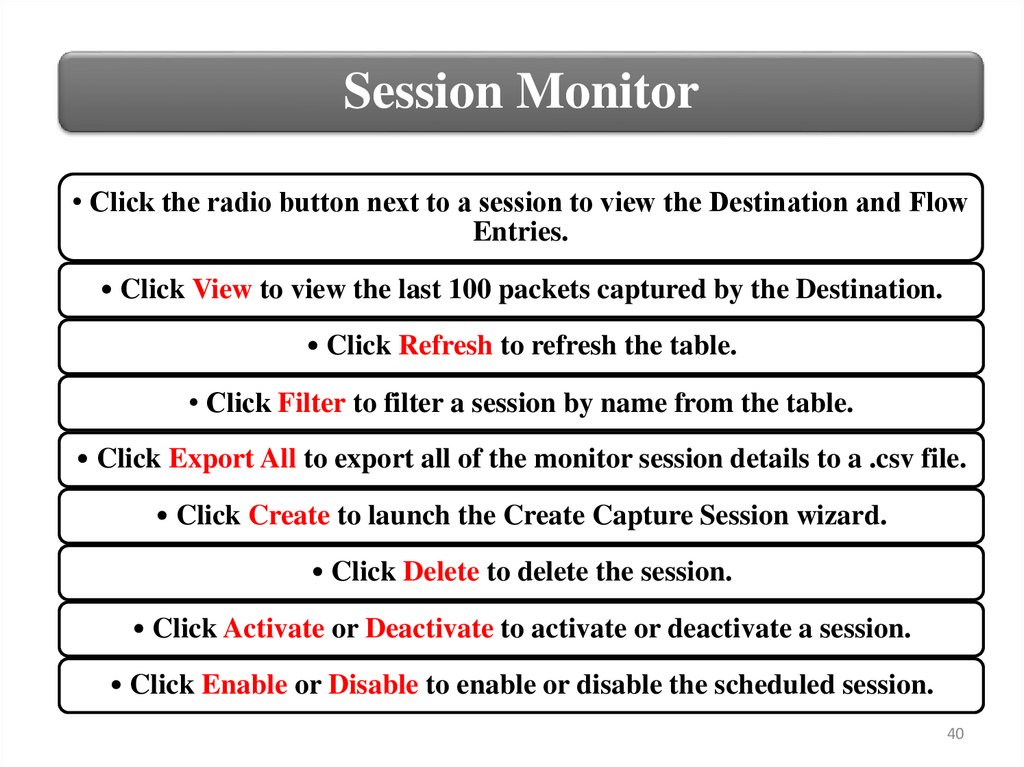
Session Monitor• Click the radio button next to a session to view the Destination and Flow
Entries.
• Click View to view the last 100 packets captured by the Destination.
• Click Refresh to refresh the table.
• Click Filter to filter a session by name from the table.
• Click Export All to export all of the monitor session details to a .csv file.
• Click Create to launch the Create Capture Session wizard.
• Click Delete to delete the session.
• Click Activate or Deactivate to activate or deactivate a session.
• Click Enable or Disable to enable or disable the scheduled session.
40
41.
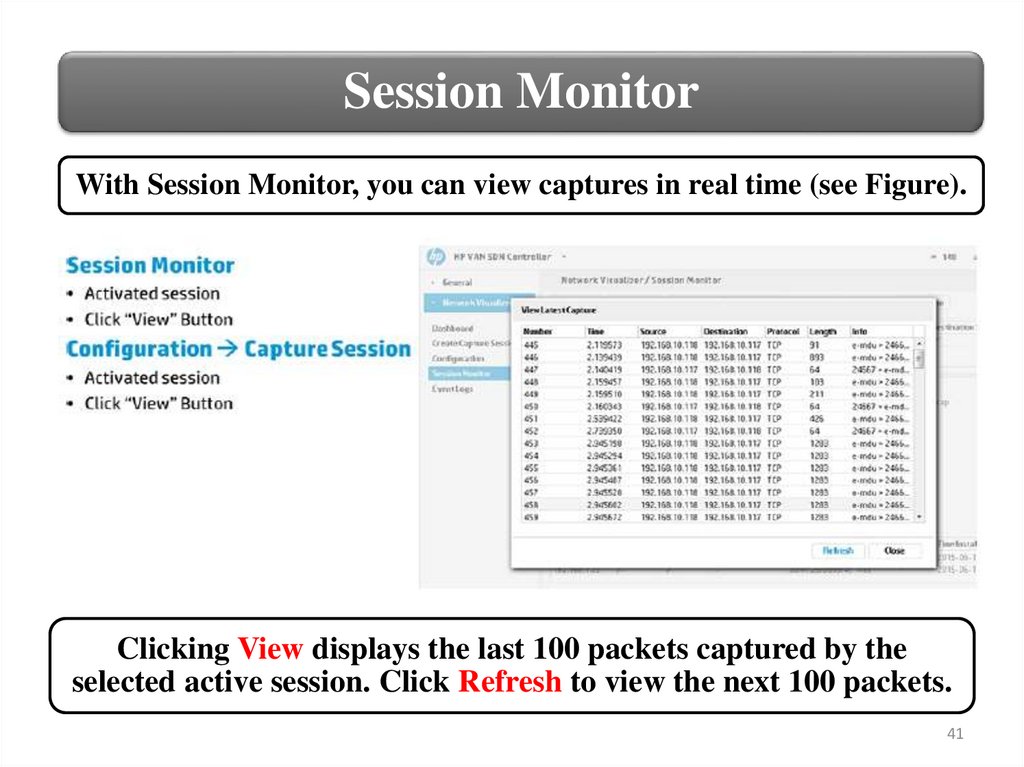
Session MonitorWith Session Monitor, you can view captures in real time (see Figure).
Clicking View displays the last 100 packets captured by the
selected active session. Click Refresh to view the next 100 packets.
41
42.
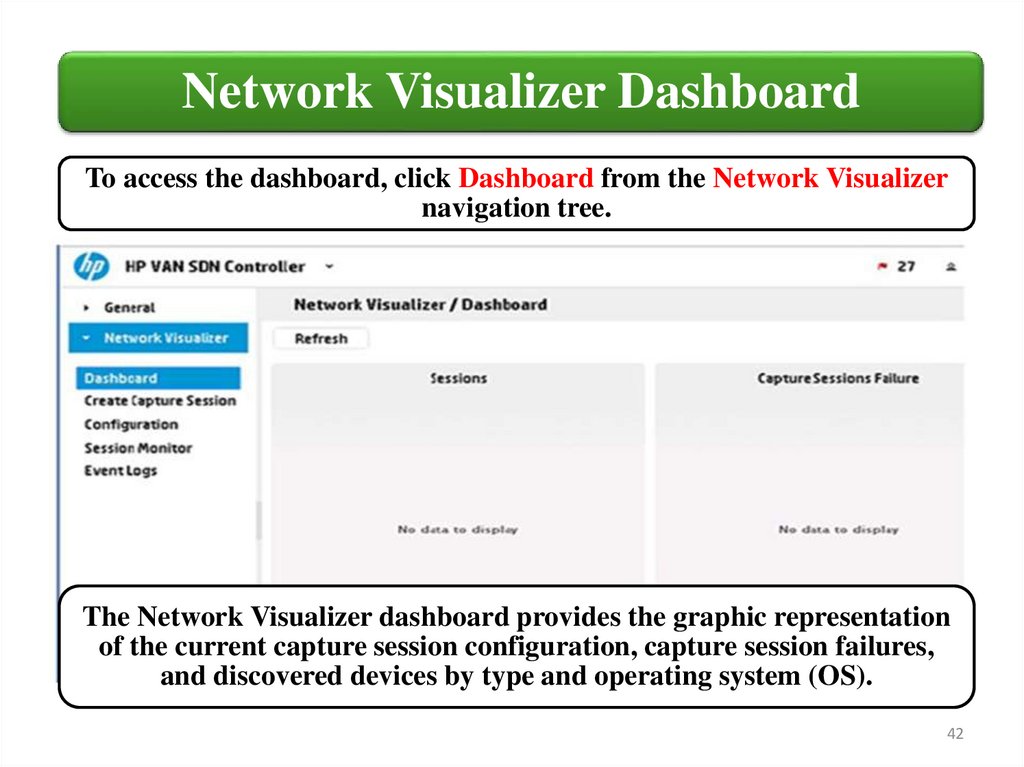
Network Visualizer DashboardTo access the dashboard, click Dashboard from the Network Visualizer
navigation tree.
The Network Visualizer dashboard provides the graphic representation
of the current capture session configuration, capture session failures,
and discovered devices by type and operating system (OS).
42
43.
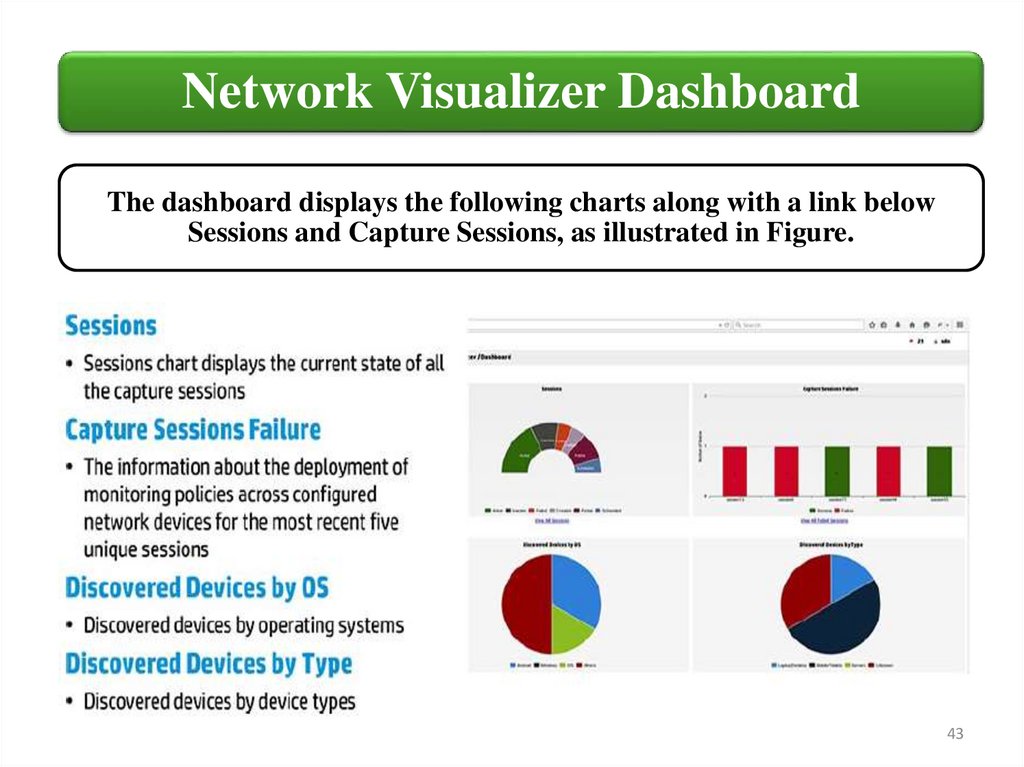
Network Visualizer DashboardThe dashboard displays the following charts along with a link below
Sessions and Capture Sessions, as illustrated in Figure.
43
44.
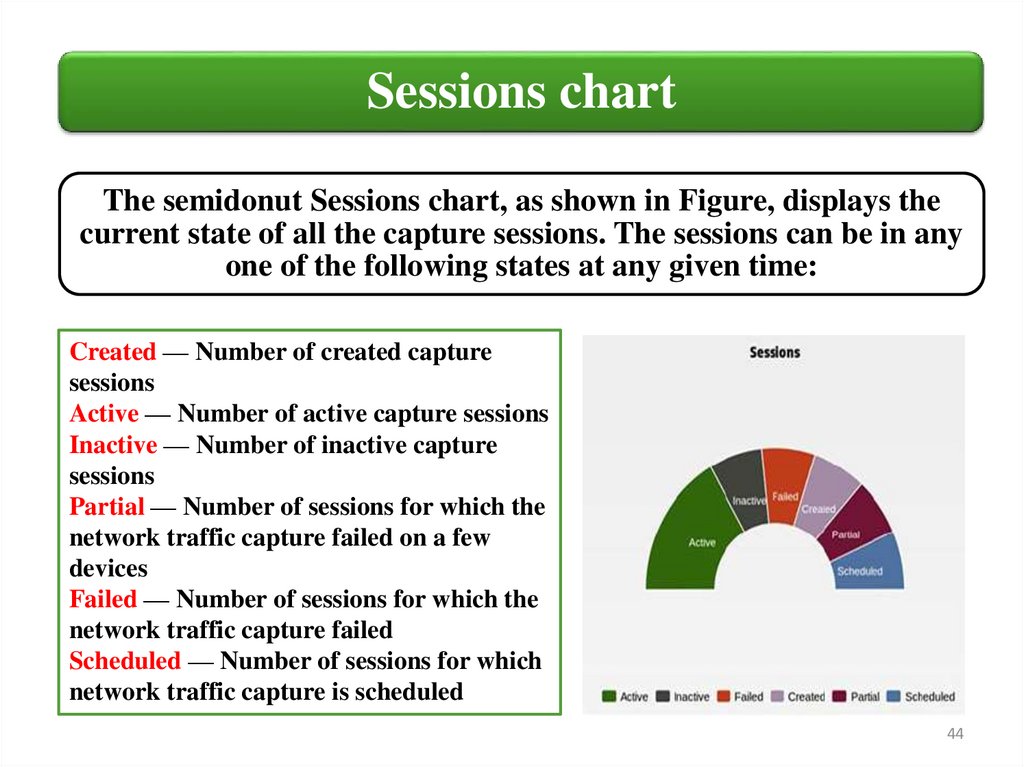
Sessions chartThe semidonut Sessions chart, as shown in Figure, displays the
current state of all the capture sessions. The sessions can be in any
one of the following states at any given time:
Created — Number of created capture
sessions
Active — Number of active capture sessions
Inactive — Number of inactive capture
sessions
Partial — Number of sessions for which the
network traffic capture failed on a few
devices
Failed — Number of sessions for which the
network traffic capture failed
Scheduled — Number of sessions for which
network traffic capture is scheduled
44
45.
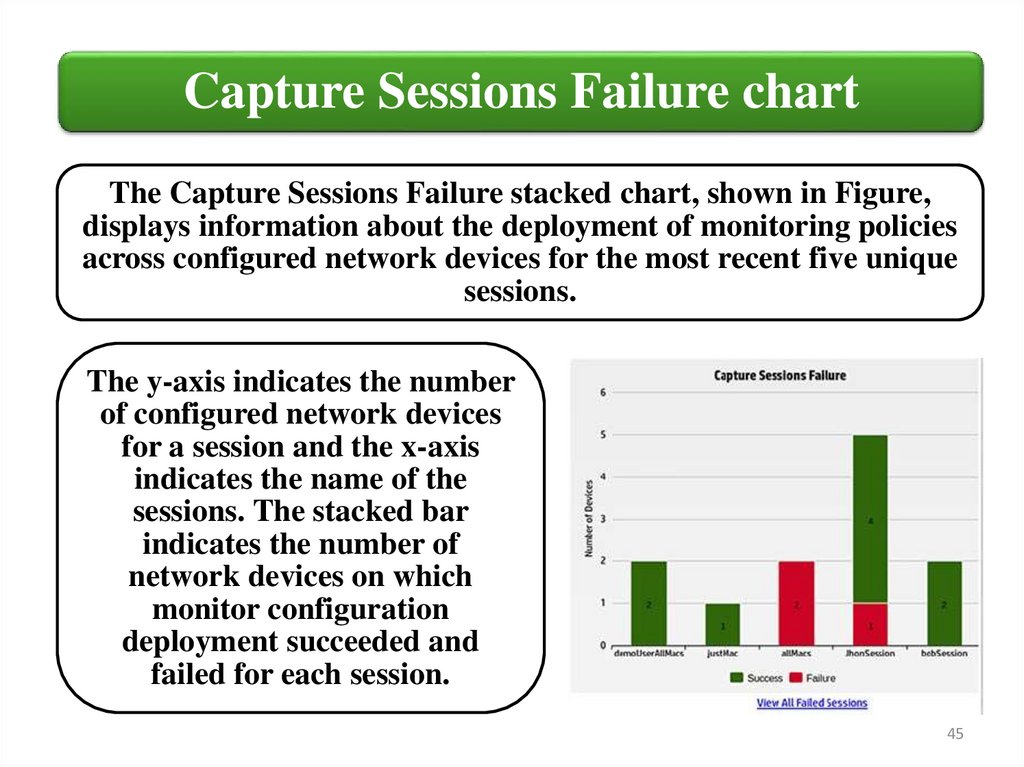
Capture Sessions Failure chartThe Capture Sessions Failure stacked chart, shown in Figure,
displays information about the deployment of monitoring policies
across configured network devices for the most recent five unique
sessions.
The y-axis indicates the number
of configured network devices
for a session and the x-axis
indicates the name of the
sessions. The stacked bar
indicates the number of
network devices on which
monitor configuration
deployment succeeded and
failed for each session.
45
46.
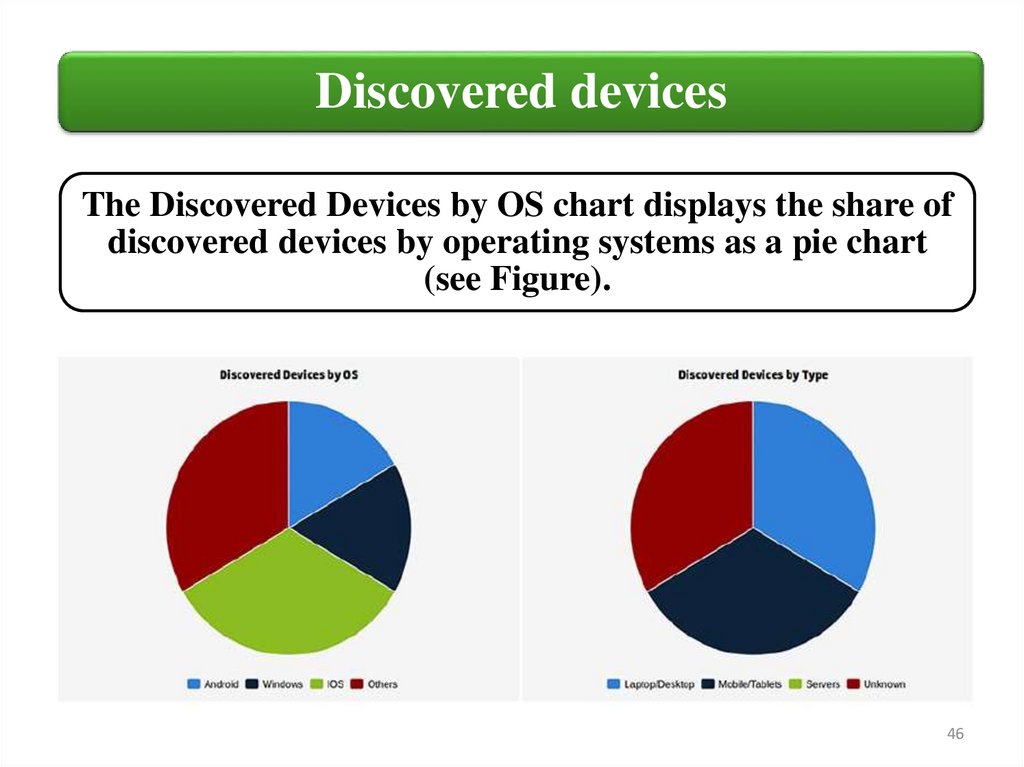
Discovered devicesThe Discovered Devices by OS chart displays the share of
discovered devices by operating systems as a pie chart
(see Figure).
46
47.
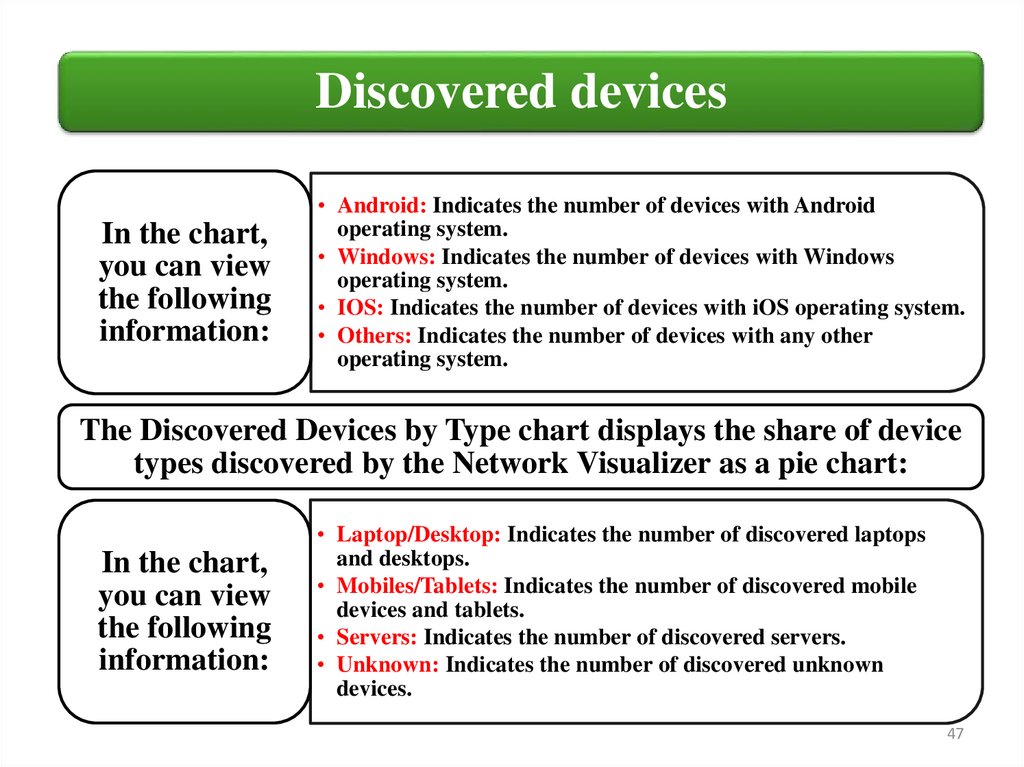
Discovered devicesIn the chart,
you can view
the following
information:
• Android: Indicates the number of devices with Android
operating system.
• Windows: Indicates the number of devices with Windows
operating system.
• IOS: Indicates the number of devices with iOS operating system.
• Others: Indicates the number of devices with any other
operating system.
The Discovered Devices by Type chart displays the share of device
types discovered by the Network Visualizer as a pie chart:
In the chart,
you can view
the following
information:
• Laptop/Desktop: Indicates the number of discovered laptops
and desktops.
• Mobiles/Tablets: Indicates the number of discovered mobile
devices and tablets.
• Servers: Indicates the number of discovered servers.
• Unknown: Indicates the number of discovered unknown
devices.
47
48.
HP NetworkVisualizer SDN
4. Integrate HP Network
Visualizer SDN with HP switches
48
49.
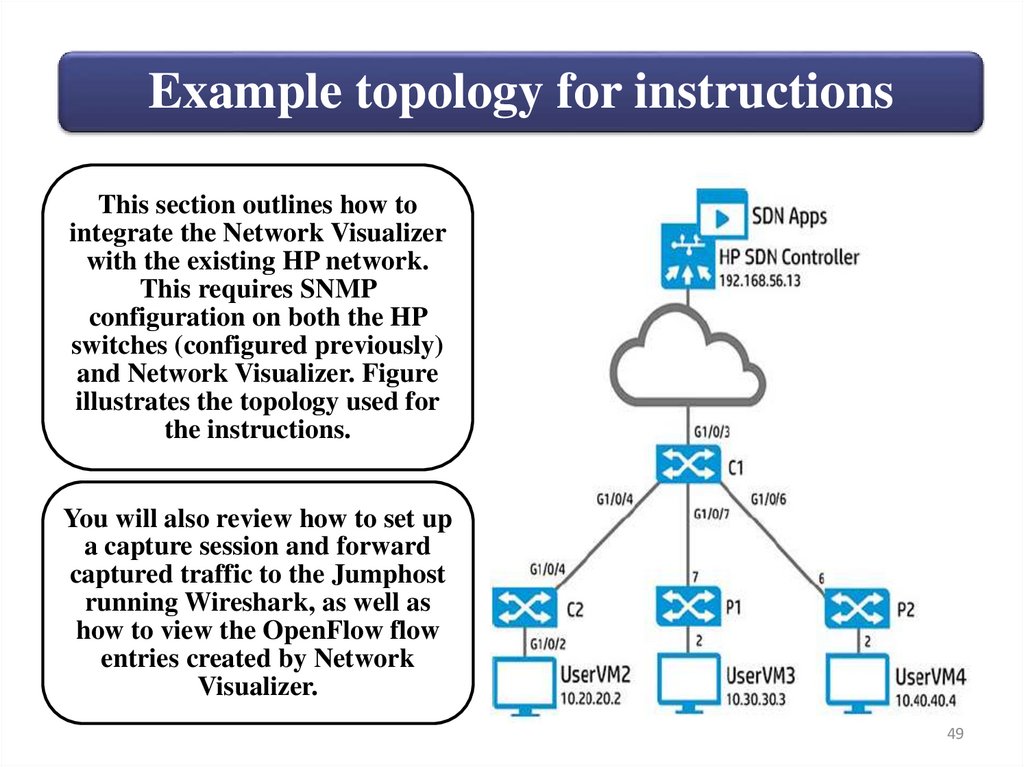
Example topology for instructionsThis section outlines how to
integrate the Network Visualizer
with the existing HP network.
This requires SNMP
configuration on both the HP
switches (configured previously)
and Network Visualizer. Figure
illustrates the topology used for
the instructions.
You will also review how to set up
a capture session and forward
captured traffic to the Jumphost
running Wireshark, as well as
how to view the OpenFlow flow
entries created by Network
Visualizer.
49
50.
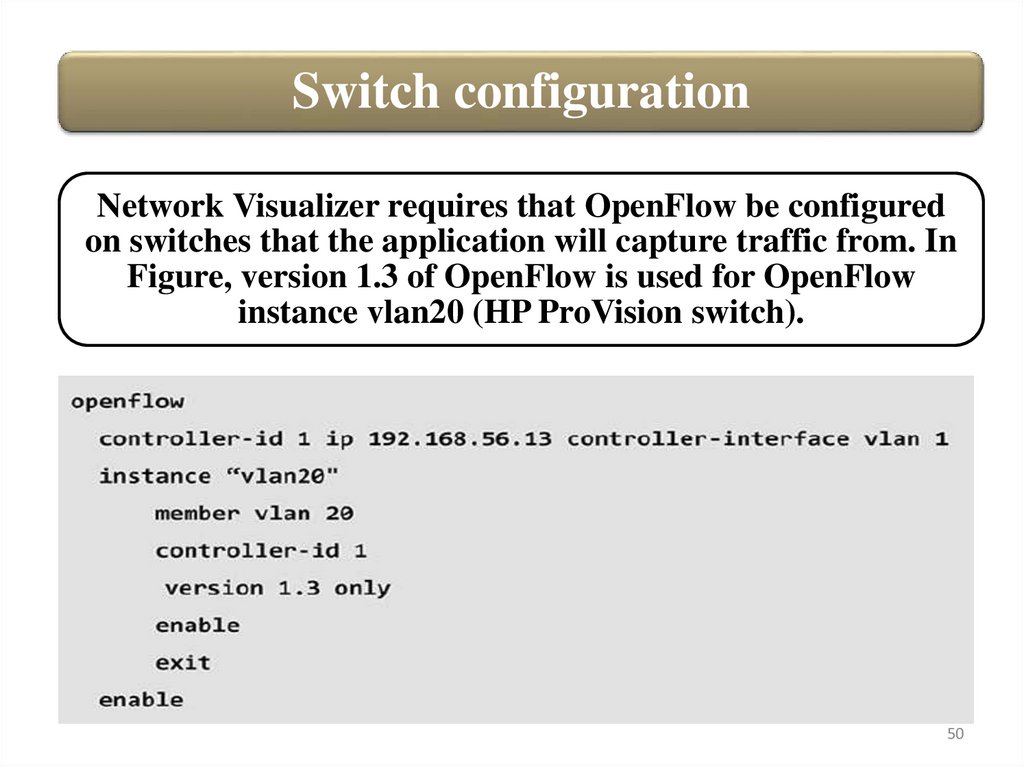
Switch configurationNetwork Visualizer requires that OpenFlow be configured
on switches that the application will capture traffic from. In
Figure, version 1.3 of OpenFlow is used for OpenFlow
instance vlan20 (HP ProVision switch).
50
51.
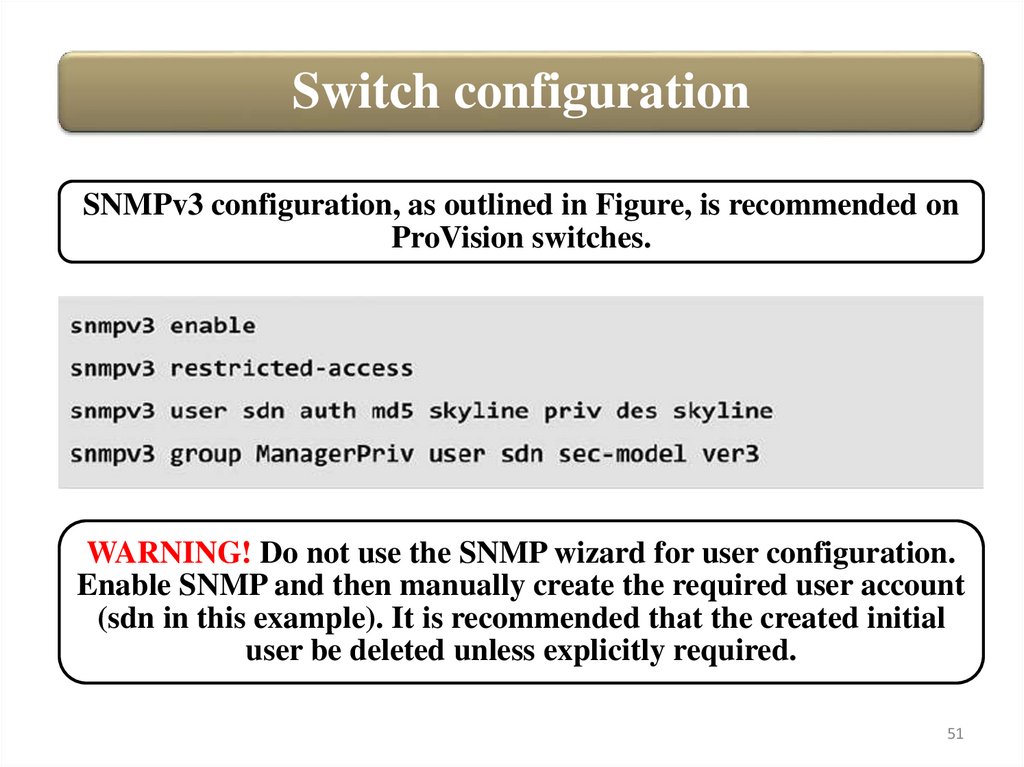
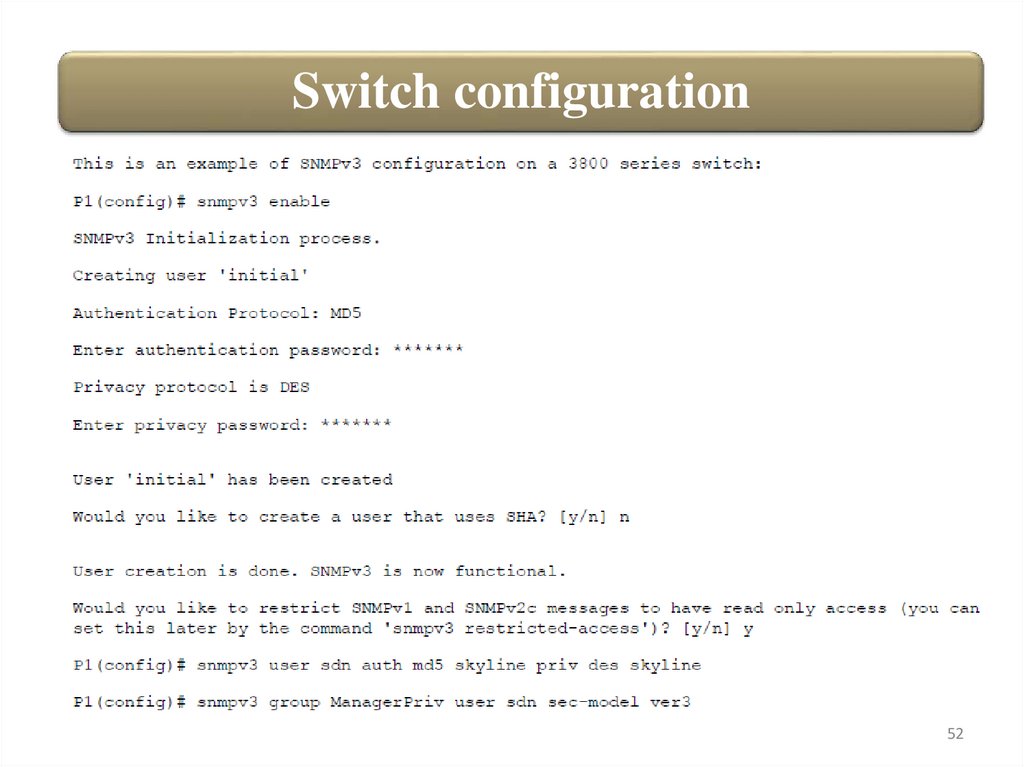
Switch configurationSNMPv3 configuration, as outlined in Figure, is recommended on
ProVision switches.
WARNING! Do not use the SNMP wizard for user configuration.
Enable SNMP and then manually create the required user account
(sdn in this example). It is recommended that the created initial
user be deleted unless explicitly required.
51
52.
Switch configuration52
53.
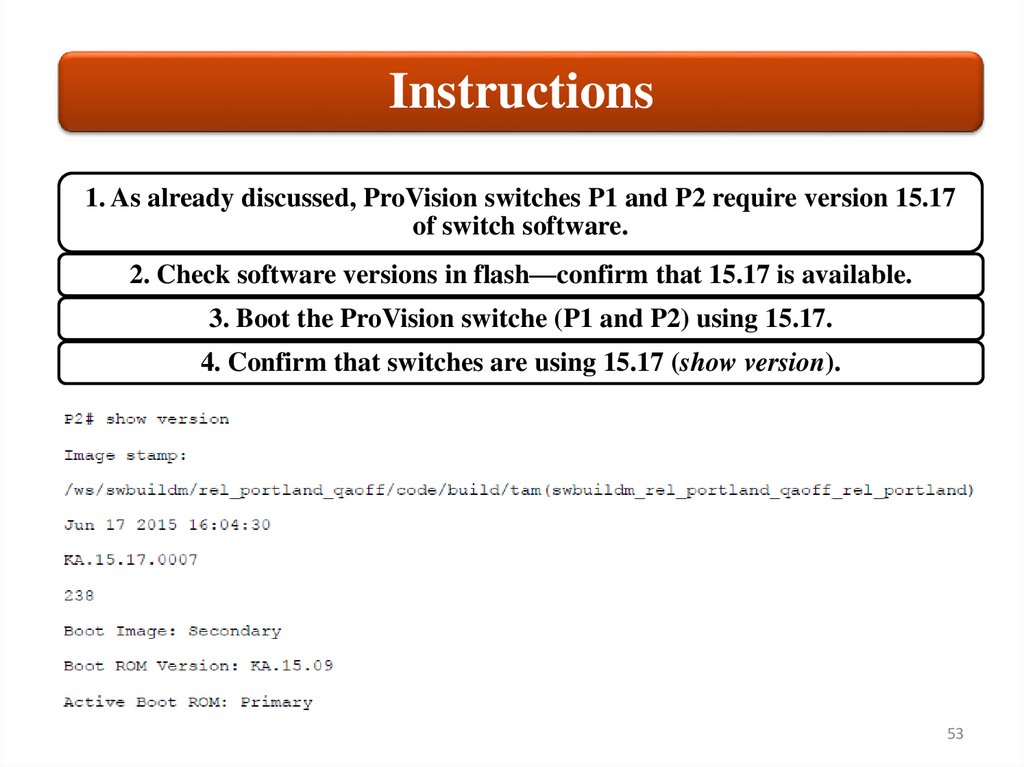
Instructions1. As already discussed, ProVision switches P1 and P2 require version 15.17
of switch software.
2. Check software versions in flash—confirm that 15.17 is available.
3. Boot the ProVision switche (P1 and P2) using 15.17.
4. Confirm that switches are using 15.17 (show version).
53
54.
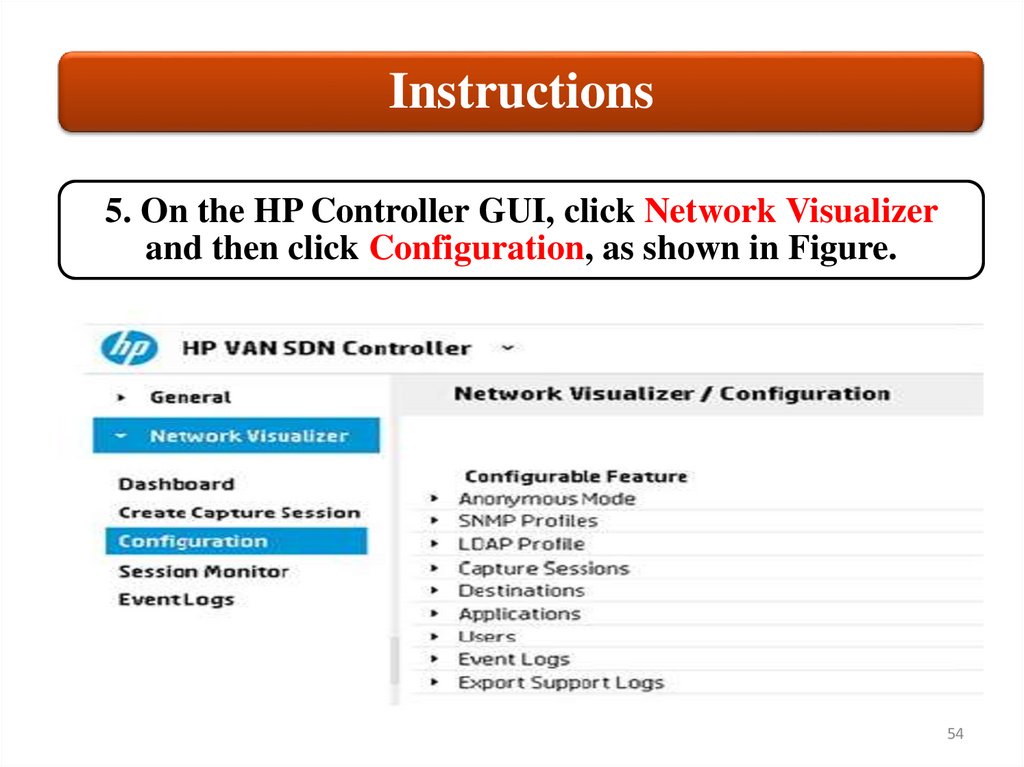
Instructions5. On the HP Controller GUI, click Network Visualizer
and then click Configuration, as shown in Figure.
54
55.
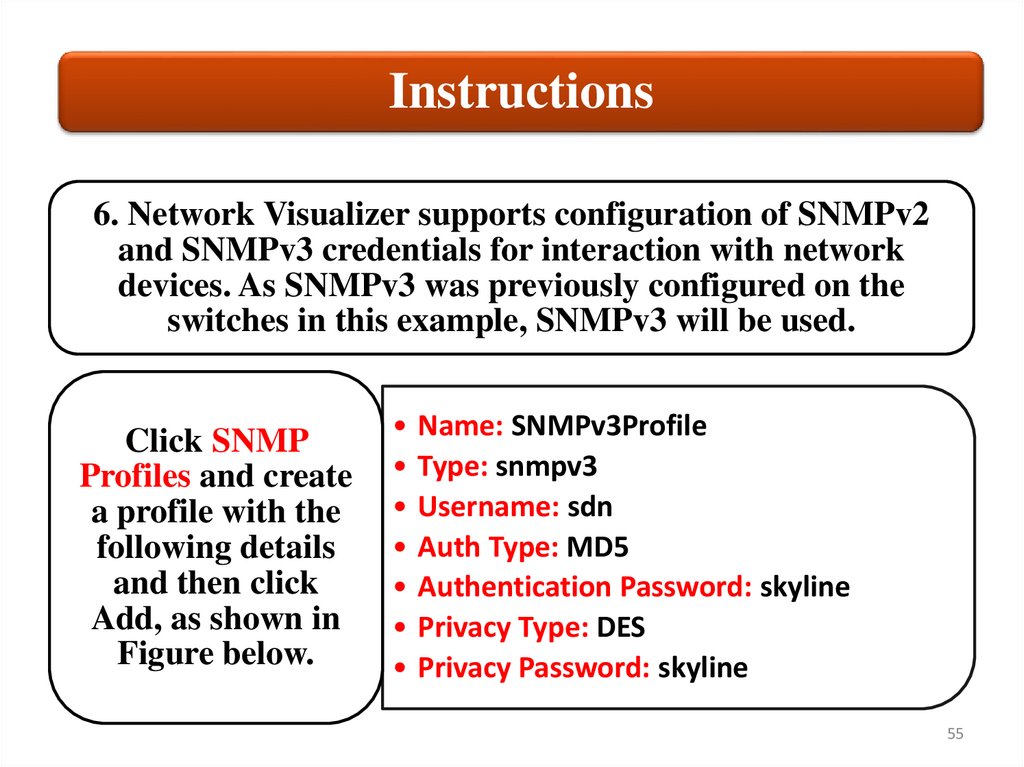
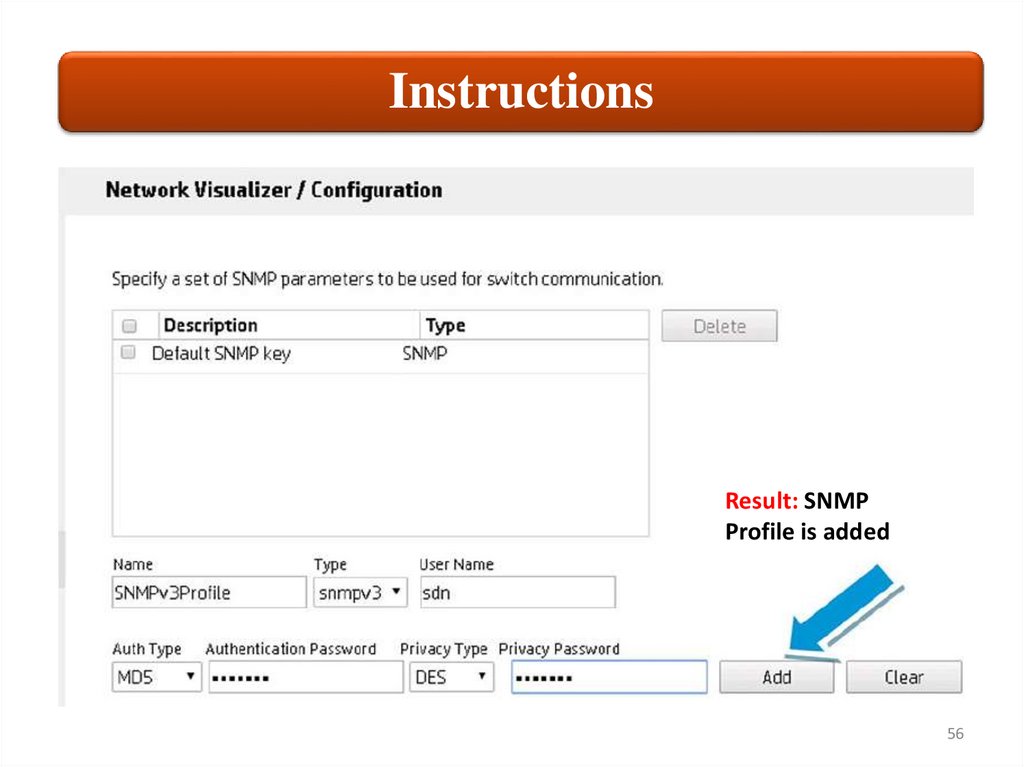
Instructions6. Network Visualizer supports configuration of SNMPv2
and SNMPv3 credentials for interaction with network
devices. As SNMPv3 was previously configured on the
switches in this example, SNMPv3 will be used.
Click SNMP
Profiles and create
a profile with the
following details
and then click
Add, as shown in
Figure below.
Name: SNMPv3Profile
Type: snmpv3
Username: sdn
Auth Type: MD5
Authentication Password: skyline
Privacy Type: DES
Privacy Password: skyline
55
56.
InstructionsResult: SNMP
Profile is added
56
57.
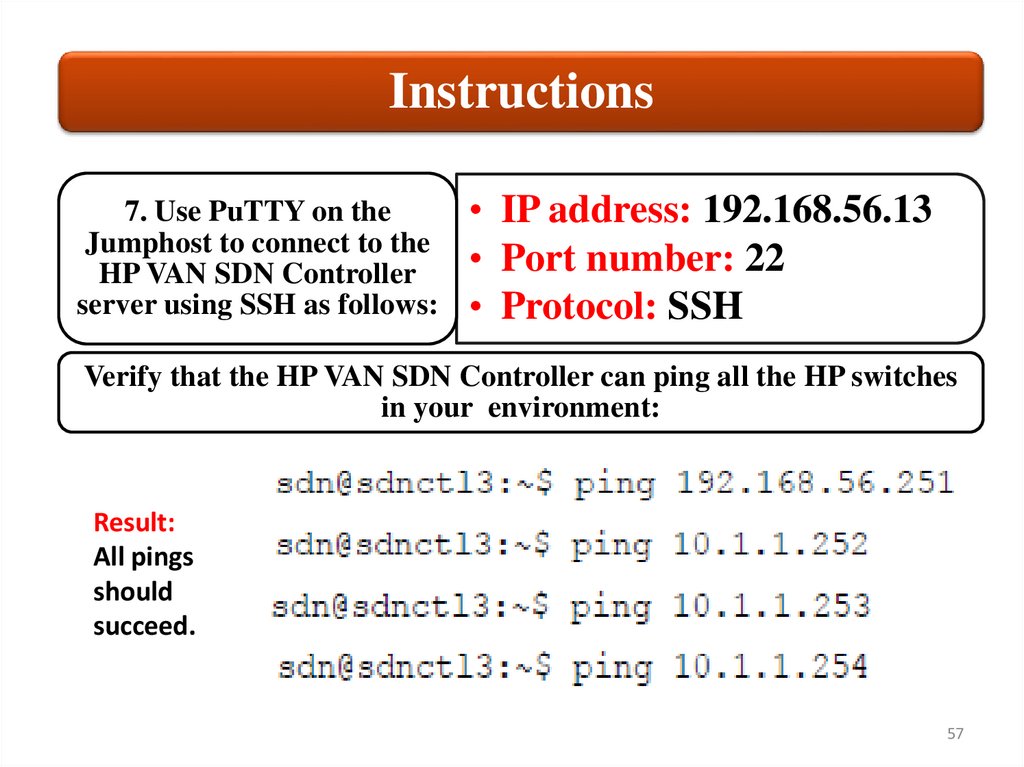
Instructions7. Use PuTTY on the
Jumphost to connect to the
HP VAN SDN Controller
server using SSH as follows:
• IP address: 192.168.56.13
• Port number: 22
• Protocol: SSH
Verify that the HP VAN SDN Controller can ping all the HP switches
in your environment:
Result:
All pings
should
succeed.
57
58.
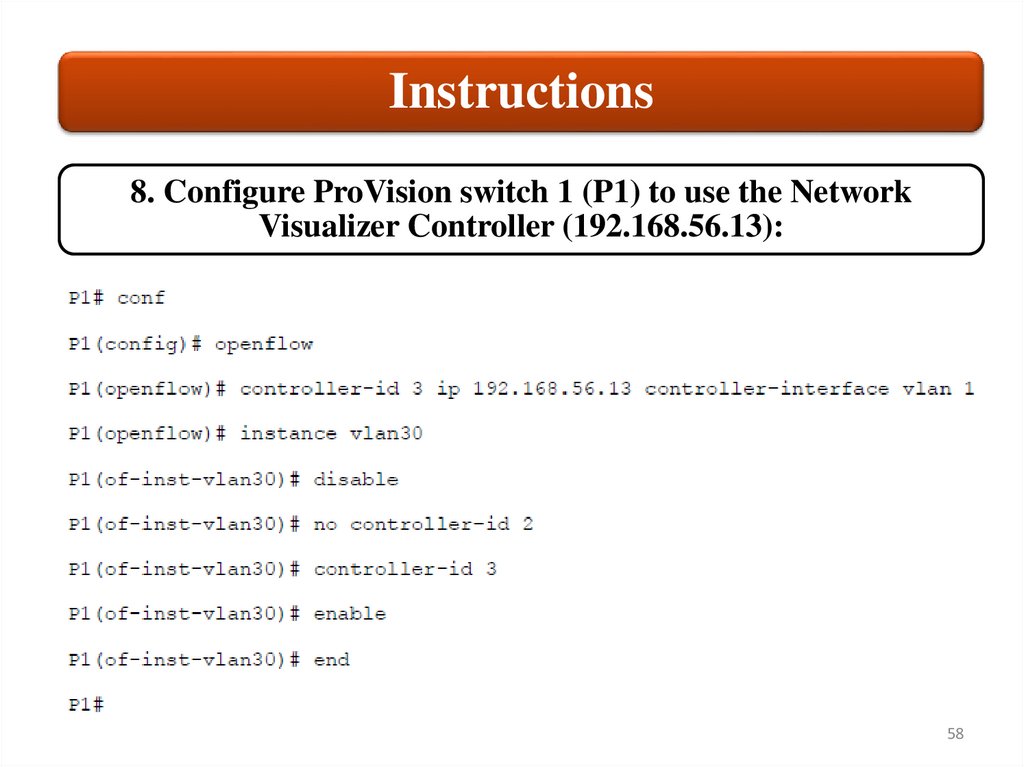
Instructions8. Configure ProVision switch 1 (P1) to use the Network
Visualizer Controller (192.168.56.13):
58
59.
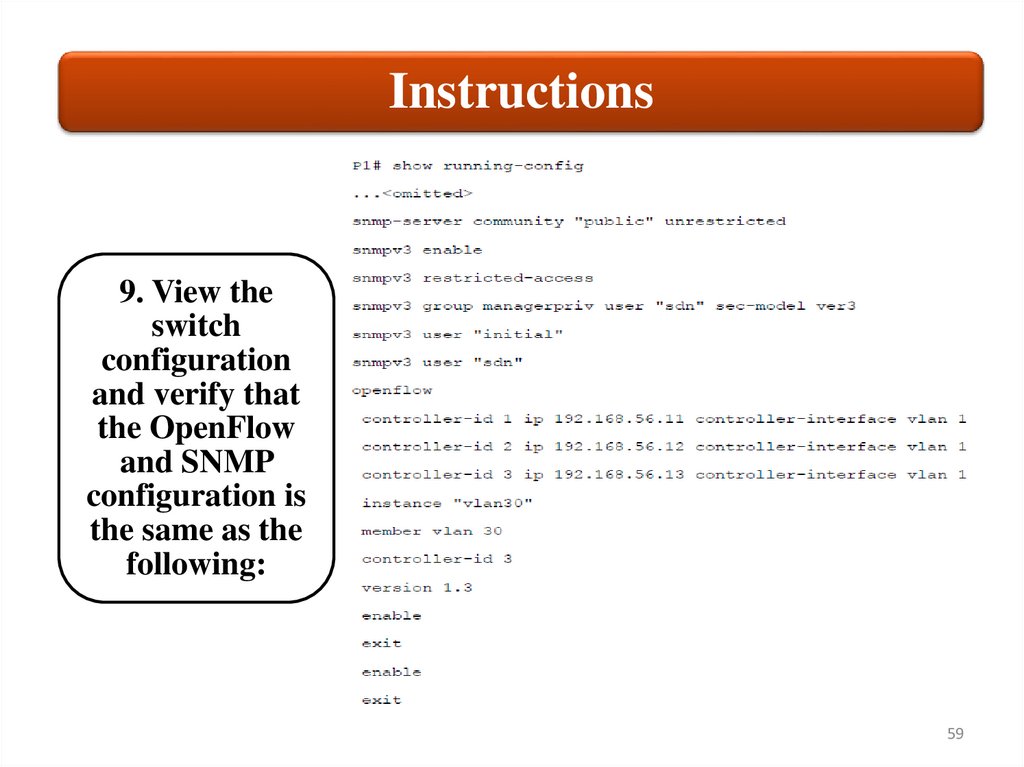
Instructions9. View the
switch
configuration
and verify that
the OpenFlow
and SNMP
configuration is
the same as the
following:
59
60.
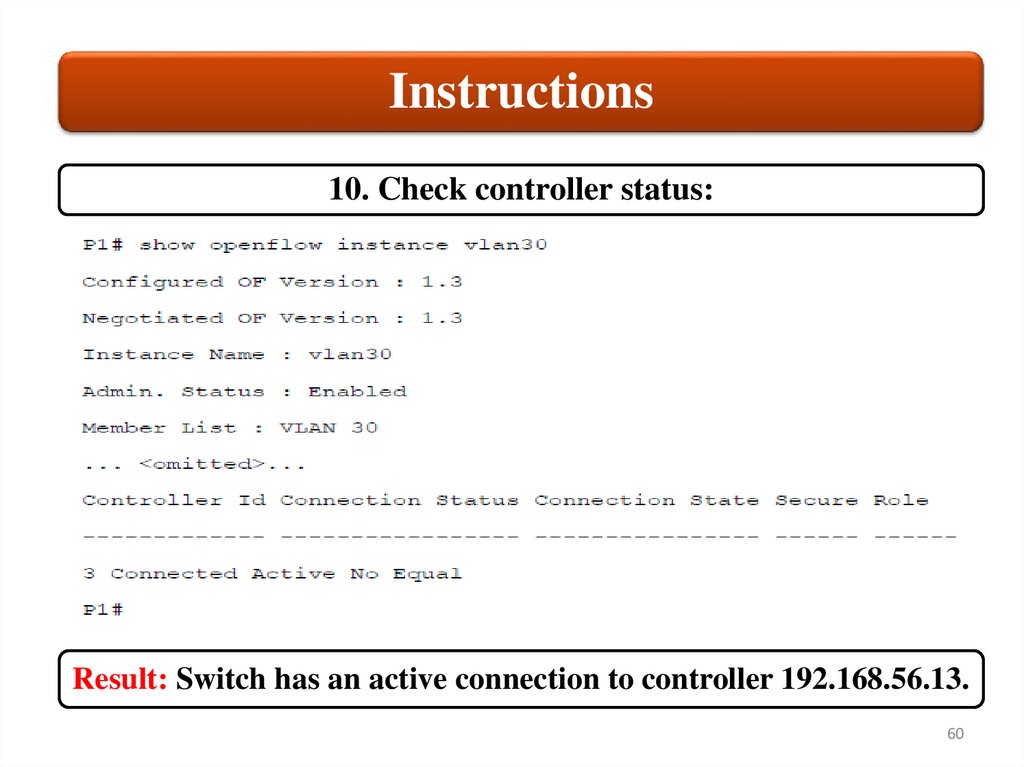
Instructions10. Check controller status:
Result: Switch has an active connection to controller 192.168.56.13.
60
61.
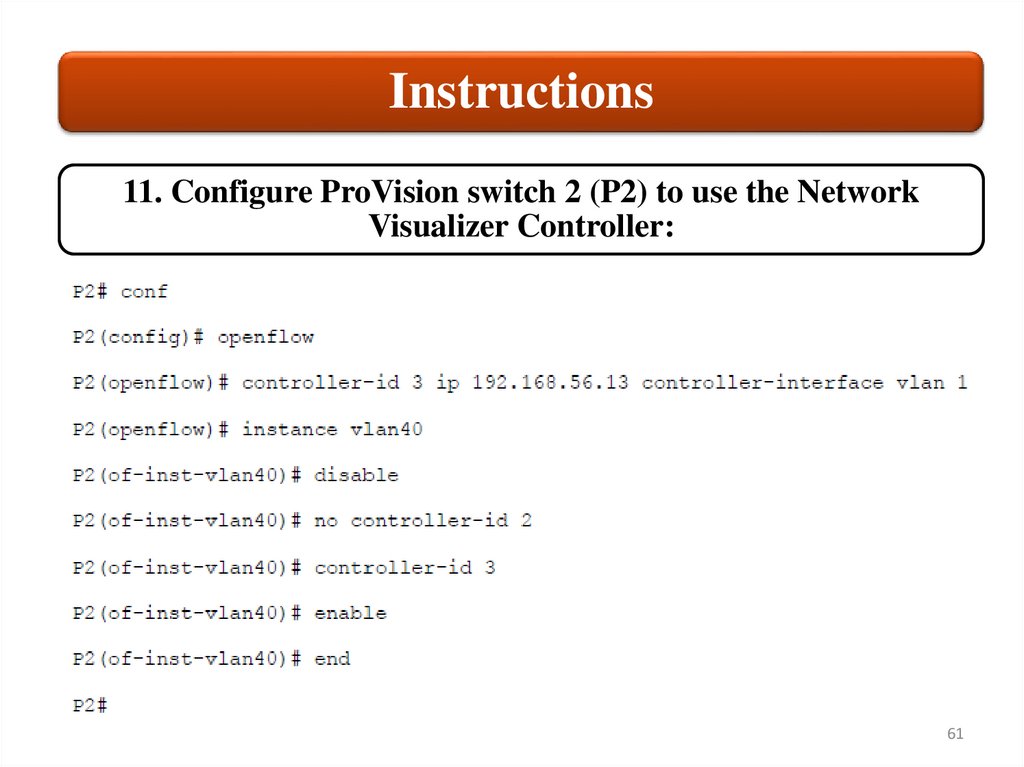
Instructions11. Configure ProVision switch 2 (P2) to use the Network
Visualizer Controller:
61
62.
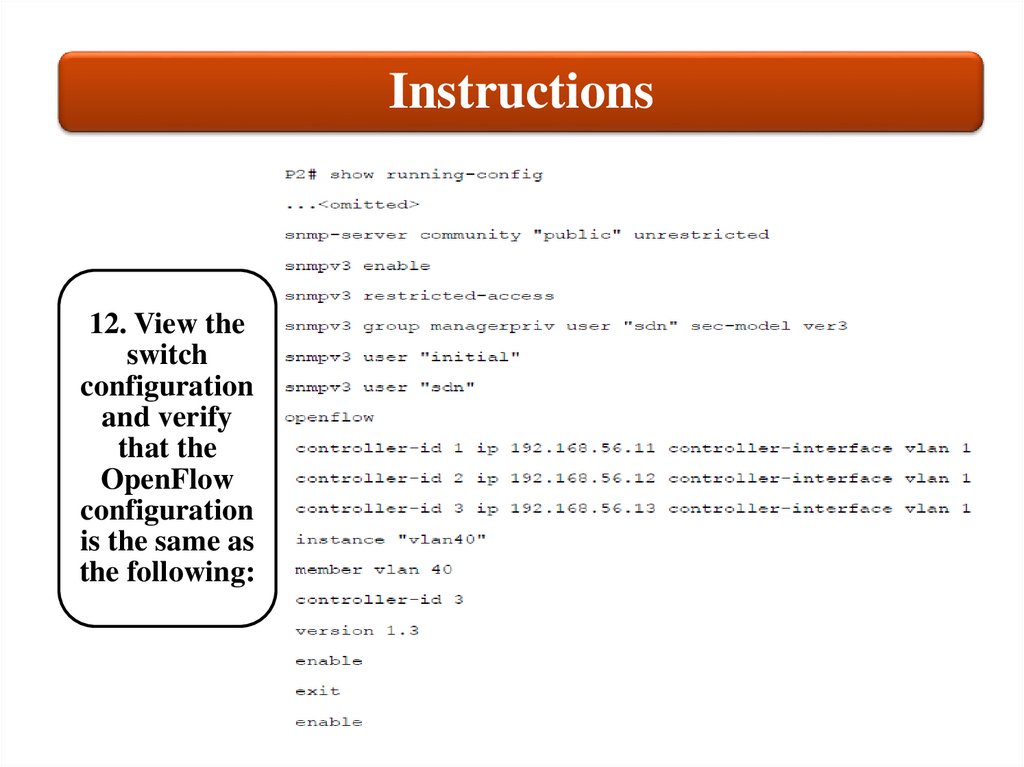
Instructions12. View the
switch
configuration
and verify
that the
OpenFlow
configuration
is the same as
the following:
62
63.
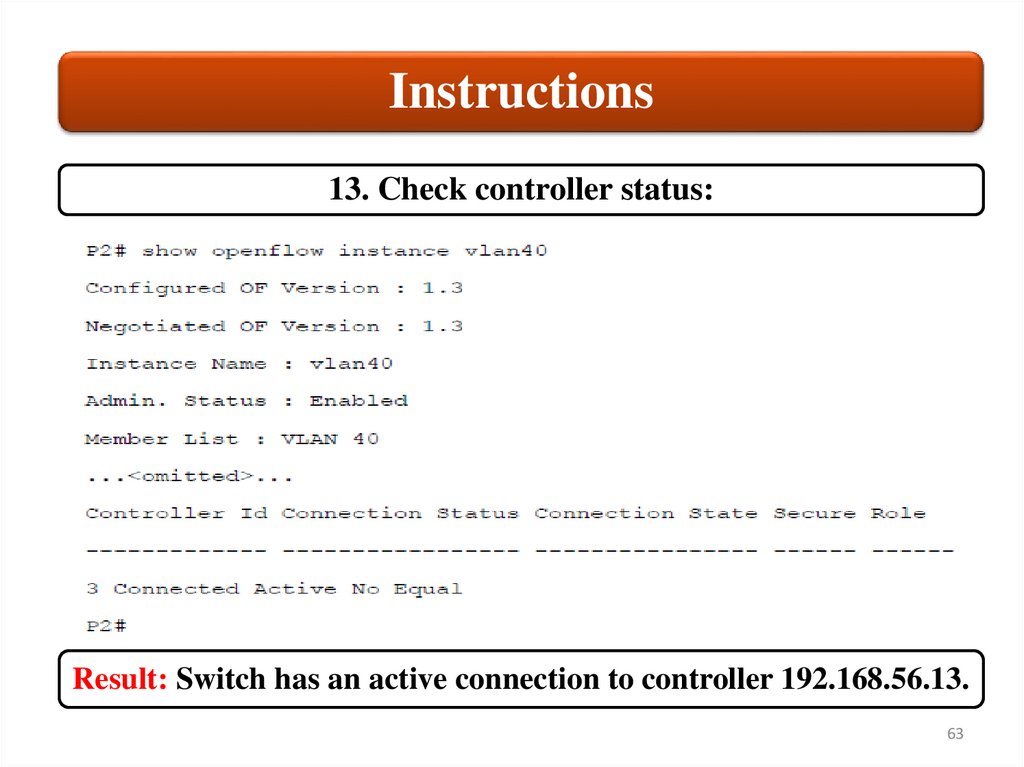
Instructions13. Check controller status:
Result: Switch has an active connection to controller 192.168.56.13.
63
64.
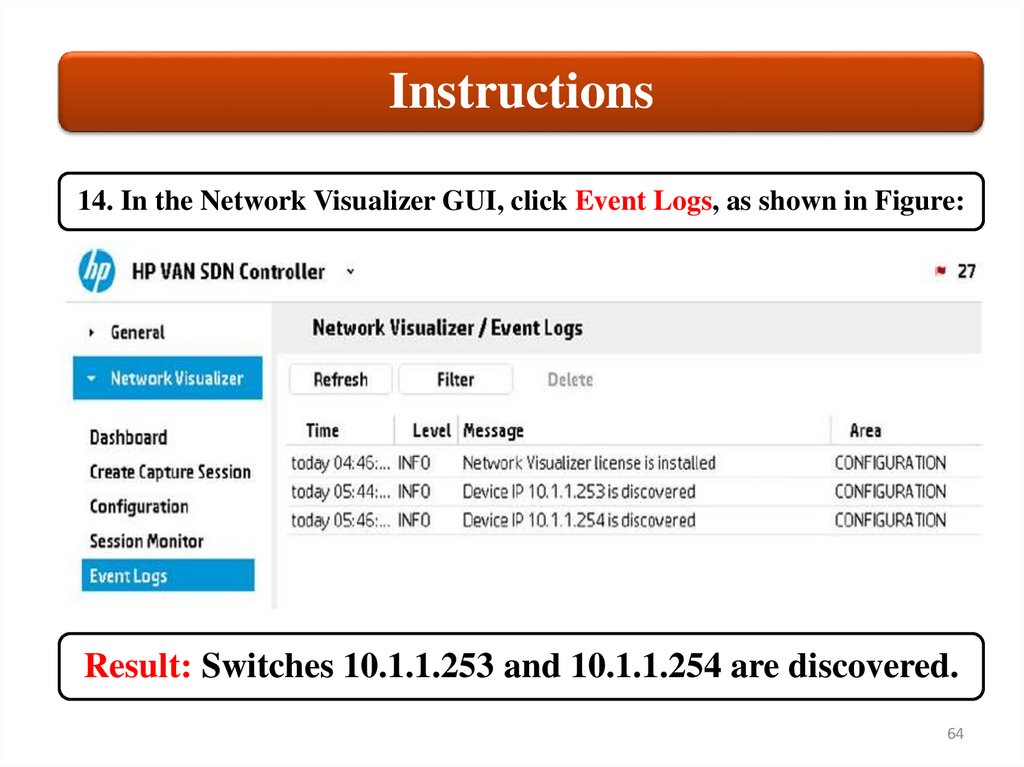
Instructions14. In the Network Visualizer GUI, click Event Logs, as shown in Figure:
Result: Switches 10.1.1.253 and 10.1.1.254 are discovered.
64
65.
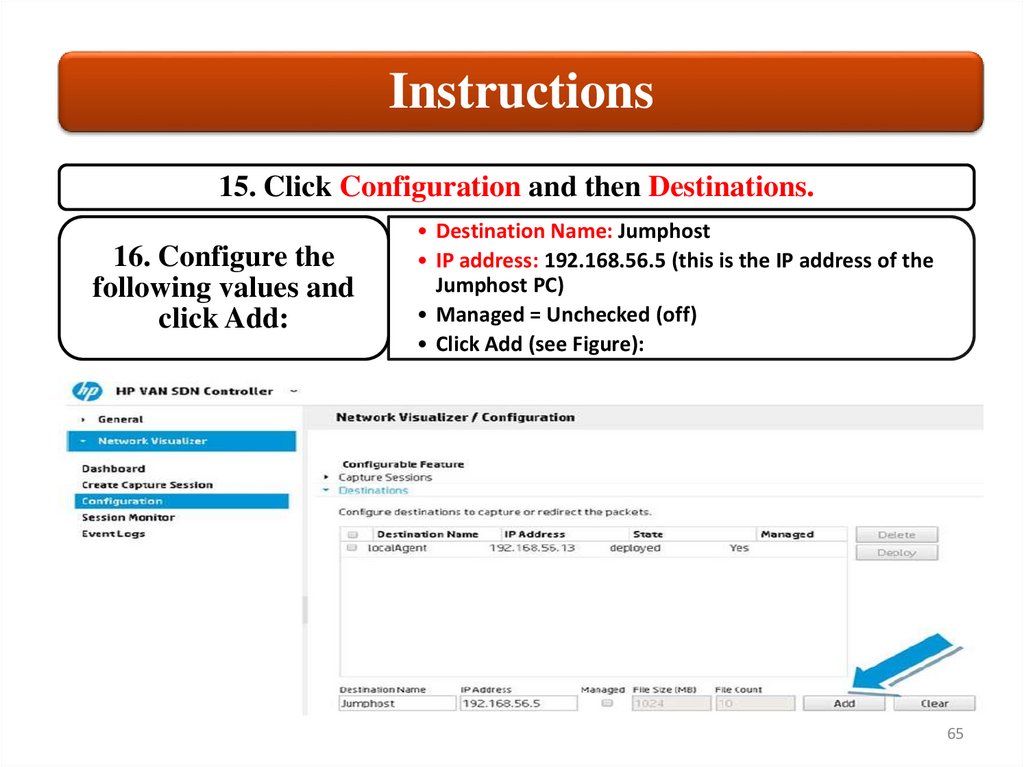
Instructions15. Click Configuration and then Destinations.
16. Configure the
following values and
click Add:
• Destination Name: Jumphost
• IP address: 192.168.56.5 (this is the IP address of the
Jumphost PC)
• Managed = Unchecked (off)
• Click Add (see Figure):
65
66.
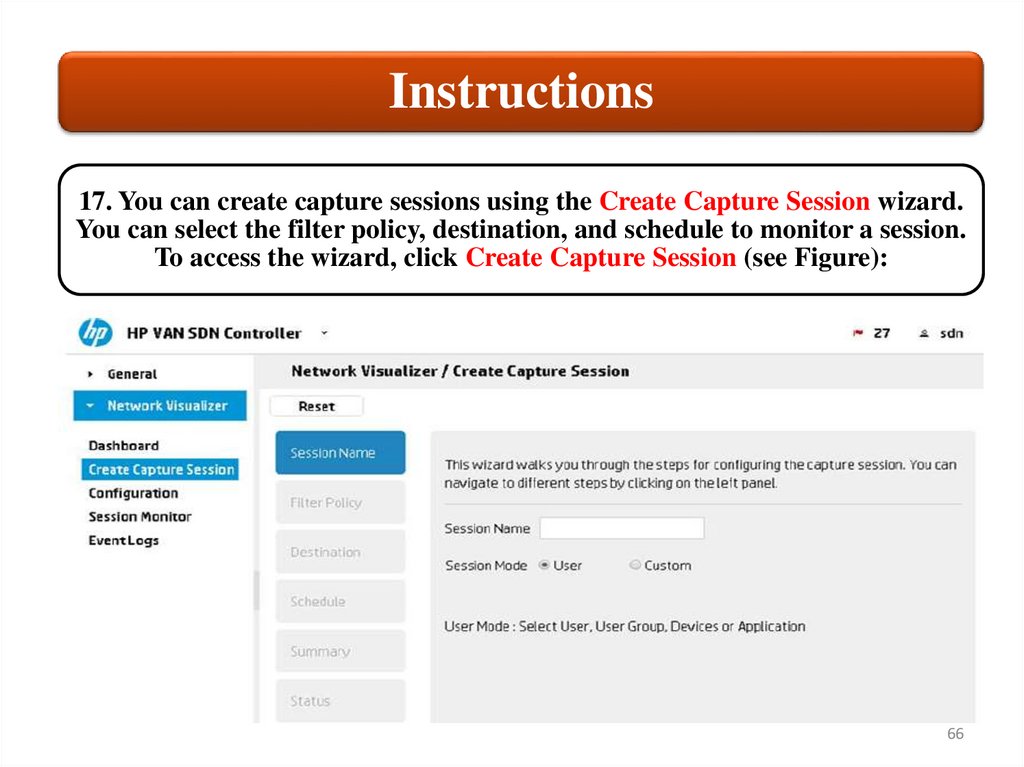
Instructions17. You can create capture sessions using the Create Capture Session wizard.
You can select the filter policy, destination, and schedule to monitor a session.
To access the wizard, click Create Capture Session (see Figure):
66
67.
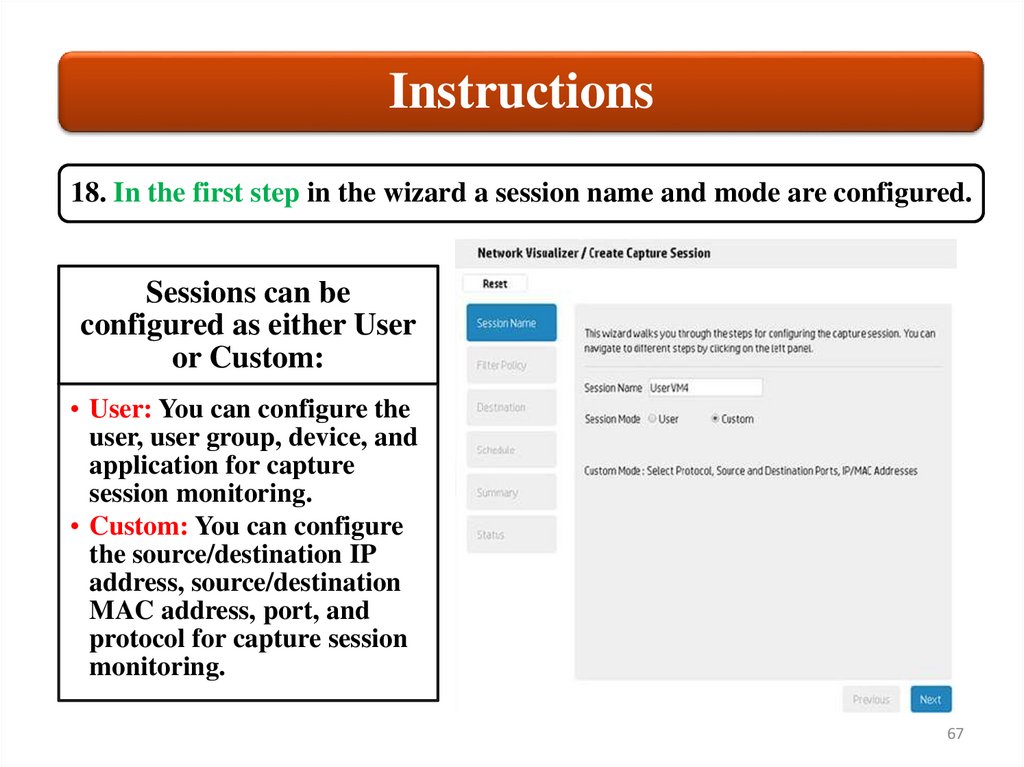
Instructions18. In the first step in the wizard a session name and mode are configured.
Sessions can be
configured as either User
or Custom:
• User: You can configure the
user, user group, device, and
application for capture
session monitoring.
• Custom: You can configure
the source/destination IP
address, source/destination
MAC address, port, and
protocol for capture session
monitoring.
67
68.
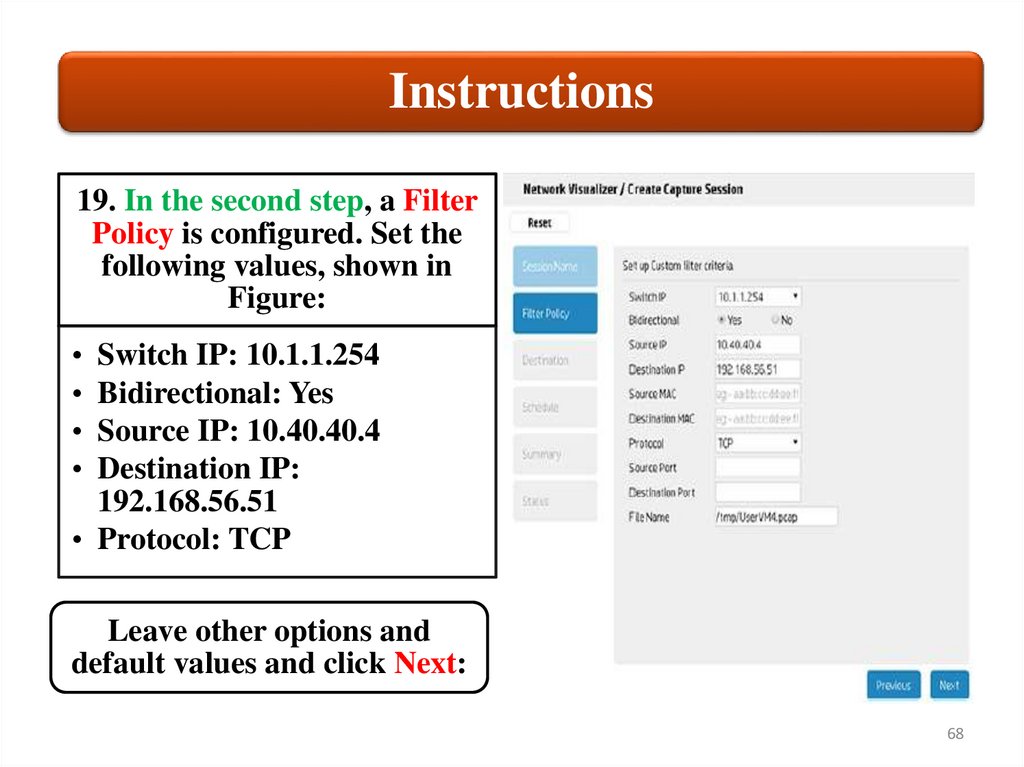
Instructions19. In the second step, a Filter
Policy is configured. Set the
following values, shown in
Figure:
Switch IP: 10.1.1.254
Bidirectional: Yes
Source IP: 10.40.40.4
Destination IP:
192.168.56.51
• Protocol: TCP
Leave other options and
default values and click Next:
68
69.
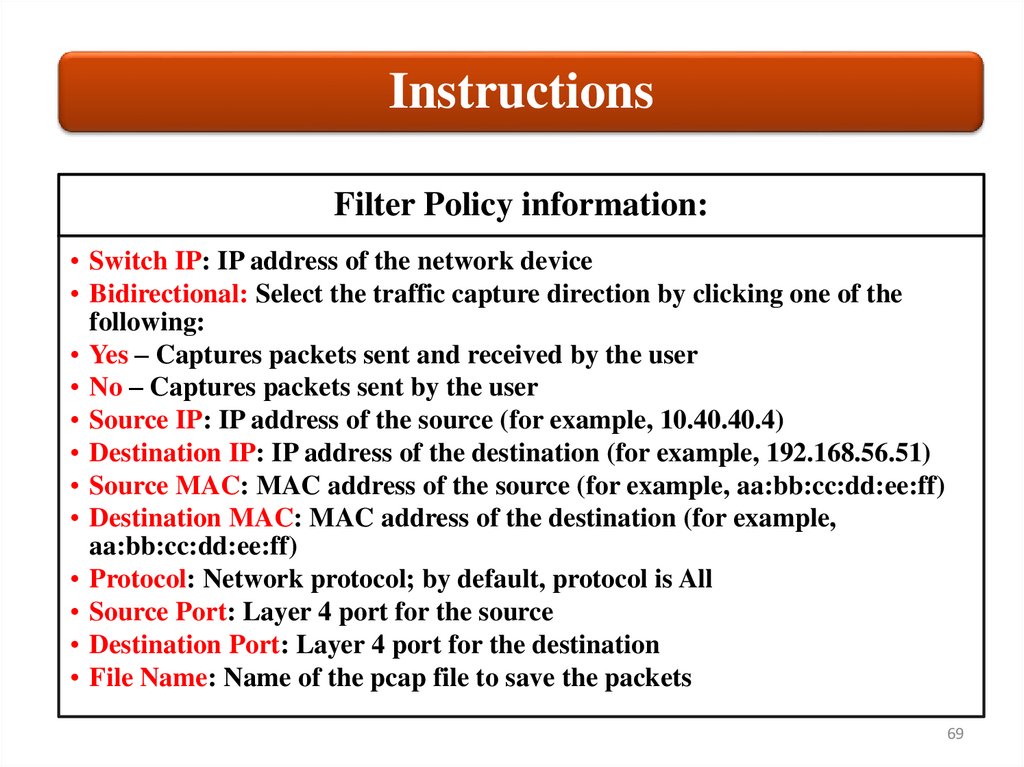
InstructionsFilter Policy information:
• Switch IP: IP address of the network device
• Bidirectional: Select the traffic capture direction by clicking one of the
following:
• Yes – Captures packets sent and received by the user
• No – Captures packets sent by the user
• Source IP: IP address of the source (for example, 10.40.40.4)
• Destination IP: IP address of the destination (for example, 192.168.56.51)
• Source MAC: MAC address of the source (for example, aa:bb:cc:dd:ee:ff)
• Destination MAC: MAC address of the destination (for example,
aa:bb:cc:dd:ee:ff)
• Protocol: Network protocol; by default, protocol is All
• Source Port: Layer 4 port for the source
• Destination Port: Layer 4 port for the destination
• File Name: Name of the pcap file to save the packets
69
70.
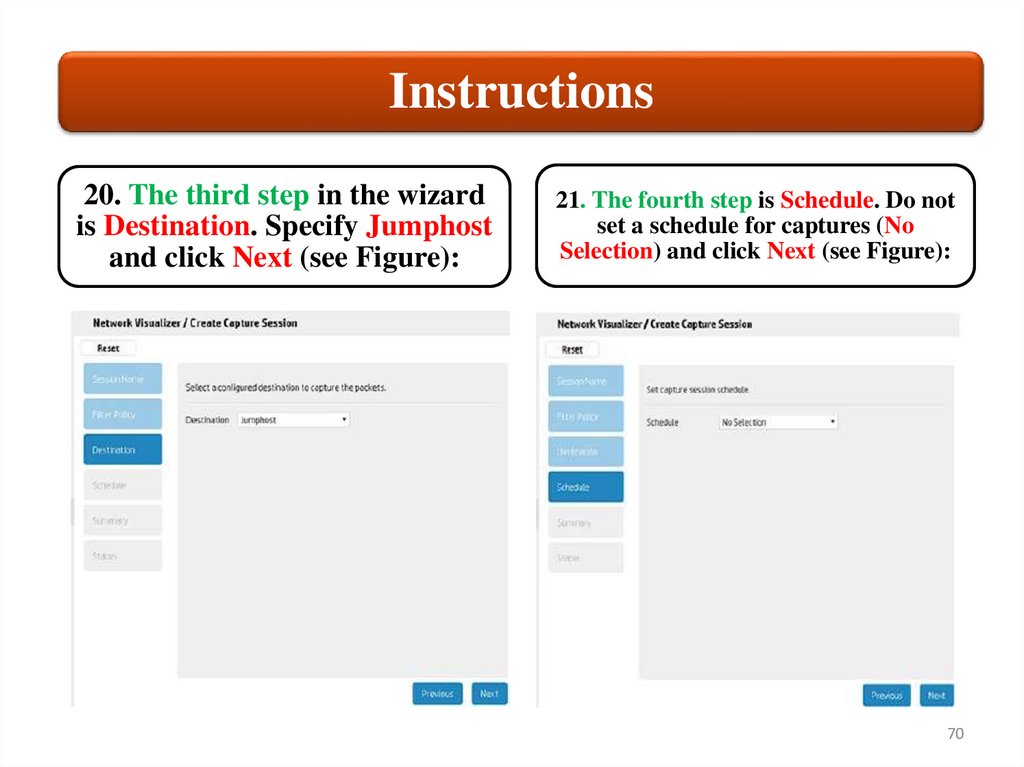
Instructions20. The third step in the wizard
is Destination. Specify Jumphost
and click Next (see Figure):
21. The fourth step is Schedule. Do not
set a schedule for captures (No
Selection) and click Next (see Figure):
70
71.
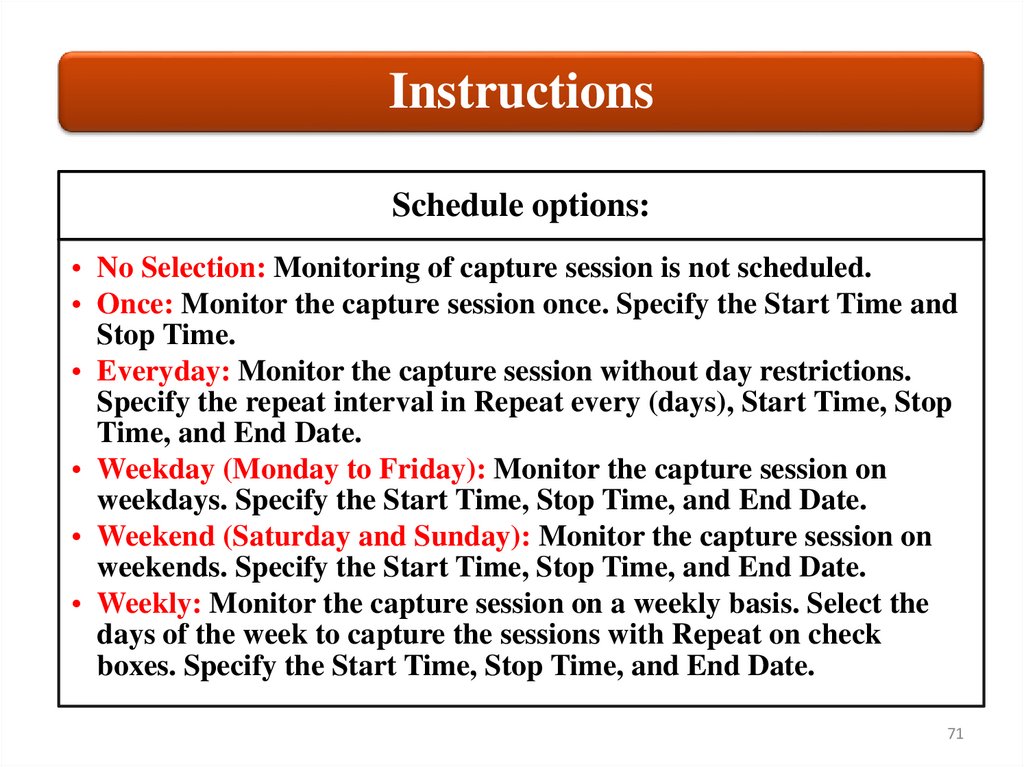
InstructionsSchedule options:
• No Selection: Monitoring of capture session is not scheduled.
• Once: Monitor the capture session once. Specify the Start Time and
Stop Time.
• Everyday: Monitor the capture session without day restrictions.
Specify the repeat interval in Repeat every (days), Start Time, Stop
Time, and End Date.
• Weekday (Monday to Friday): Monitor the capture session on
weekdays. Specify the Start Time, Stop Time, and End Date.
• Weekend (Saturday and Sunday): Monitor the capture session on
weekends. Specify the Start Time, Stop Time, and End Date.
• Weekly: Monitor the capture session on a weekly basis. Select the
days of the week to capture the sessions with Repeat on check
boxes. Specify the Start Time, Stop Time, and End Date.
71
72.
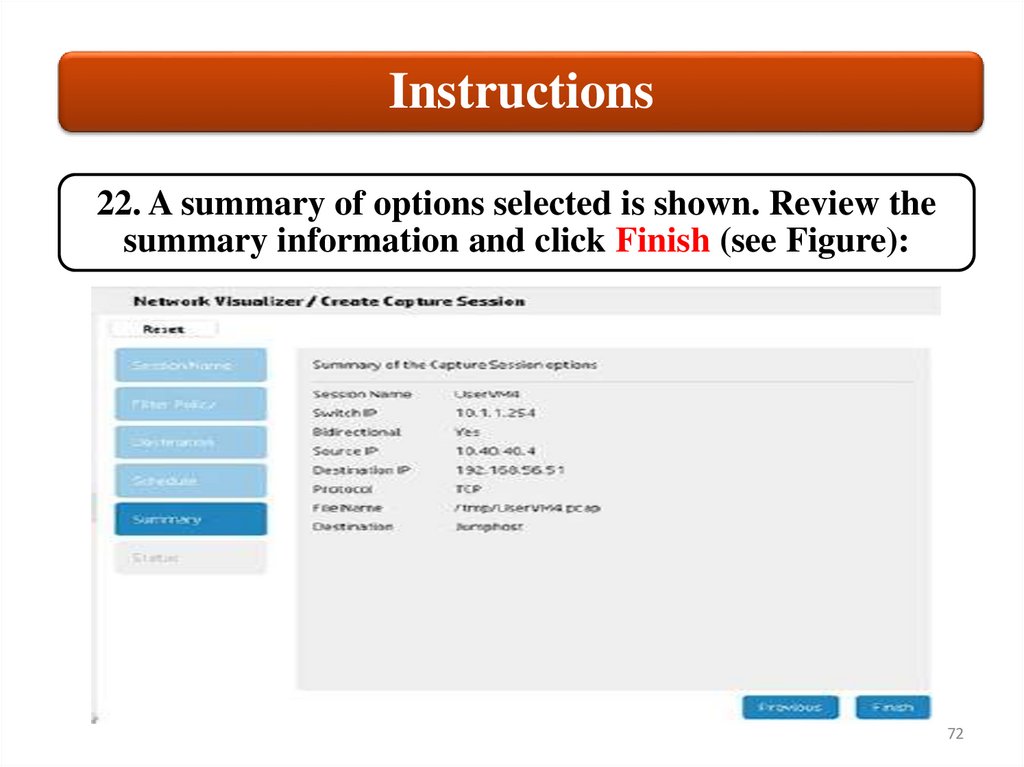
Instructions22. A summary of options selected is shown. Review the
summary information and click Finish (see Figure):
72
73.
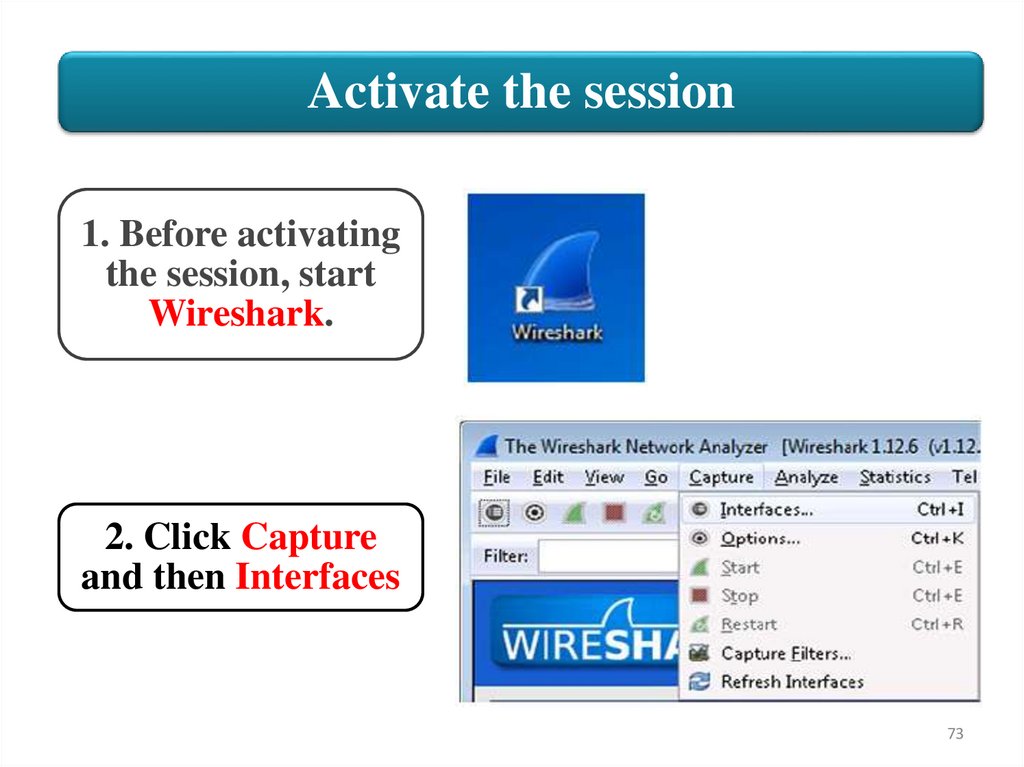
Activate the session1. Before activating
the session, start
Wireshark.
2. Click Capture
and then Interfaces
73
74.
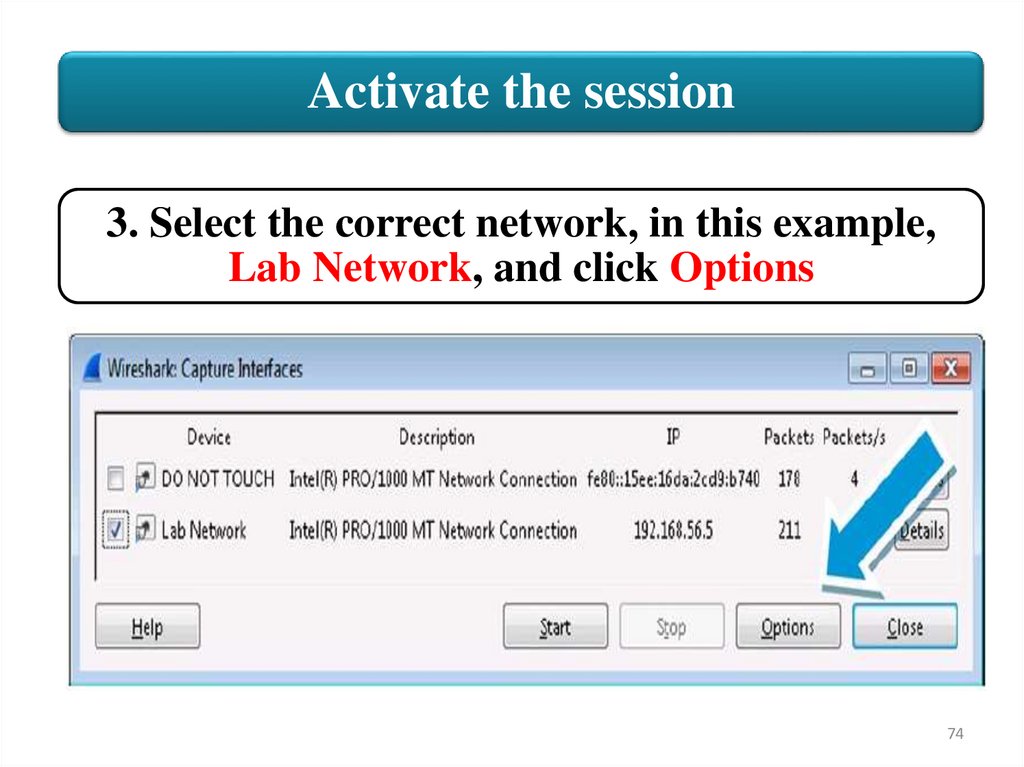
Activate the session3. Select the correct network, in this example,
Lab Network, and click Options
74
75.
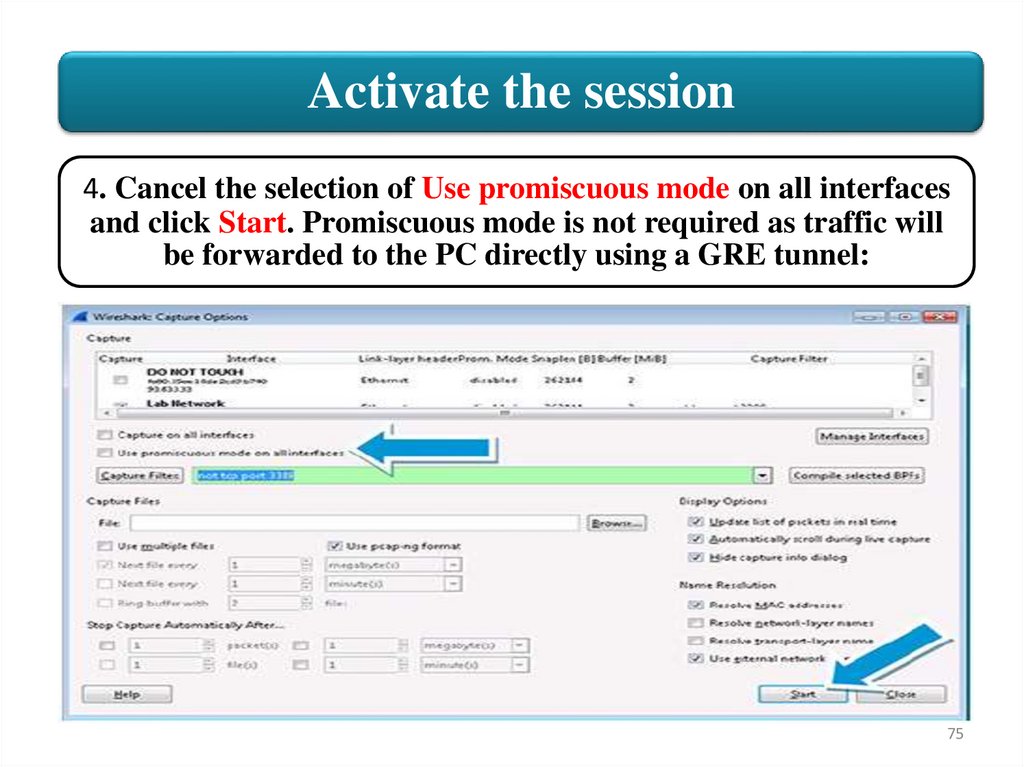
Activate the session4. Cancel the selection of Use promiscuous mode on all interfaces
and click Start. Promiscuous mode is not required as traffic will
be forwarded to the PC directly using a GRE tunnel:
75
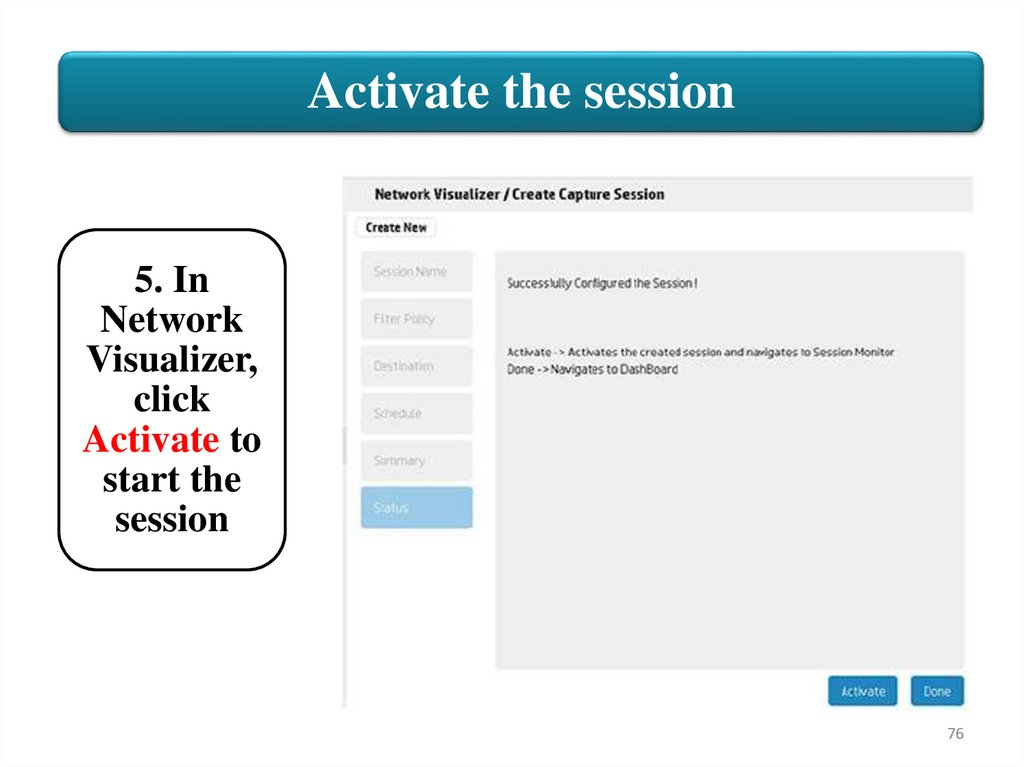
76.
Activate the session5. In
Network
Visualizer,
click
Activate to
start the
session
76
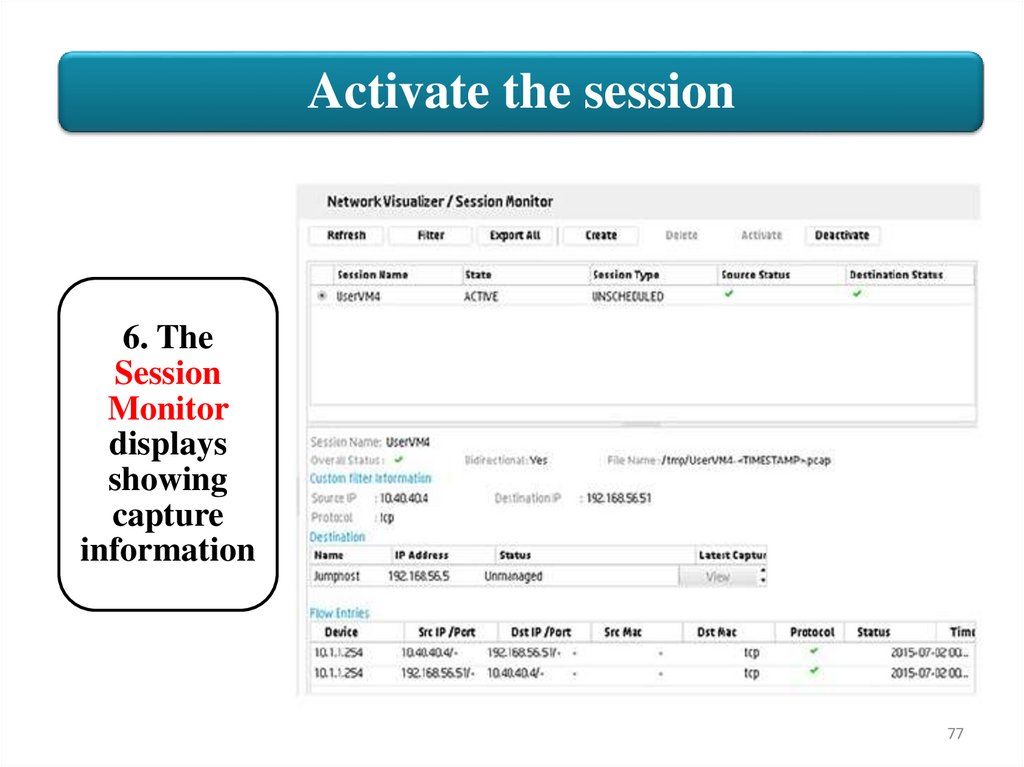
77.
Activate the session6. The
Session
Monitor
displays
showing
capture
information
77
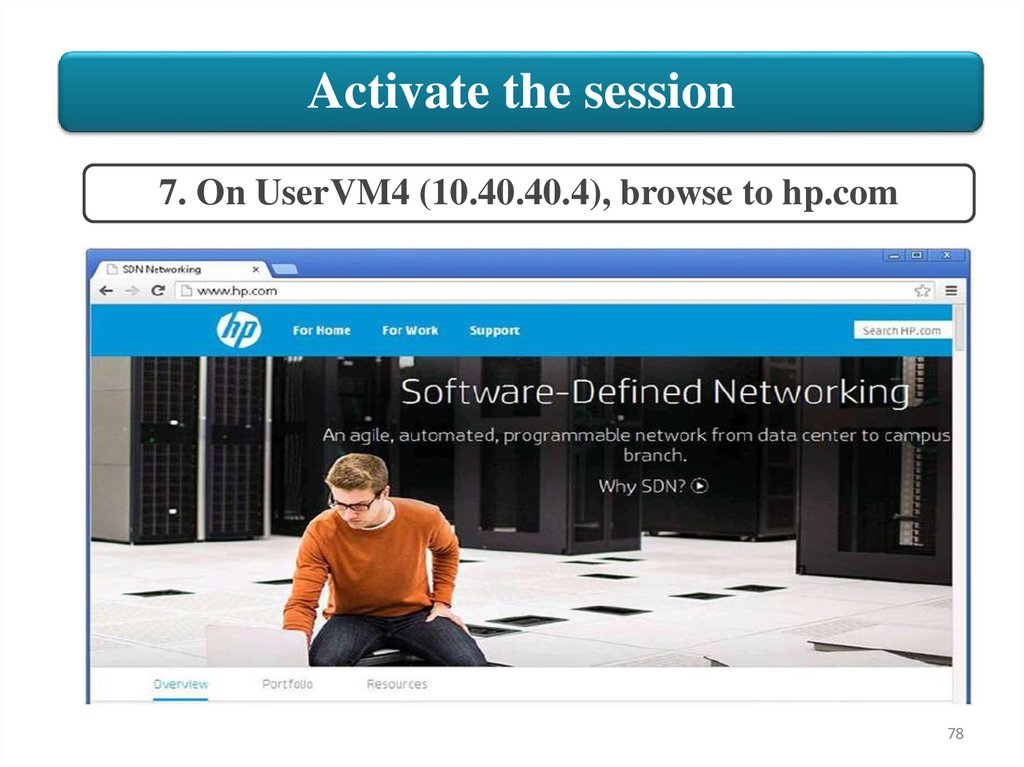
78.
Activate the session7. On UserVM4 (10.40.40.4), browse to hp.com
78
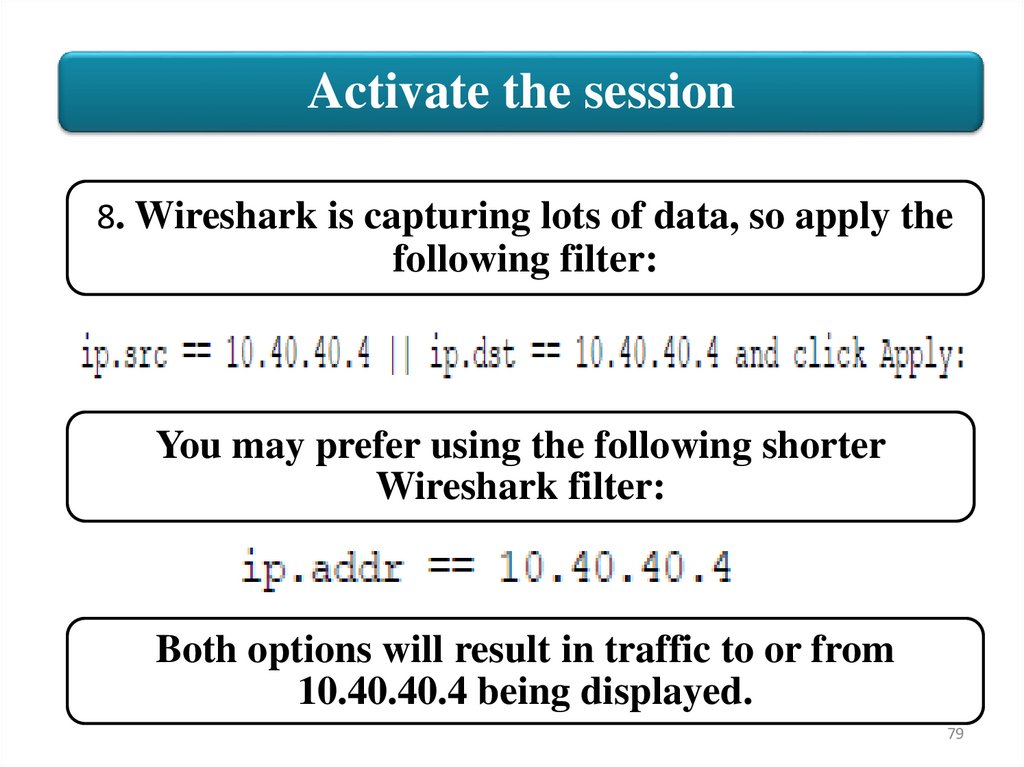
79.
Activate the session8. Wireshark is capturing lots of data, so apply the
following filter:
You may prefer using the following shorter
Wireshark filter:
Both options will result in traffic to or from
10.40.40.4 being displayed.
79
80.
Activate the session80
81.
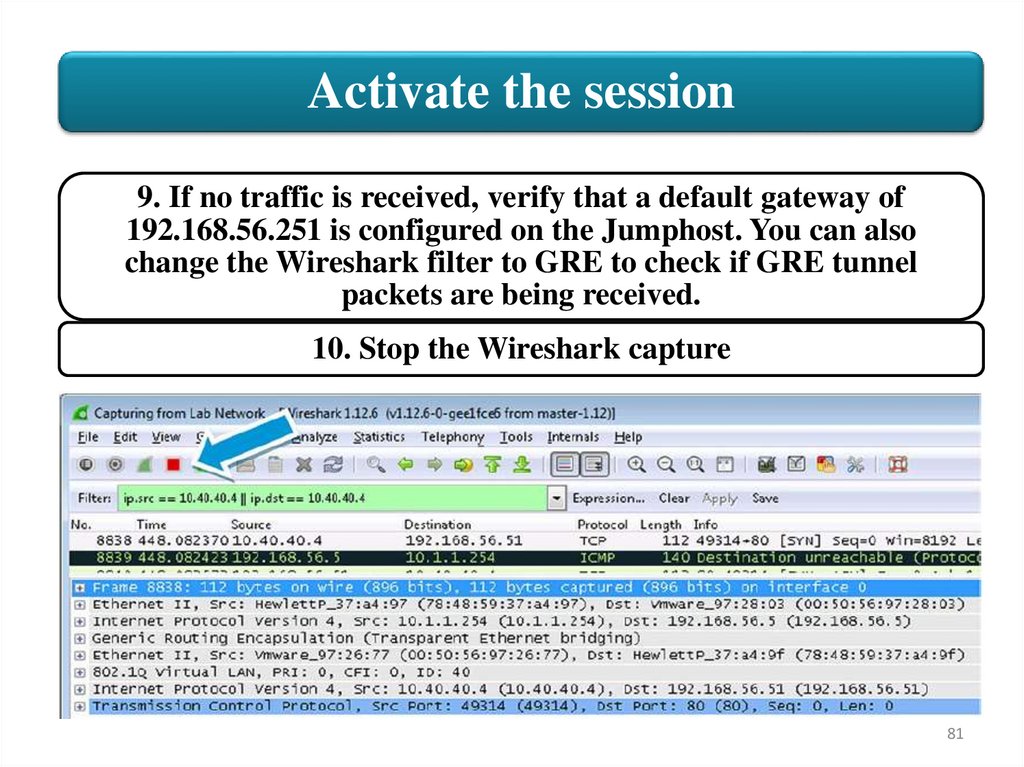
Activate the session9. If no traffic is received, verify that a default gateway of
192.168.56.251 is configured on the Jumphost. You can also
change the Wireshark filter to GRE to check if GRE tunnel
packets are being received.
10. Stop the Wireshark capture
81
82.
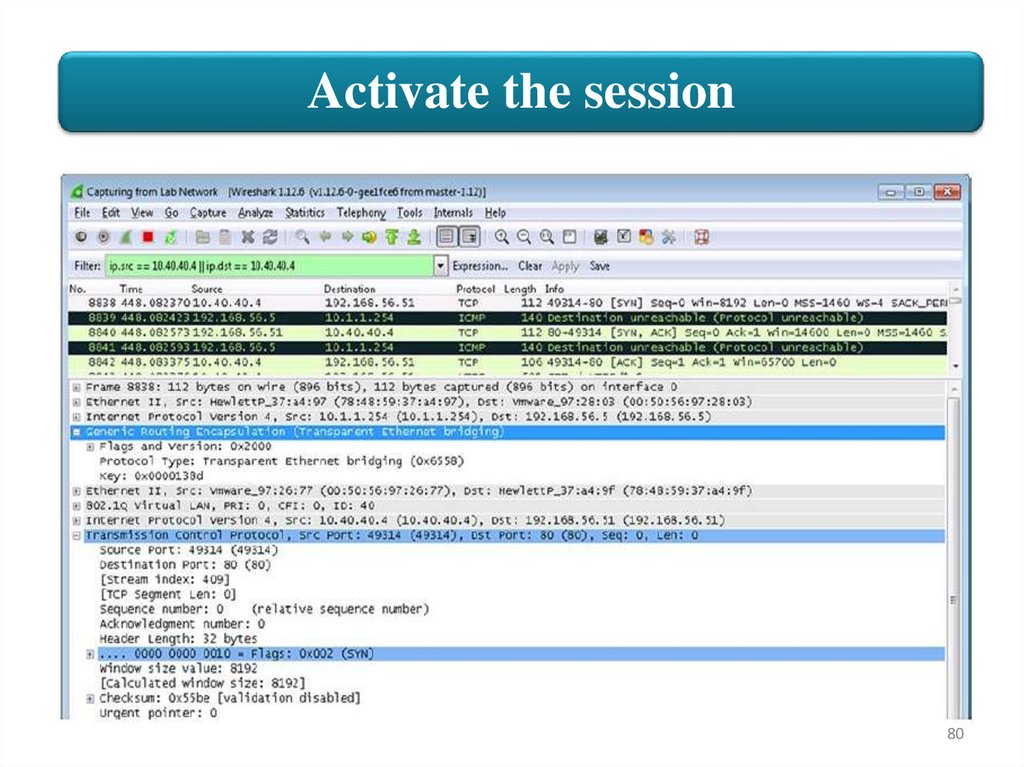
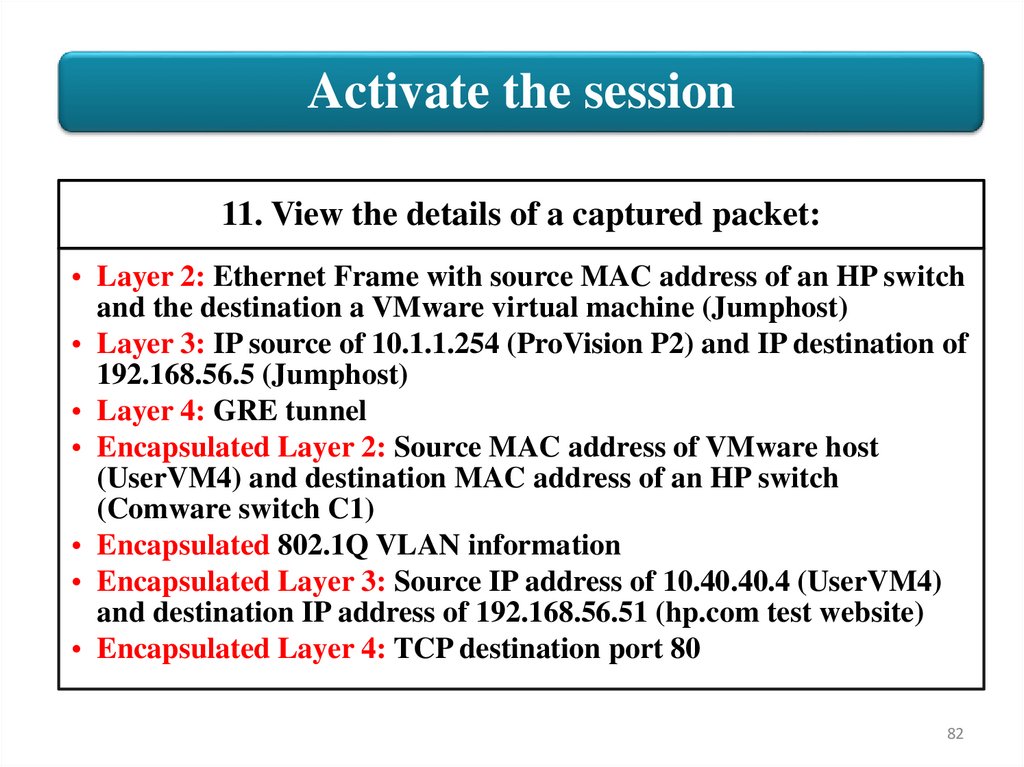
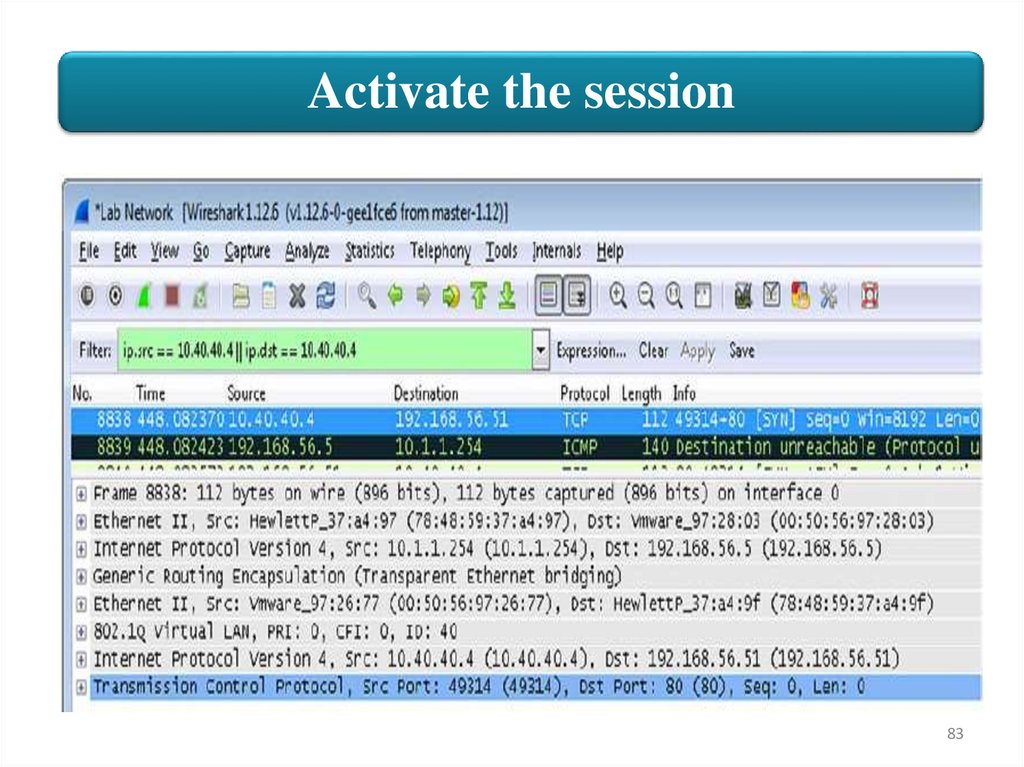
Activate the session11. View the details of a captured packet:
• Layer 2: Ethernet Frame with source MAC address of an HP switch
and the destination a VMware virtual machine (Jumphost)
• Layer 3: IP source of 10.1.1.254 (ProVision P2) and IP destination of
192.168.56.5 (Jumphost)
• Layer 4: GRE tunnel
• Encapsulated Layer 2: Source MAC address of VMware host
(UserVM4) and destination MAC address of an HP switch
(Comware switch C1)
• Encapsulated 802.1Q VLAN information
• Encapsulated Layer 3: Source IP address of 10.40.40.4 (UserVM4)
and destination IP address of 192.168.56.51 (hp.com test website)
• Encapsulated Layer 4: TCP destination port 80
82
83.
Activate the session83
84.
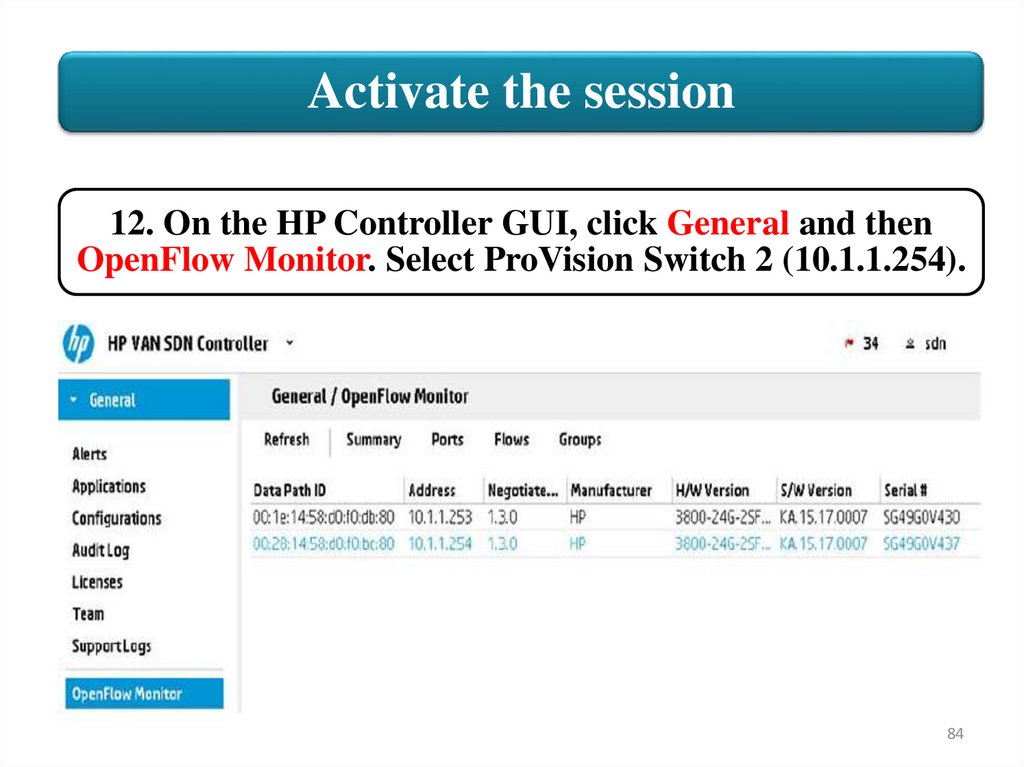
Activate the session12. On the HP Controller GUI, click General and then
OpenFlow Monitor. Select ProVision Switch 2 (10.1.1.254).
84
85.
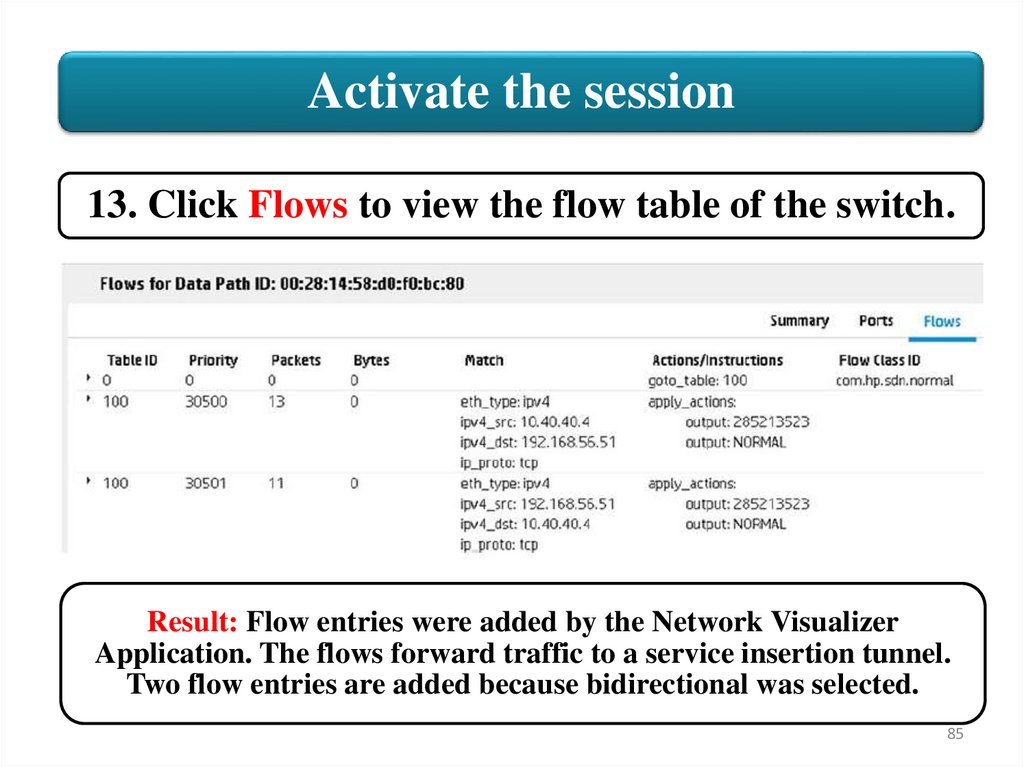
Activate the session13. Click Flows to view the flow table of the switch.
Result: Flow entries were added by the Network Visualizer
Application. The flows forward traffic to a service insertion tunnel.
Two flow entries are added because bidirectional was selected.
85
86.
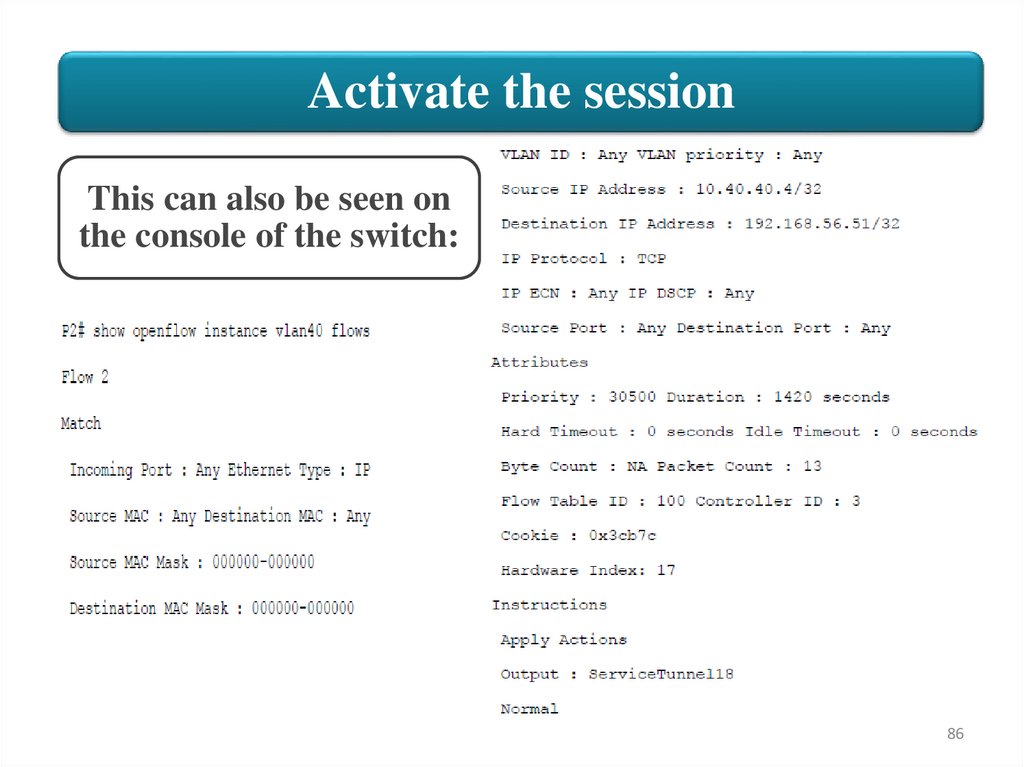
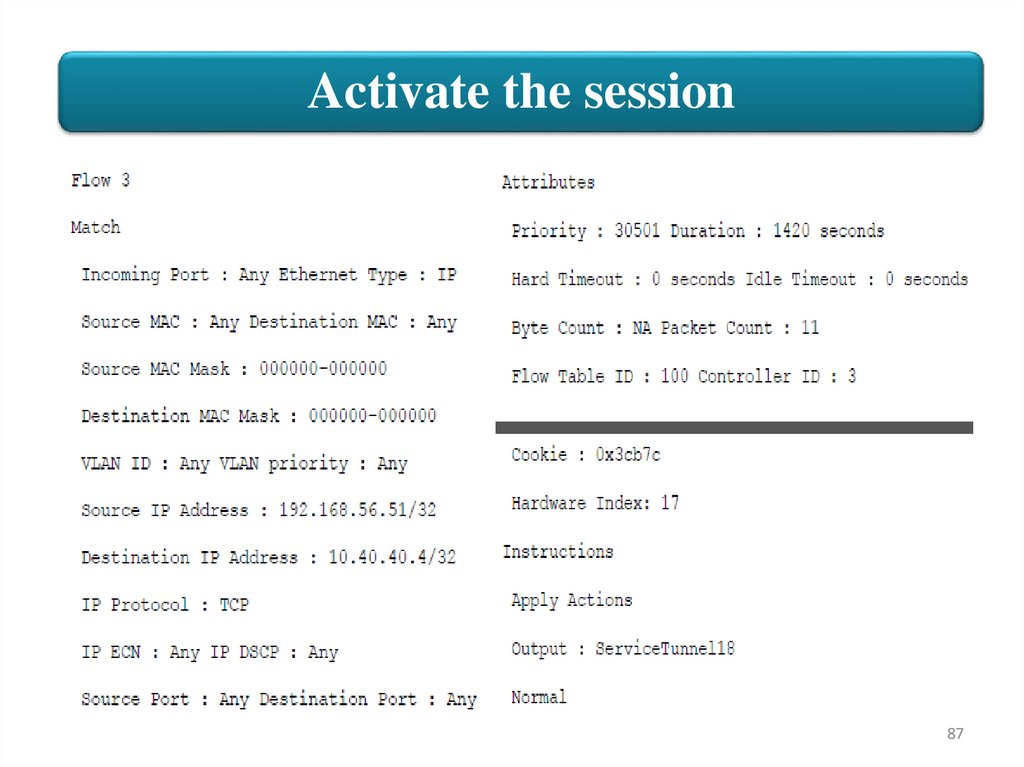
Activate the sessionThis can also be seen on
the console of the switch:
86
87.
Activate the session87
88.
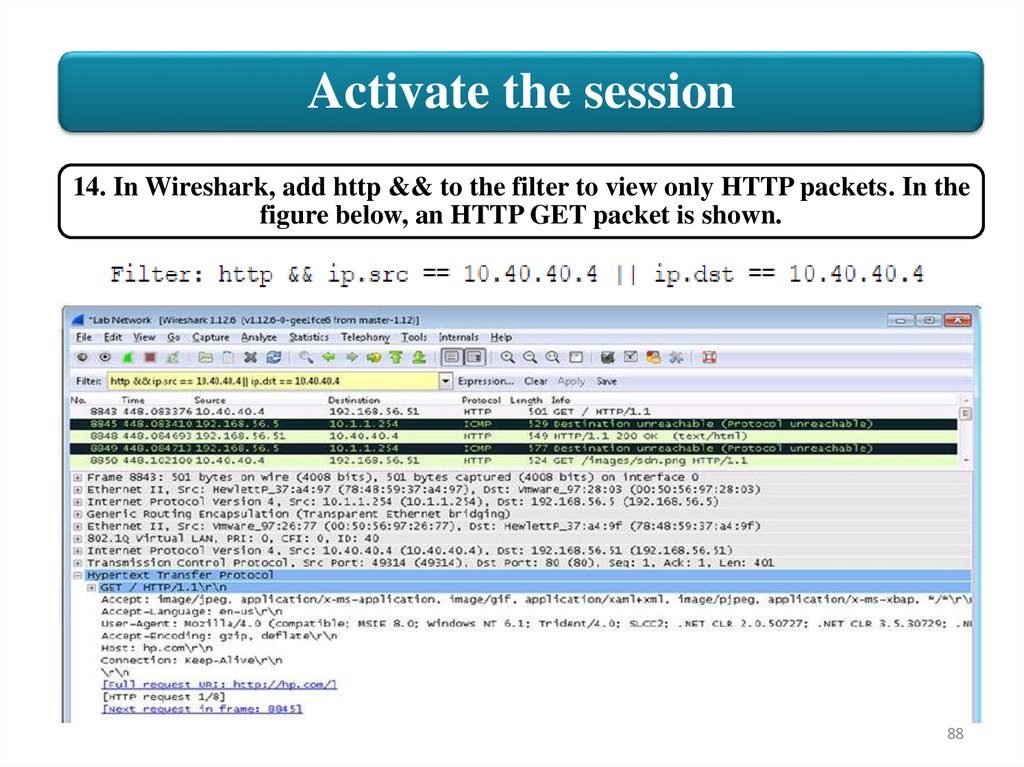
Activate the session14. In Wireshark, add http && to the filter to view only HTTP packets. In the
figure below, an HTTP GET packet is shown.
88
89.
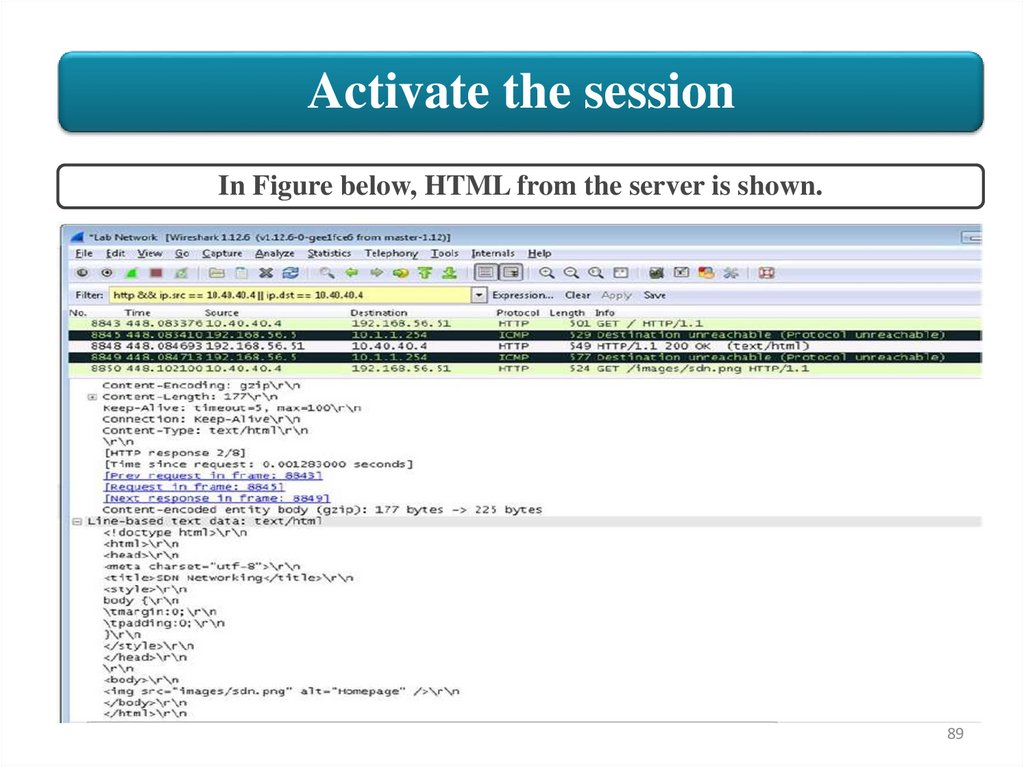
Activate the sessionIn Figure below, HTML from the server is shown.
89
90.
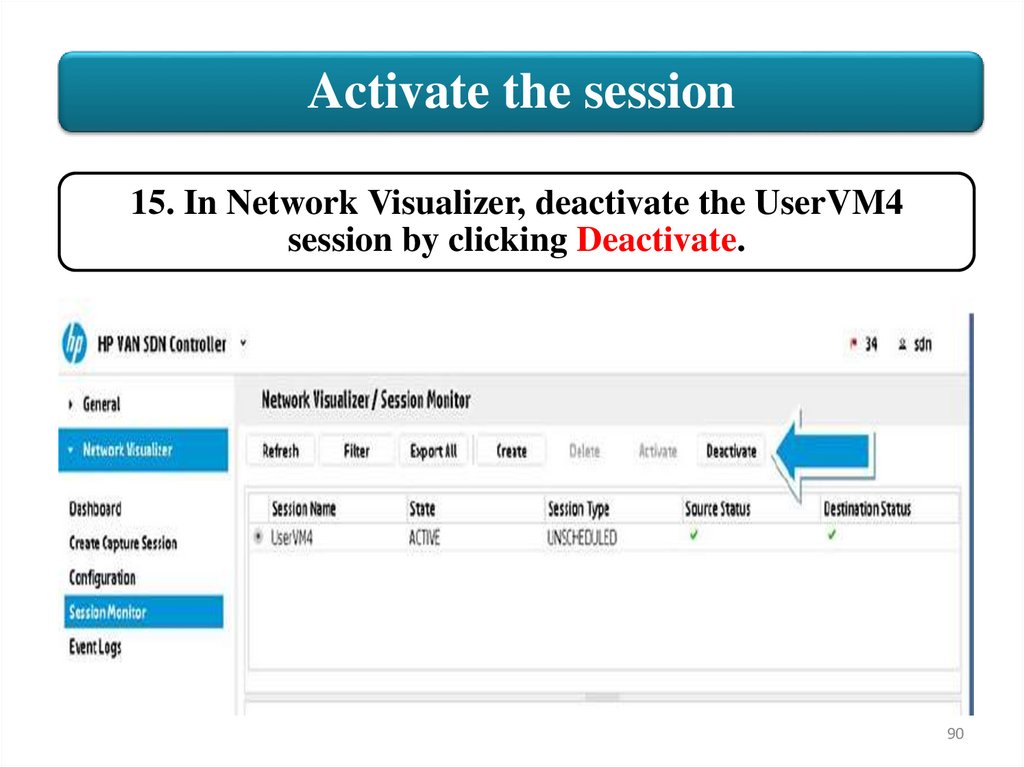
Activate the session15. In Network Visualizer, deactivate the UserVM4
session by clicking Deactivate.
90
91.
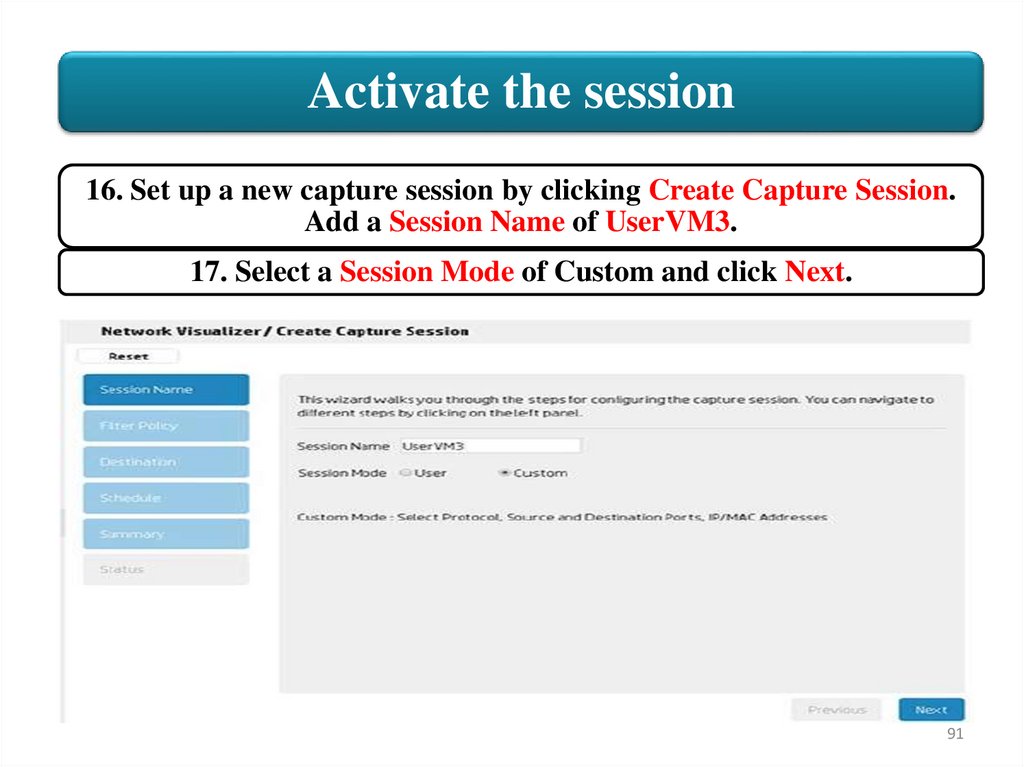
Activate the session16. Set up a new capture session by clicking Create Capture Session.
Add a Session Name of UserVM3.
17. Select a Session Mode of Custom and click Next.
91
92.
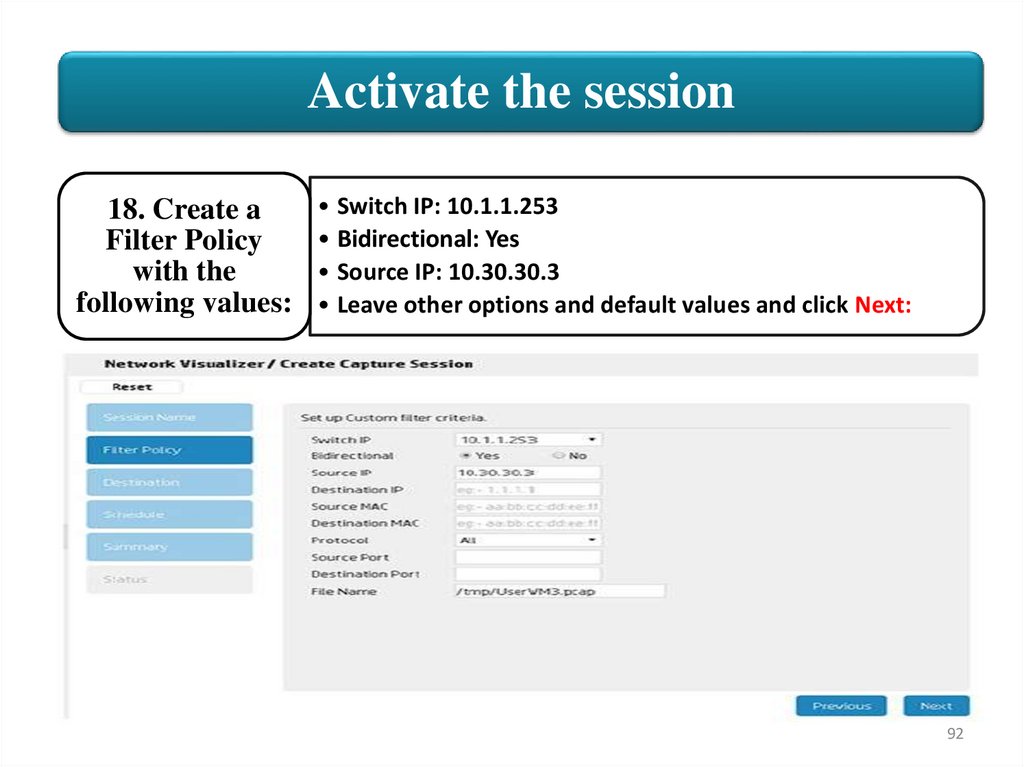
Activate the session18. Create a
Filter Policy
with the
following values:
• Switch IP: 10.1.1.253
• Bidirectional: Yes
• Source IP: 10.30.30.3
• Leave other options and default values and click Next:
92
93.
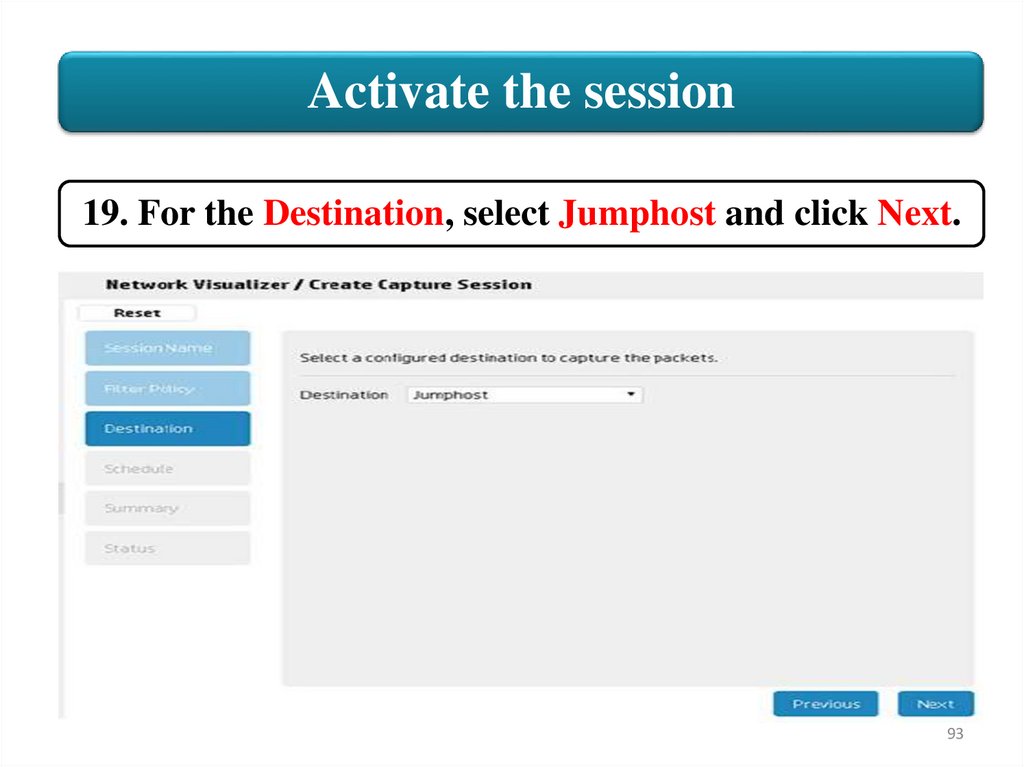
Activate the session19. For the Destination, select Jumphost and click Next.
93
94.
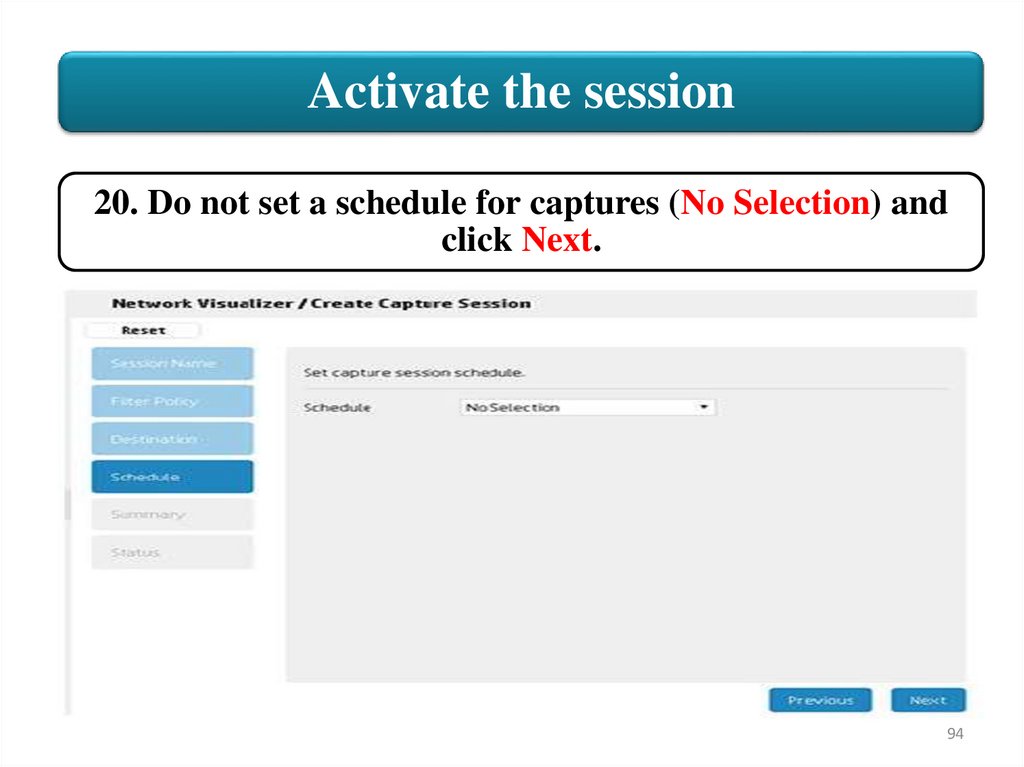
Activate the session20. Do not set a schedule for captures (No Selection) and
click Next.
94
95.
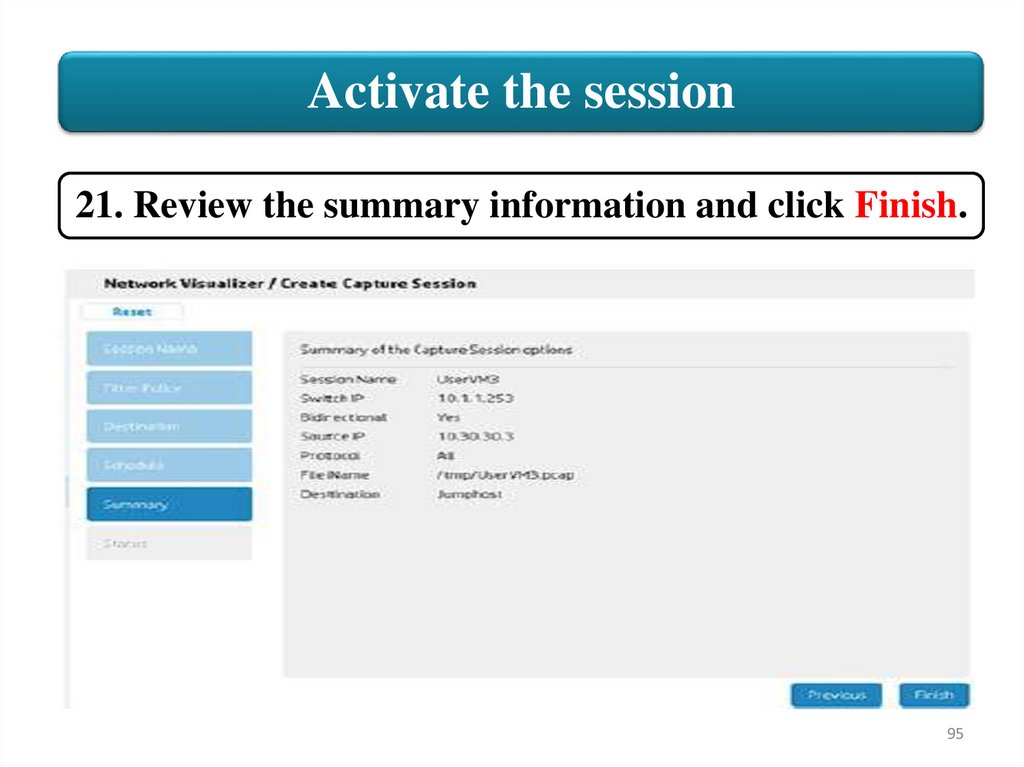
Activate the session21. Review the summary information and click Finish.
95
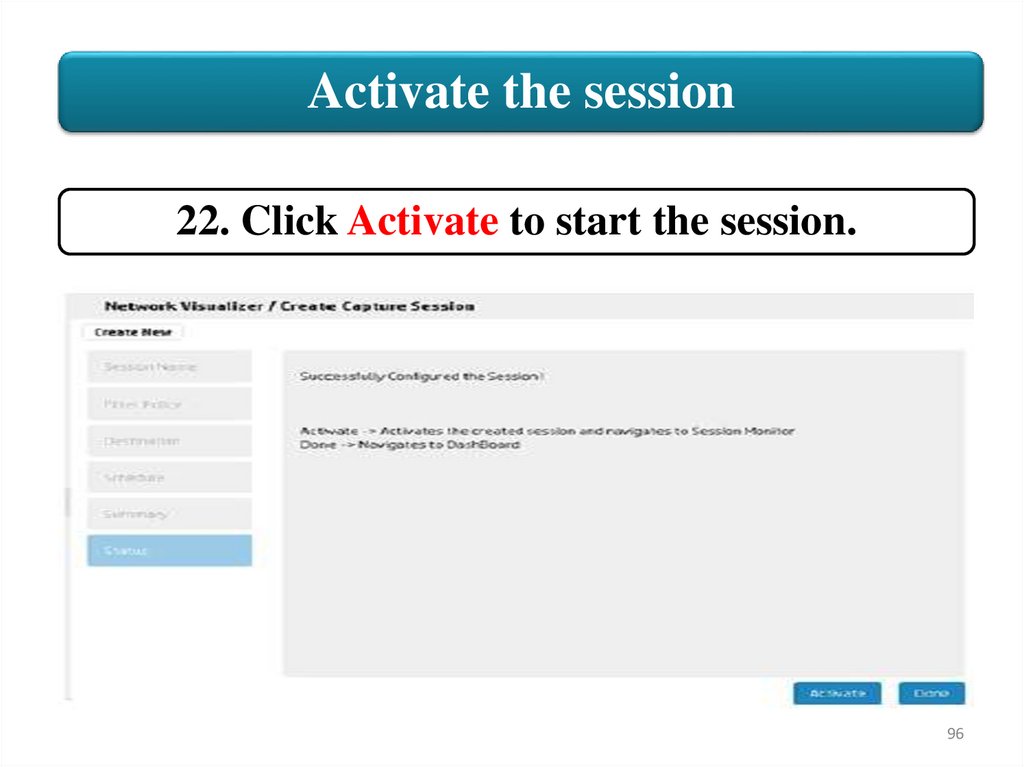
96.
Activate the session22. Click Activate to start the session.
96
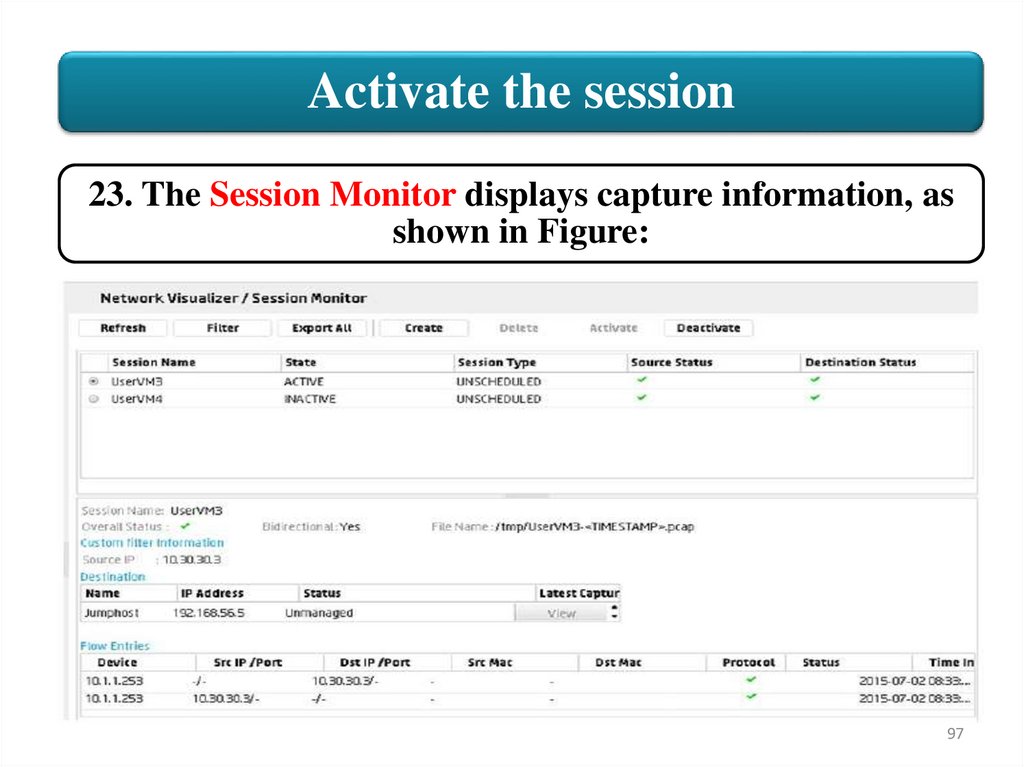
97.
Activate the session23. The Session Monitor displays capture information, as
shown in Figure:
97
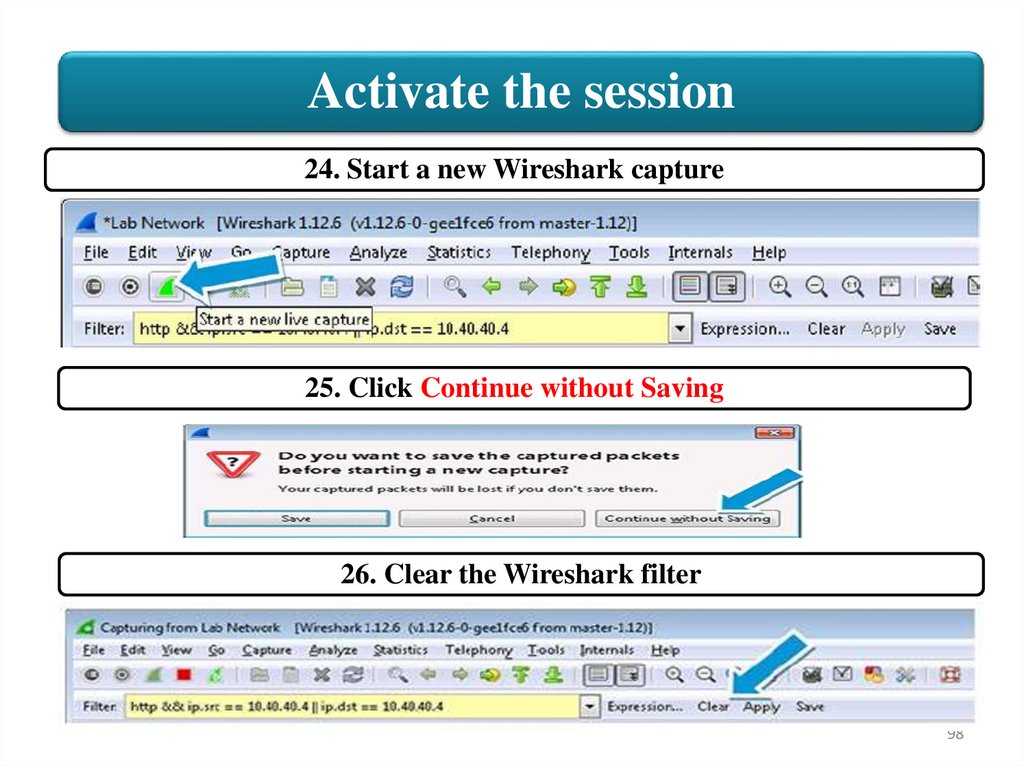
98.
Activate the session24. Start a new Wireshark capture
25. Click Continue without Saving
26. Clear the Wireshark filter
98
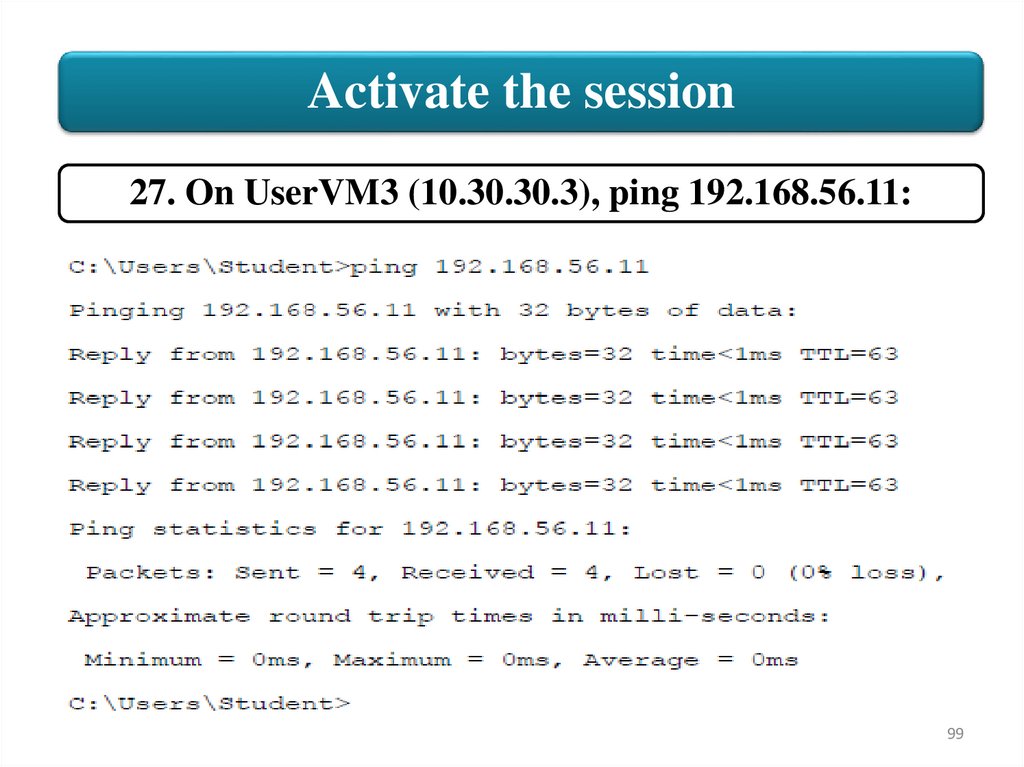
99.
Activate the session27. On UserVM3 (10.30.30.3), ping 192.168.56.11:
99
100.
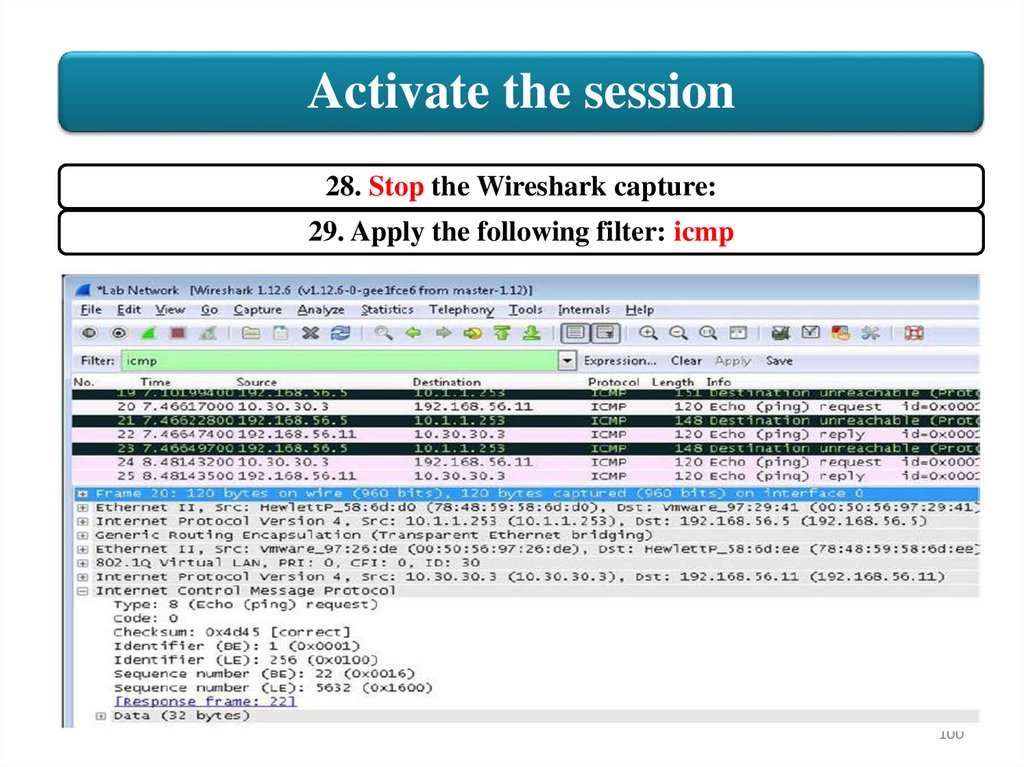
Activate the session28. Stop the Wireshark capture:
29. Apply the following filter: icmp
100
101.
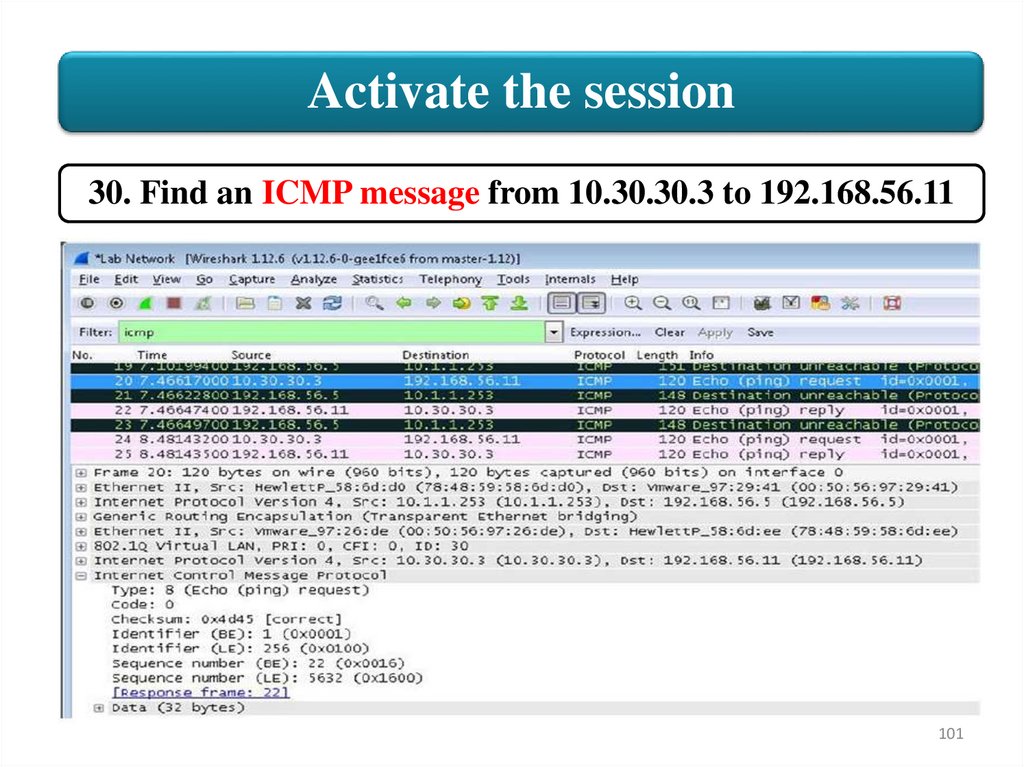
Activate the session30. Find an ICMP message from 10.30.30.3 to 192.168.56.11
101
102.
Activate the sessionIn Figure above the following can be seen:
• Layer 2: Ethernet Frame with source MAC address of an HP switch
and the destination a Vmware virtual machine (Jumphost)
• Layer 3: IP source of 10.1.1.253 (ProVision S1) and IP destination of
192.168.56.5 (Jumphost)
• Layer 4: GRE tunnel
• Encapsulated Layer 2: Source MAC address of VMware host
(UserVM3) and destination MAC address of an HP switch
(Comware switch 1)
• Encapsulated 802.1Q VLAN information
• Encapsulated Layer 3: Source IP address of 10.30.30.3 (UserVM4)
and destination IP address of 192.168.56.11 (HP VAN SDN
Controller)
• Encapsulated Layer 4: ICMP echo request message
102
103.
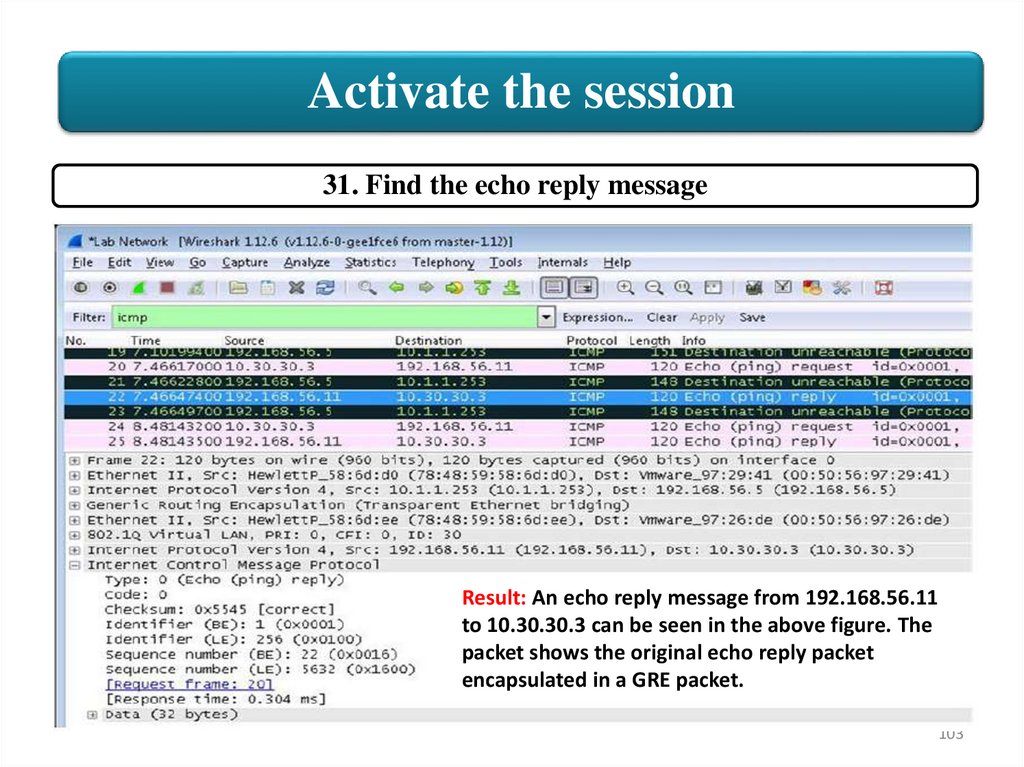
Activate the session31. Find the echo reply message
Result: An echo reply message from 192.168.56.11
to 10.30.30.3 can be seen in the above figure. The
packet shows the original echo reply packet
encapsulated in a GRE packet.
103
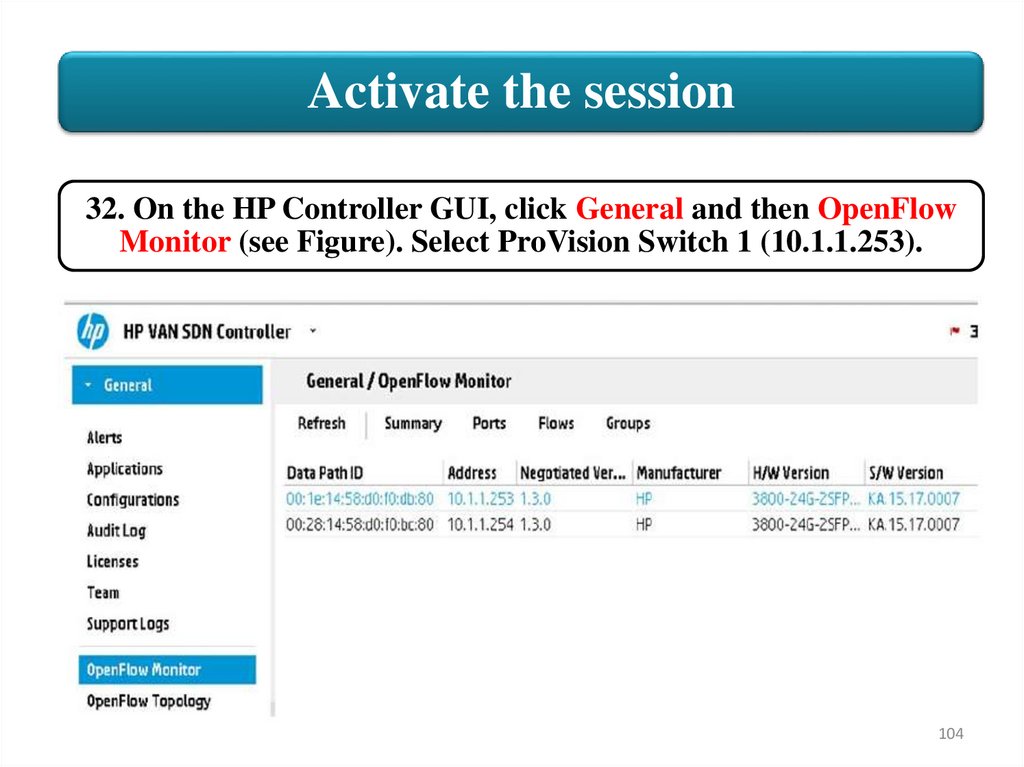
104.
Activate the session32. On the HP Controller GUI, click General and then OpenFlow
Monitor (see Figure). Select ProVision Switch 1 (10.1.1.253).
104
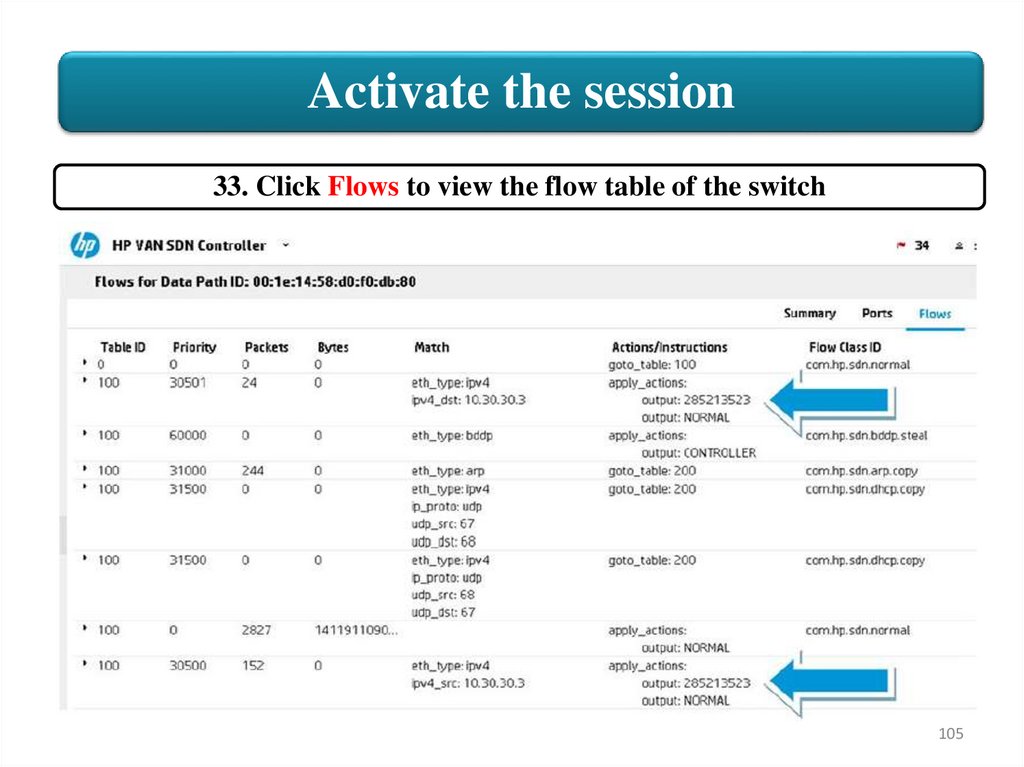
105.
Activate the session33. Click Flows to view the flow table of the switch
105
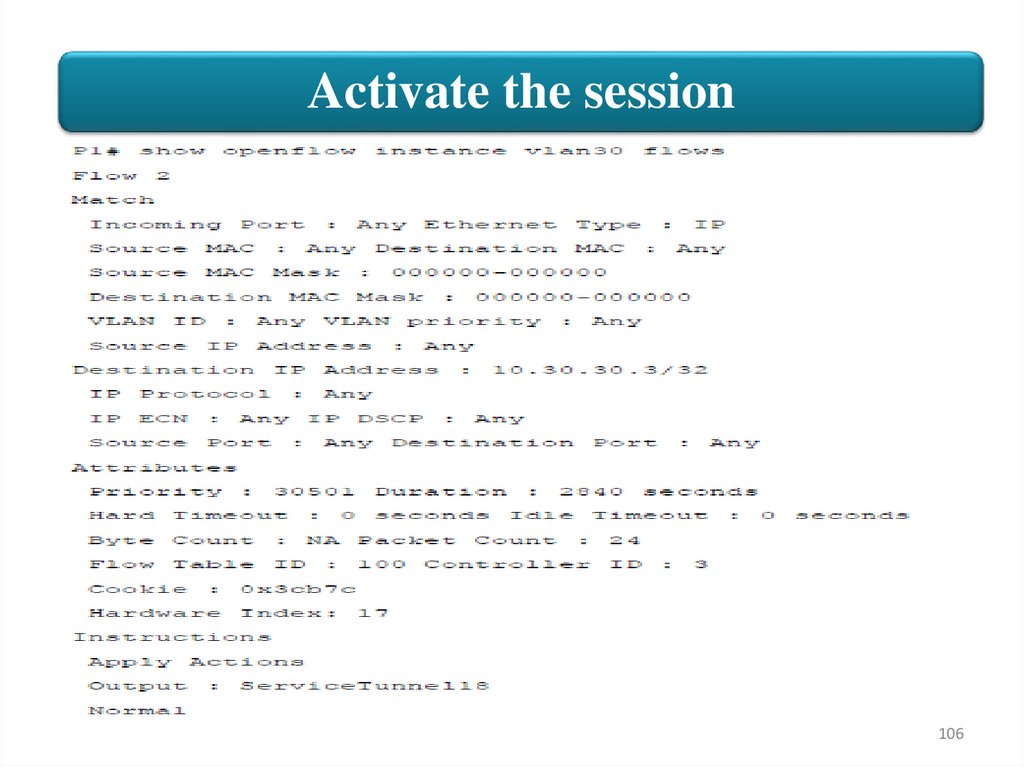
106.
Activate the session106
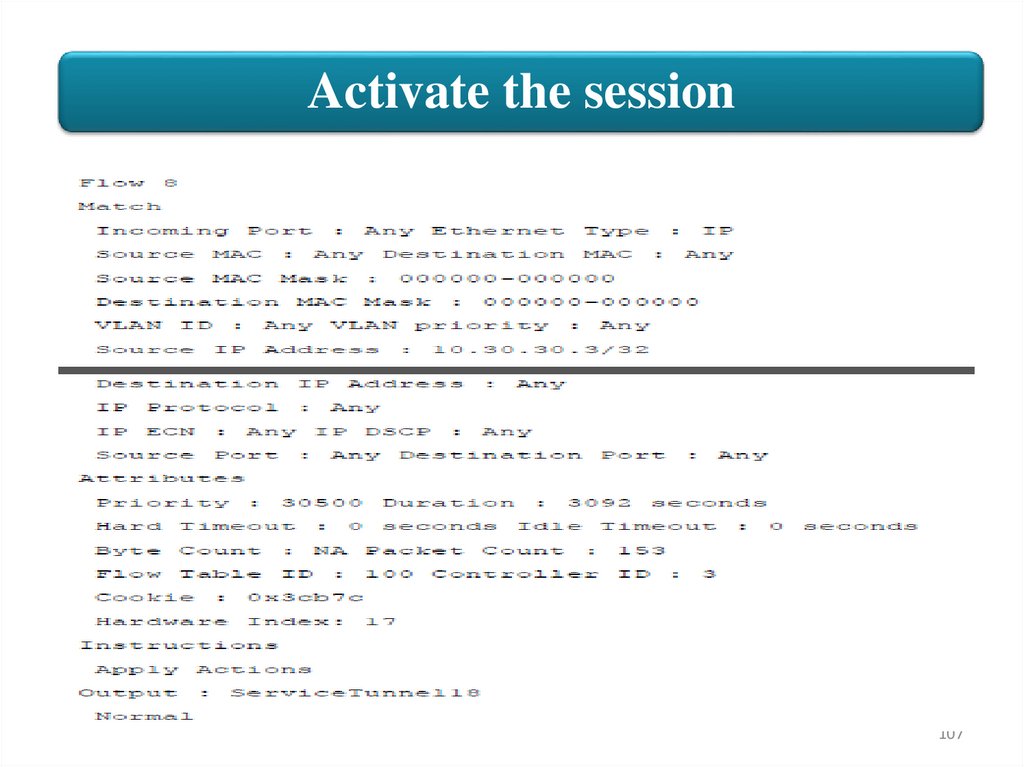
107.
Activate the session107
108.
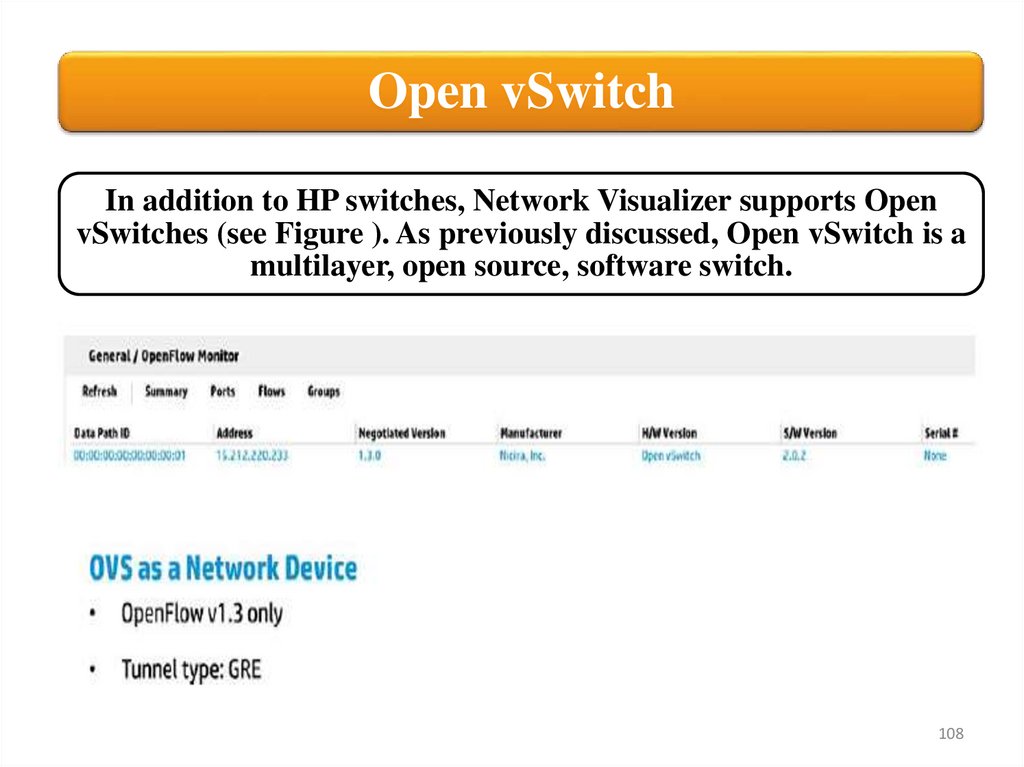
Open vSwitchIn addition to HP switches, Network Visualizer supports Open
vSwitches (see Figure ). As previously discussed, Open vSwitch is a
multilayer, open source, software switch.
108
109.
HP NetworkVisualizer SDN
5. Active Directory integration
109
110.
Active Directory integrationHPE Network Visualizer supports integration with
Microsoft Active Directory using LDAP protocol to
obtain user information along with the primary group
of the user.
You can configure only one LDAP profile. This LDAP
profile can be updated. Any time the LDAP profile is
added or updated using the User Group and Users sync
option, the records from last one hour is synchronized
from the Active Directory for the first time.
Then onwards it will retrieve the records based on the
Directory Sync interval specified.
110
111.
Active Directory integrationActive Directory (AD) is a directory service that Microsoft
developed for Windows domain networks and included in most
Windows Server operating systems as a set of processes and
services.
An AD domain controller authenticates and authorizes all users
and computers in a Windows domain type network — assigning
and enforcing security policies for all computers and installing or
updating software. For example, when a user logs into a
computer that is part of a Windows domain, Active Directory
checks the submitted password and determines whether the user
is a system administrator or normal user.
Active Directory makes use of Lightweight Directory Access
Protocol (LDAP) versions 2 and 3, Microsoft's version of
Kerberos, and DNS.
111
112.
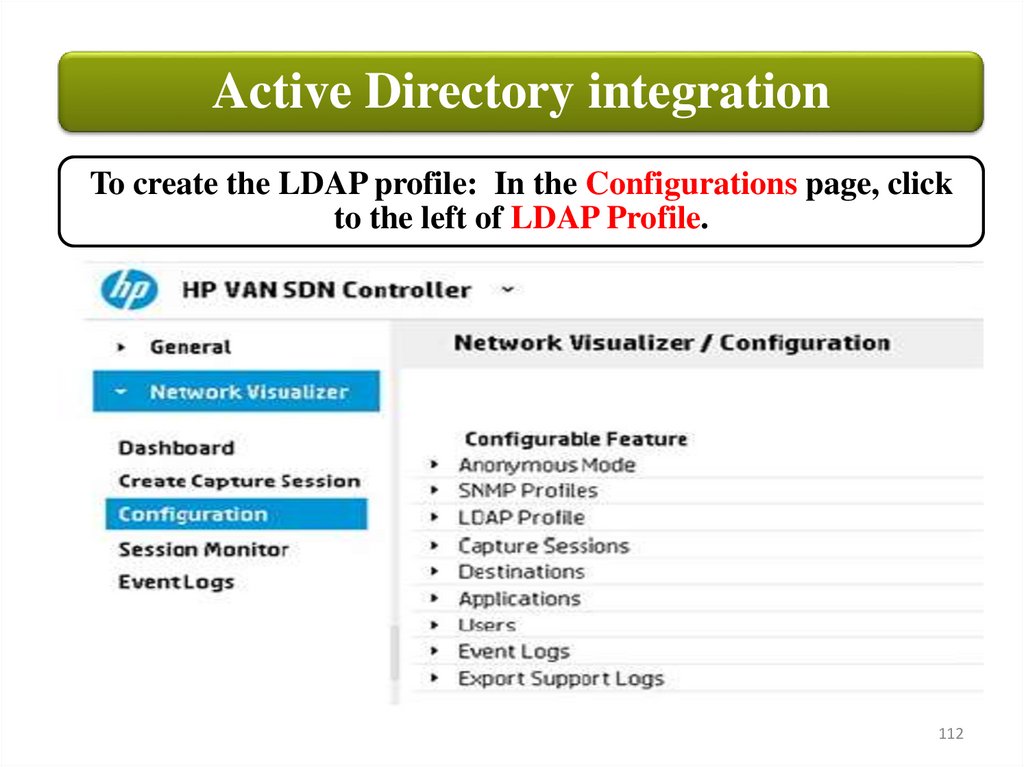
Active Directory integrationTo create the LDAP profile: In the Configurations page, click
to the left of LDAP Profile.
112
113.
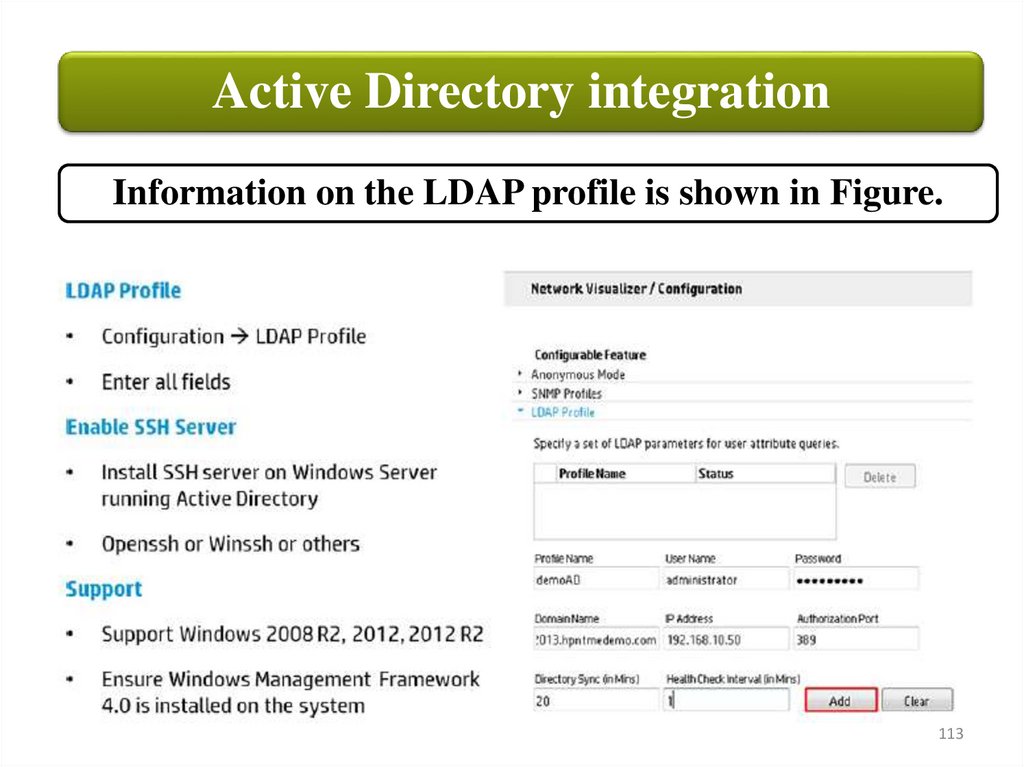
Active Directory integrationInformation on the LDAP profile is shown in Figure.
113
114.
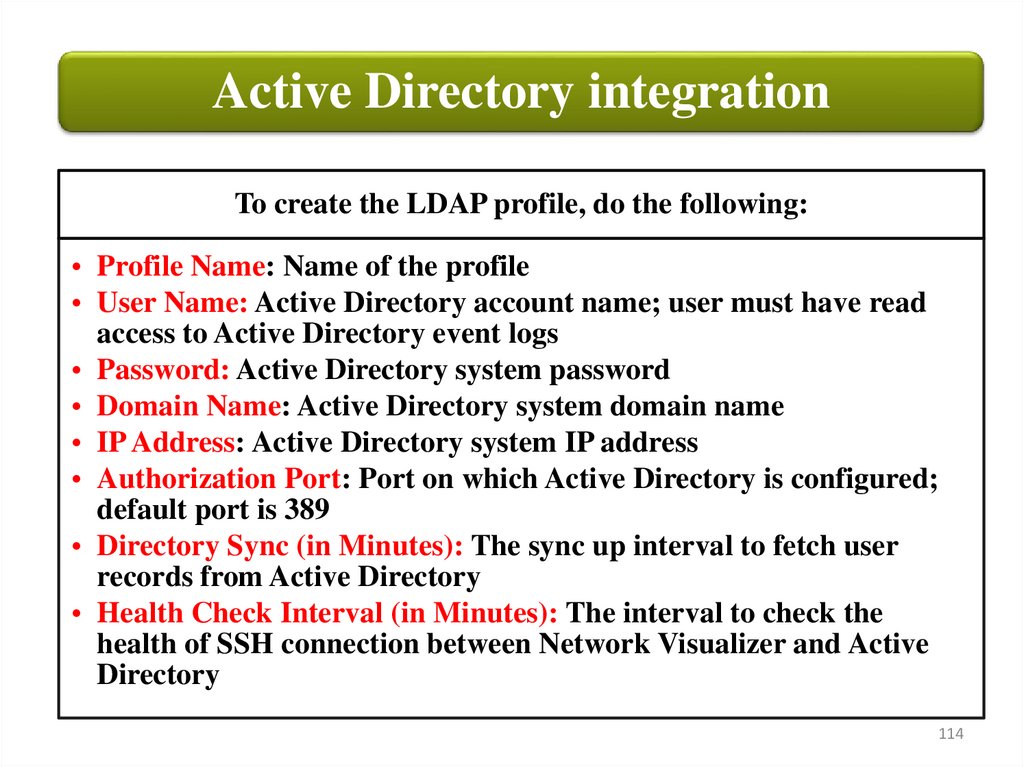
Active Directory integrationTo create the LDAP profile, do the following:
• Profile Name: Name of the profile
• User Name: Active Directory account name; user must have read
access to Active Directory event logs
• Password: Active Directory system password
• Domain Name: Active Directory system domain name
• IP Address: Active Directory system IP address
• Authorization Port: Port on which Active Directory is configured;
default port is 389
• Directory Sync (in Minutes): The sync up interval to fetch user
records from Active Directory
• Health Check Interval (in Minutes): The interval to check the
health of SSH connection between Network Visualizer and Active
Directory
114
115.
SummaryIn this chapter, you learned about the HP Network
Visualizer SDN Application. This is one of the commercial,
enterprise SDN applications available from HP. The
application leverages an OpenFlow-enabled network to
enhance network features and functionality.
Network Visualizer provides visibility into the network and
offers a flexible solution to obtain a copy of network
packets for auditing, verification, and dynamic
troubleshooting purposes. You can get the copy of network
packets from multiple source devices and forward the
captured packets to monitoring devices in a different
location.
115