


 programming
Similar presentations:


 CS208")

How indicators work
1.
HOWINDICATORS
WORK
PART I
Disclaimer: Your Capital might be at risk.
The content in this webinar is created by IQOption LLC for information purposes only and it should not be considered as
personal and/or investment advice and/or incentive to continue trading. The Company does not guarantee the accuracy, validity,
timeliness or completeness, of any information or data made available and assume no liability as to any loss arising from any
investment based on the content of this webinar.
2.
Stay with us...Q & A at the end
3.
What are indicators➔ Technical indicators are heuristic or
pattern-based signals produced by the
price, volume, and/or open interest of an
asset.
➔ They are used by traders who follow
technical analysis.
➔ By analyzing historical data, technical
analysts use indicators to predict future
price movements.
Technical analysis is an analysis
methodology for forecasting the
direction of prices through the
study of past market data,
primarily price and volume.
*Indicators are never 100% guarantee of correct signals
4.
Types of technical indicators● Leading
Attempt to predict where the price is
headed.
● Lagging
Offer a historical report of
background conditions that resulted
in the current price being where it is.
● Trend indicators
● Momentum indicators
● Volatility Indicators
● Volume Indicators
5.
Types of technical indicators● Trend indicators
Measure the direction and strength of
a trend by comparing prices to an
established baseline.
● Momentum indicators
May identify the speed of price
movement by comparing the current
closing price to previous closes.
● Volatility Indicators
Measures the rate of price movement,
regardless of direction
● Volume Indicators
Measures the strength of a trend
based on volume of shares traded.
6.
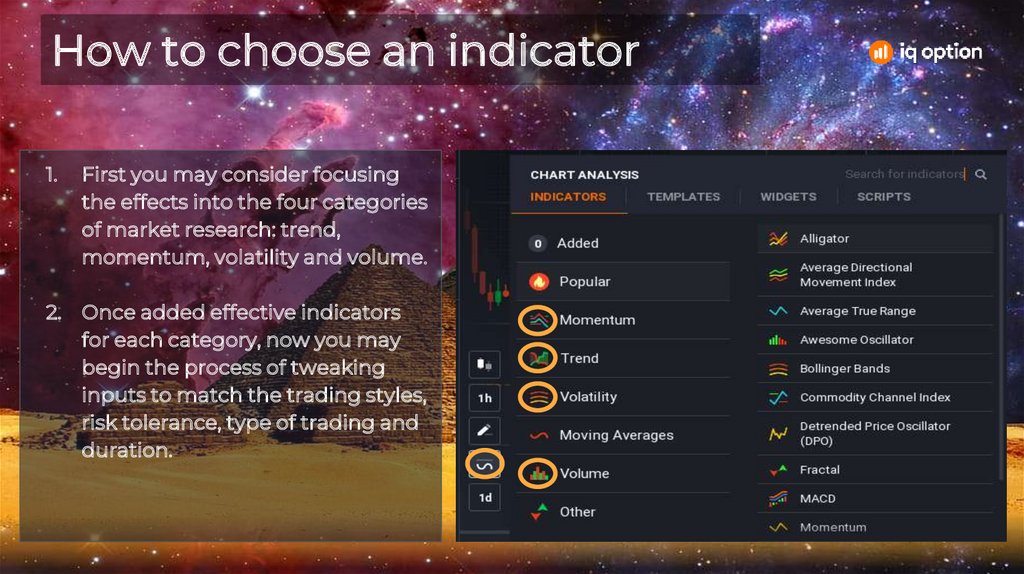
How to choose an indicator1.
First you may consider focusing
the effects into the four categories
of market research: trend,
momentum, volatility and volume.
2. Once added effective indicators
for each category, now you may
begin the process of tweaking
inputs to match the trading styles,
risk tolerance, type of trading and
duration.
7.
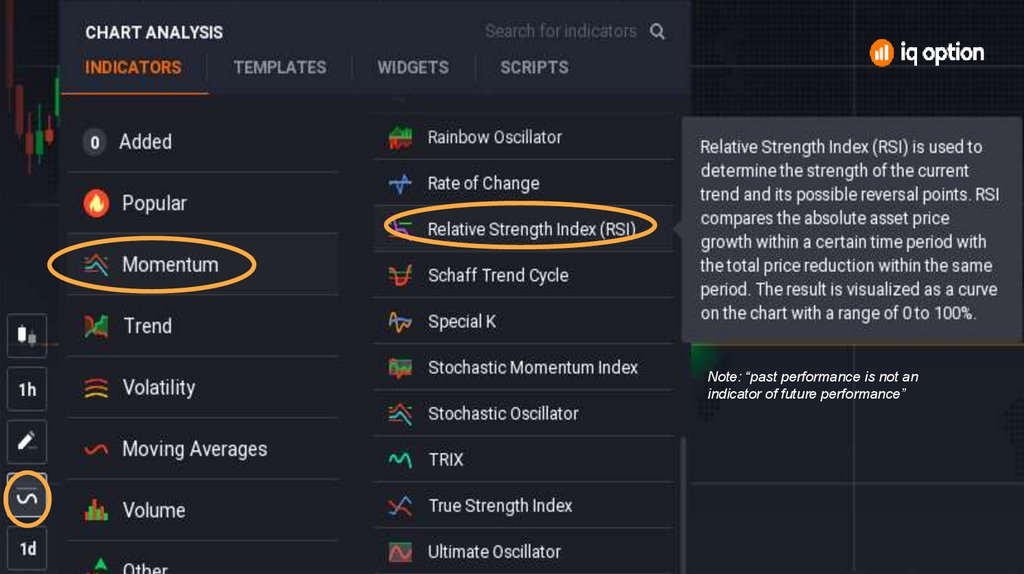
Note: “past performance is not anindicator of future performance”
8.
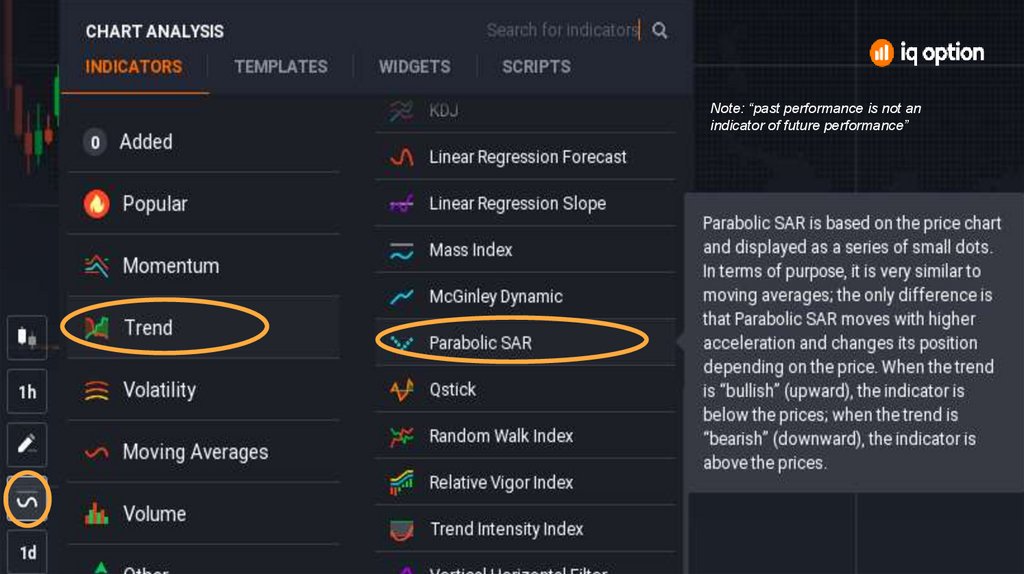
Note: “past performance is not anindicator of future performance”
9.
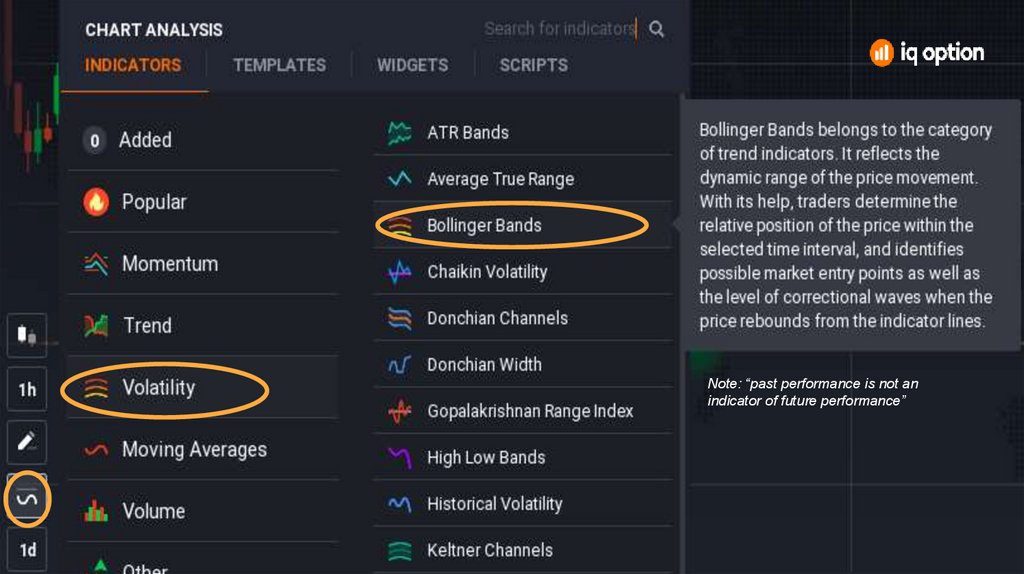
Note: “past performance is not anindicator of future performance”
10.
Note: “past performance is not anindicator of future performance”
11.
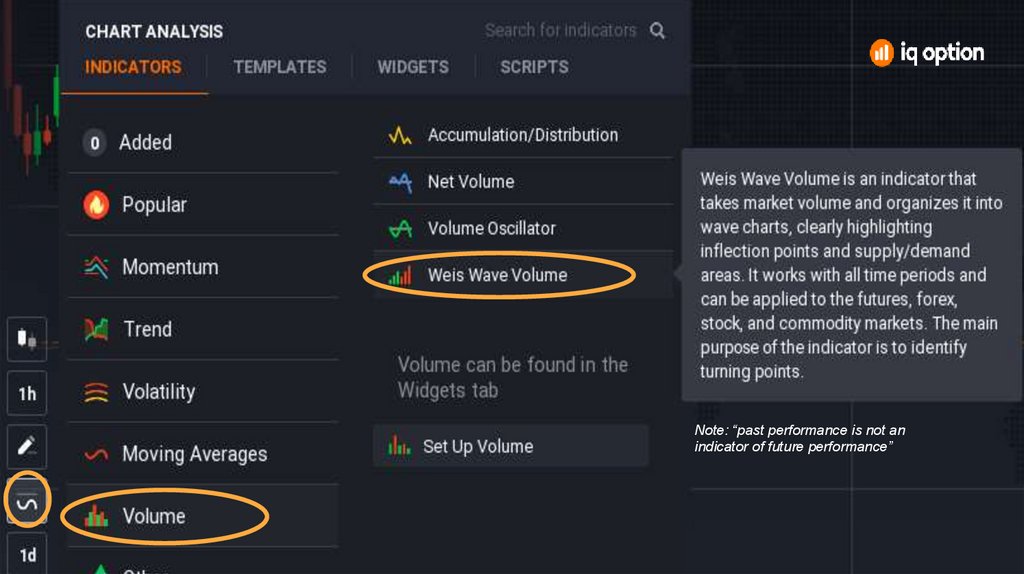
How it will lookParabolic will
show the
momentum
B.B will show
us the
volatility
The RSI will show us if the
asset is overbought or
oversold
Note: “past performance is not an
indicator of future performance”
WWV will show us the
volume being traded