


 programming
Similar presentations:


")
Computational Programming. Part 7
1.
DESCriBing Data with StatiStiCS• In this chapter, we’ll use Python to explore statistics so we can study,
describe, and better understand sets of data. After looking at some
basic statistical measures—the mean , median, mode, and range—we’ll
move on to some more advanced measures, such as variance and
standard deviation. Then, we’ll see how to calculate the correlation
coefficient, which allows you to quantify the relationship between two
sets of data. We’ll end the chapter by learning about scatter plots.
Along the way, we’ll learn more about the Python language and
standard library modules. Let’s get started with one of the most
commonly used statistical measures—the mean.
2.
•Findingthe
Mean
The mean is a common and intuitive way to summarize a set of numbers.
It’s what we might simply call the “average” in everyday use, although as
we’ll see, there are other kinds of averages as well. Let’s take a sample set
of numbers and calculate the mean.
Say there’s a school charity that’s been taking donations over a period
of time spanning the last 12 days (we’ll refer to this as period A). In that
time, the following 12 numbers represent the total dollar amount of donations received for
each day: 100, 60, 70, 900, 100, 200, 500, 500, 503, 600,
1000, and 1200. We can calculate the mean by summing these totals and
then dividing the sum by the number of days. In this case, the sum of the
numbers is 5733. If we divide this number by 12 (the number of days), we
get 477.75, which is the mean donation per day. This number gives us a general idea of how
much money was donated on any given day.
In a moment, we’ll write a program that calculates and prints the mean
for a collection of numbers. As we just saw, to calculate the mean, we’ll need
to take the sum of the list of numbers and divide it by the number of items
in the list. Let’s look at two Python functions that make both of these operations very easy:
sum() and len().
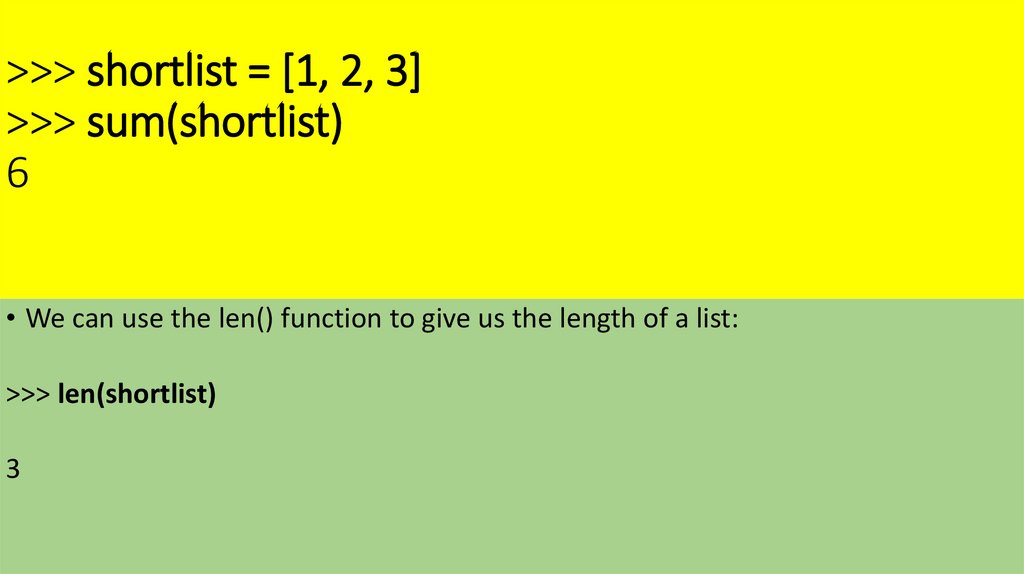
When you use the sum() function on a list of numbers, it adds up all the
numbers in the list and returns the result:
3.
>>> shortlist = [1, 2, 3]>>> sum(shortlist)
6
• We can use the len() function to give us the length of a list:
>>> len(shortlist)
3
4.
When we use the len() function on the list, it returns3 because there are three items in shortlist. Now
we’re ready to write a program that will calculate the
mean of the list of donations
5.
'''Calculating the mean
'''
def calculate_mean(numbers):
u s = sum(numbers)
v N = len(numbers)
# Calculate the mean
w mean = s/N
return mean
if __name__ == '__main__':
x donations = [100, 60, 70, 900, 100, 200, 500, 500, 503, 600, 1000, 1200]
y mean = calculate_mean(donations)
N = len(donations)
z print('Mean donation over the last {0} days is {1}'.format(N, mean))
6.
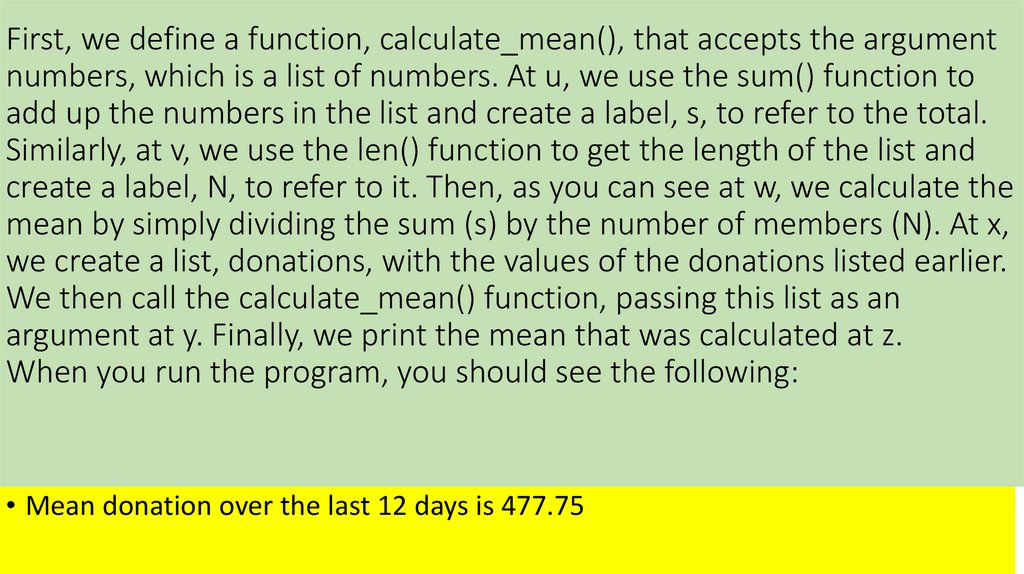
First, we define a function, calculate_mean(), that accepts the argumentnumbers, which is a list of numbers. At u, we use the sum() function to
add up the numbers in the list and create a label, s, to refer to the total.
Similarly, at v, we use the len() function to get the length of the list and
create a label, N, to refer to it. Then, as you can see at w, we calculate the
mean by simply dividing the sum (s) by the number of members (N). At x,
we create a list, donations, with the values of the donations listed earlier.
We then call the calculate_mean() function, passing this list as an
argument at y. Finally, we print the mean that was calculated at z.
When you run the program, you should see the following:
• Mean donation over the last 12 days is 477.75
7.
The calculate_mean() function will calculate the sum and length of anylist, so we can reuse it to calculate the mean for other sets of numbers,
too. We calculated that the mean donation per day was 477.75. It’s
worth noting that the donations during the first few days were much
lower than the mean donation we calculated and that the donations
during the last couple of days were much higher. The mean gives us one
way to summarize the data, but it doesn’t give us a full picture. There are
other statistical measurements, however, that can tell us more about the
data when compared with the mean.
8.
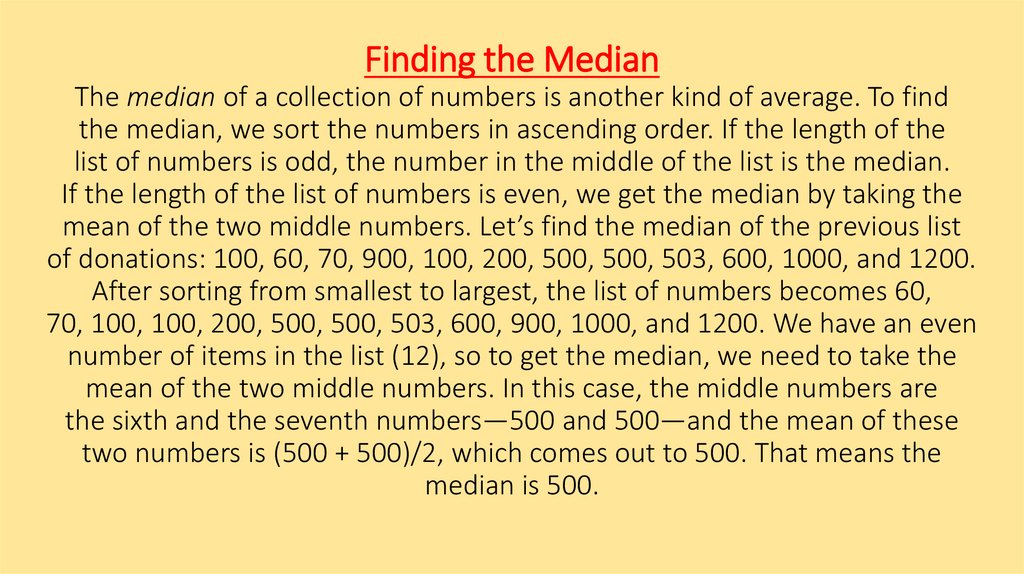
Finding the MedianThe median of a collection of numbers is another kind of average. To find
the median, we sort the numbers in ascending order. If the length of the
list of numbers is odd, the number in the middle of the list is the median.
If the length of the list of numbers is even, we get the median by taking the
mean of the two middle numbers. Let’s find the median of the previous list
of donations: 100, 60, 70, 900, 100, 200, 500, 500, 503, 600, 1000, and 1200.
After sorting from smallest to largest, the list of numbers becomes 60,
70, 100, 100, 200, 500, 500, 503, 600, 900, 1000, and 1200. We have an even
number of items in the list (12), so to get the median, we need to take the
mean of the two middle numbers. In this case, the middle numbers are
the sixth and the seventh numbers—500 and 500—and the mean of these
two numbers is (500 + 500)/2, which comes out to 500. That means the
median is 500.
9.
Now assume—just for this example—that we have another donationtotal for the 13th day so that the list now looks like this: 100, 60, 70, 900,
100, 200, 500, 500, 503, 600, 1000, 1200, and 800.
Once again, we have to sort the list, which becomes 60, 70, 100, 100,
200, 500, 500, 503, 600, 800, 900, 1000, and 1200. There are 13 numbers
in this list (an odd number), so the median for this list is simply the middle
number. In this case, that’s the seventh number, which is 500.
Before we write a program to find the median of a list of numbers, let’s
think about how we could automatically calculate the middle elements of
a list in either case. If the length of a list (N) is odd, the middle number
is the one in position (N + 1)/2. If N is even, the two middle elements are
N/2 and (N/2) + 1. For our first example in this section, N = 12, so the two
middle elements were the 12/2 (sixth) and 12/2 + 1 (seventh) elements.
In the second example, N = 13, so the seventh element, (N + 1)/2, was the
middle element.
In order to write a function that calculates the median, we’ll also need
to sort a list in ascending order. Luckily, the sort() method does just that:
10.
>>> samplelist = [4, 1, 3]>>> samplelist.sort()
>>> samplelist
[1, 3, 4]
11.
Now we can write our next program, which finds themedian of a list of numbers:
12.
'''Calculating the median
'''
def calculate_median(numbers):
u N = len(numbers)
v numbers.sort()
# Find the median
if N % 2 == 0:
# if N is even
m1 = N/2
m2 = (N/2) + 1
# Convert to integer, match position
w m1 = int(m1) - 1
x m2 = int(m2) - 1
y median = (numbers[m1] + numbers[m2])/2
else:
z m = (N+1)/2
# Convert to integer, match position
m = int(m) - 1
median = numbers[m]
return median
if __name__ == '__main__':
donations = [100, 60, 70, 900, 100, 200, 500, 500, 503, 600, 1000, 1200]
median = calculate_median(donations)
N = len(donations)
print('Median donation over the last {0} days is {1}'.format(N, median))
13.
The overall structure of the program is similar to that of the earlierprogram that calculates the mean. The calculate_median() function accepts
a list of numbers and returns the median. At u, we calculate the length
of the list and create a label, N, to refer to it. Next, at v, we sort the list using
the sort() method.
Then, we check to see whether N is even. If so, we find the middle elements, m1
and m2, which are the numbers at positions N/2 and (N/2) + 1 in
the sorted list. The next two statements (w and x) adjust m1 and m2 in two
ways. First, we use the int() function to convert m1 and m2 into integer form.
This is because results of the division operator are always returned as floating point
numbers, even when the result is equivalent to an integer. For
example:
>>> 6/2
3.0
14.
We cannot use a floating point number as an index in a list, so we useint() to convert that result to an integer. We also subtract 1 from both m1
and m2 because positions in a list begin with 0 in Python. This means that
to get the sixth and seventh numbers from the list, we have to ask for the
numbers at index 5 and index 6. At y, we calculate the median by taking
the mean of the two numbers in the middle positions.
Starting at z, the program finds the median if there’s an odd number
of items in the list, once again using int() and subtracting 1 to find the
proper index. Finally, the program calculates the median for the list of
donations and returns it. When you execute the program, it calculates that
the median is 500:
Median donation over the last 12 days is 500.0
15.
Finding the Most Common ElementsFinding the most common number in a data set can be thought of as a
subproblem of finding an arbitrary number of most common numbers.
For instance, instead of the most common score, what if you wanted to
know the five most common scores? The most_common() method of the
Counter class allows us to answer such questions easily. Let’s see an
example:
>>> simplelist = [4, 2, 1, 3, 4]
>>> from collections import Counter
>>> c = Counter(simplelist)
>>> c.most_common()
[(4, 2), (1, 1), (2, 1), (3, 1)]
16.
Here, we start off with a list of five numbers and import Counter fromthe collections module. Then, we create a Counter object, using c to refer
to the object. We then call the most_common() method, which returns a list
ordered by the most common elements.
Each member of the list is a tuple. The first element of the first tuple
is the number that occurs most frequently, and the second element is the
number of times it occurs. The second, third, and fourth tuples contain the
other numbers along with the count of the number of times they appear.
This result tells us that 4 occurs the most (twice), while the others appear
only once. Note that numbers that occur an equal number of times are
returned by the most_common() method in an arbitrary order.
When you call the most_common() method, you can also provide an argument
telling it the number of most common elements you want it to return.
For example, if we just wanted to find the most common element, we would
call it with the argument 1:
17.
>>> c.most_common(1)[(4, 2)]
If you call the method again with 2 as an argument, you’ll see this:
>>> c.most_common(2)
[(4, 2), (1, 1)]
Now the result returned by the most_common method is a list with two
tuples. The first is the most common element, followed by the second
most
common. Of course, in this case, there are several elements tied for most
common, so the fact that the function returns 1 here (and not 2 or 3) is
arbitrary, as noted earlier.
18.
The most_common() method returns both the numbers and the numberof times they occur. What if we want only the numbers and we don’t care
about the number of times they occur? Here’s how we can retrieve that
information:
>>> mode = c.most_common(1)
>>> mode
[(4, 2)]
>>> mode[0]
(4, 2)
>>> mode[0][0]
4
19.
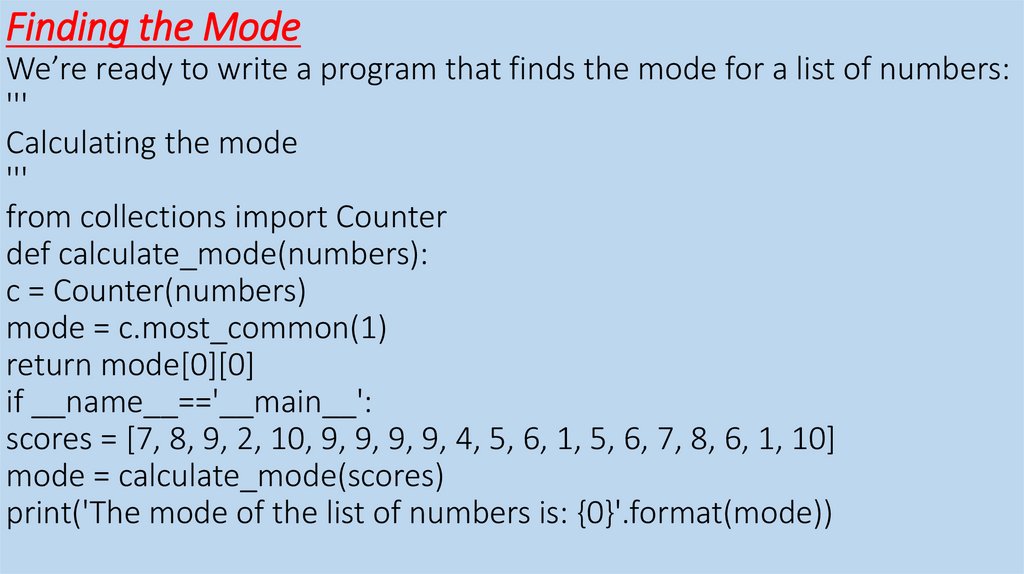
Finding the ModeWe’re ready to write a program that finds the mode for a list of numbers:
'''
Calculating the mode
'''
from collections import Counter
def calculate_mode(numbers):
c = Counter(numbers)
mode = c.most_common(1)
return mode[0][0]
if __name__=='__main__':
scores = [7, 8, 9, 2, 10, 9, 9, 9, 9, 4, 5, 6, 1, 5, 6, 7, 8, 6, 1, 10]
mode = calculate_mode(scores)
print('The mode of the list of numbers is: {0}'.format(mode))
20.
The rest of the program applies the calculate_modefunction to the list of test scores we saw earlier.
When you run the program, you should see the
following output:
The mode of the list of numbers is: 9
21.
What if you have a set of data where two or morenumbers occur the same maximum number of
times? For example, in the list of numbers 5, 5,5, 4, 4,
4, 9, 1, and 3, both 4 and 5 are present three times.
In such cases, the list of numbers is said to have
multiple modes, and our program should find and
print all the modes. The modified program follows:
22.
'''Calculating the mode when the list of numbers may
have multiple modes
'''
from collections import Counter
def calculate_mode(numbers):
c = Counter(numbers)
numbers_freq = c.most_common()
max_count = numbers_freq[0][1]
modes = []
for num in numbers_freq:
if num[1] == max_count:
modes.append(num[0])
return modes
if __name__ == '__main__':
scores = [5, 5, 5, 4, 4, 4, 9, 1, 3]
modes = calculate_mode(scores)
print('The mode(s) of the list of numbers are:')
for mode in modes:
print(mode)
23.
When you execute the preceding program, you should see thefollowing output:
The mode(s) of the list of numbers are:
4
5
What if you wanted to find the number of times every number
occurs instead of just the mode? A frequency table, as the name
indicates, is a table that shows how many times each number
occurs within a collection of numbers.
24.
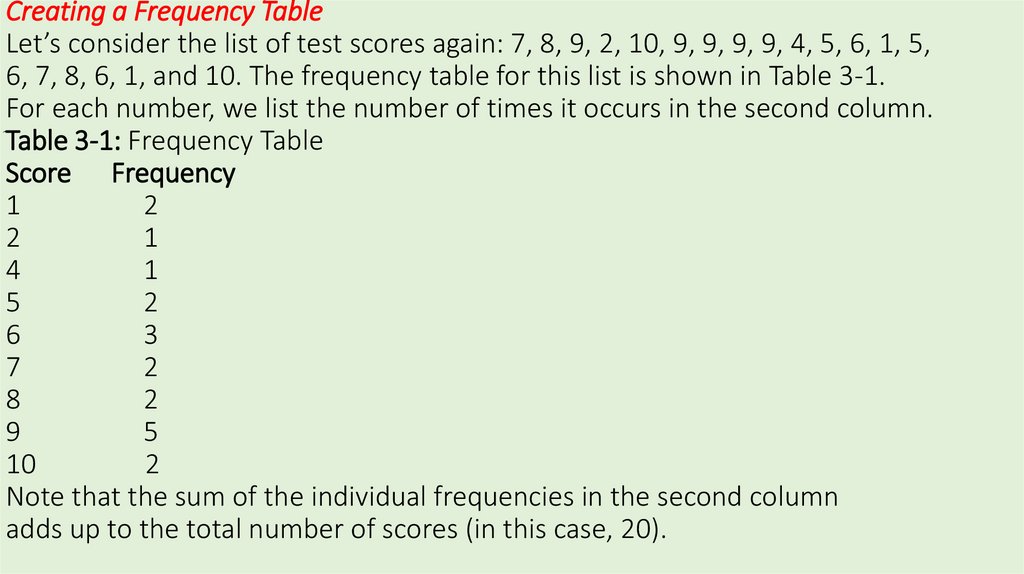
Creating a Frequency TableLet’s consider the list of test scores again: 7, 8, 9, 2, 10, 9, 9, 9, 9, 4, 5, 6, 1, 5,
6, 7, 8, 6, 1, and 10. The frequency table for this list is shown in Table 3-1.
For each number, we list the number of times it occurs in the second column.
Table 3-1: Frequency Table
Score Frequency
1
2
2
1
4
1
5
2
6
3
7
2
8
2
9
5
10
2
Note that the sum of the individual frequencies in the second column
adds up to the total number of scores (in this case, 20).
25.
Here’s the program:'''
Frequency table for a list of numbers
'''
from collections import Counter
def frequency_table(numbers):
u table = Counter(numbers)
print('Number\tFrequency')
v for number in table.most_common():
print('{0}\t{1}'.format(number[0], number[1]))
if __name__=='__main__':
scores = [7, 8, 9, 2, 10, 9, 9, 9, 9, 4, 5, 6, 1, 5, 6, 7, 8, 6, 1, 10]
frequency_table(scores)
26.
The function frequency_table() prints the frequency tableof the list of numbers passed to it. At u, we first create a
Counter object and create the label table to refer to it.
Next, using a for loop v, we go through each of the tuples,
printing the first member (the number itself) and the
second member (the frequency of the corresponding
number). We use \t to print a tab between each value to
space the table. When you run the program, you’ll see
the following output:
27.
Number9
6
1
5
7
8
10
2
4
Frequency
5
3
2
2
2
2
2
1
1
28.
Here, you can see that the numbers are listed indecreasing order of frequency because the
most_common() function returns the numbers in this
order. If, instead, you want your program to print the
frequency table sorted by value from lowest to
highest, as shown in Table 3-1, you’ll have
to re-sort the list of tuples.
The sort() method is all we need to modify our earlier
frequency table program:
29.
'''Frequency table for a list of numbers
Enhanced to display the table sorted by the numbers
'''
from collections import Counter
def frequency_table(numbers):
table = Counter(numbers)
numbers_freq = table.most_common()
numbers_freq.sort()
print('Number\tFrequency')
for number in numbers_freq:
print('{0}\t{1}'.format(number[0], number[1]))
Describing Data with Statistics 71
if __name__ == '__main__':
scores = [7, 8, 9, 2, 10, 9, 9, 9, 9, 4, 5, 6, 1, 5, 6, 7, 8, 6, 1, 10]
frequency_table(scores)
30.
Here, we store the list returned by themost_common() method in
numbers_freq at u, and then we sort it by calling the
sort() method v.
Finally, we use the for loop to go over the sorted
tuples and print each
number and its frequency w. Now when you run the
program, you’ll
see the following table, which is identical to
Table 3-1:
31.
Number Frequency1
2
2
1
4
1
5
2
6
3
7
2
8
2
9
5
10
2
32.
Measuring the DispersionThe next statistical calculations we’ll look at measure
the dispersion, which tells us how far away the
numbers in a set of data are from the mean of the
data set. We’ll learn to calculate three different
measurements of dispersion: range, variance, and
standard deviation.
33.
Finding the Range of a Set of NumbersOnce again, consider the list of donations during period A: 100, 60, 70,
900,100, 200, 500, 500, 503, 600, 1000, and 1200. We found that the
mean donation per day is 477.75. But just looking at the mean, we have
no idea whether all the donations fell into a narrow range—say between
400 and 500—or whether they varied much more than that—say
between 60 and 1200, as in this case. For a list of numbers, the range is
the difference between the highest number and the lowest number. You
could have two groups of numbers with the exact same mean but with
vastly different ranges, so knowing the range fills in more information
about a set of numbers beyond what we can learn from just looking at
the mean, median, and mode.
34.
donations:'''
Find the range
'''
def find_range(numbers):
lowest = min(numbers)
highest = max(numbers)
# Find the range
r = highest-lowest
return lowest, highest, r
if __name__ == '__main__':
donations = [100, 60, 70, 900, 100, 200, 500, 500, 503, 600, 1000,
1200]
lowest, highest, r = find_range(donations)
print('Lowest: {0} Highest: {1} Range: {2}'.format(lowest, highest,
35.
The function find_range() accepts a list as a parameter and finds therange. First, it calculates the lowest and the highest numbers using the min()
and the max() functions at u and v. As the function names indicate, they
find the minimum and the maximum values in a list of numbers.
We then calculate the range by taking the difference between the highest and the
lowest numbers, using the label r to refer to this difference.
At w, we return all three numbers—the lowest number, the highest number, and the
range. This is the first time in the book that we’re returning
multiple values from a function—instead of just returning one value, this
function returns three. At x, we use three labels to receive the three values
being returned from the find_range() function. Finally, we print the values.
When you run the program, you should see the following output:
Lowest: 60 Highest: 1200 Range: 1140