


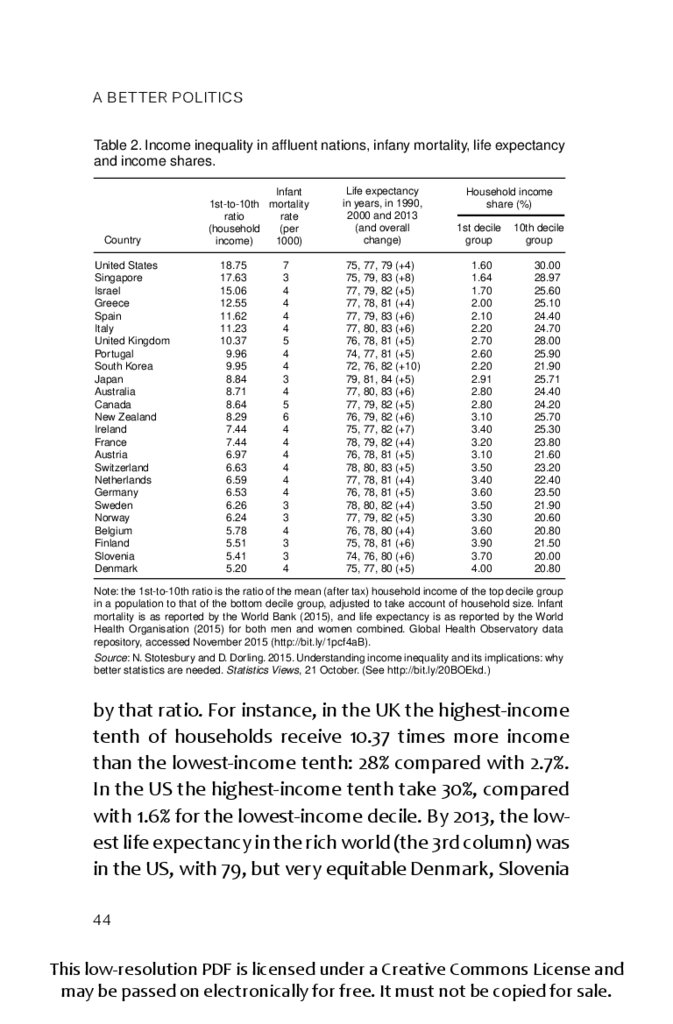

 policy
Similar presentations:


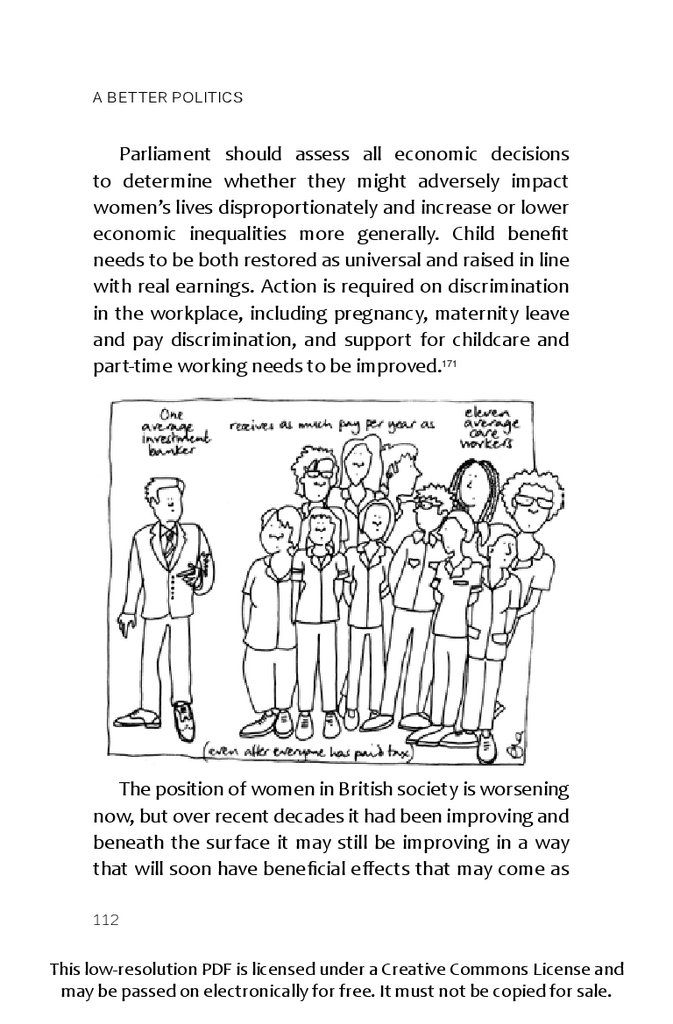
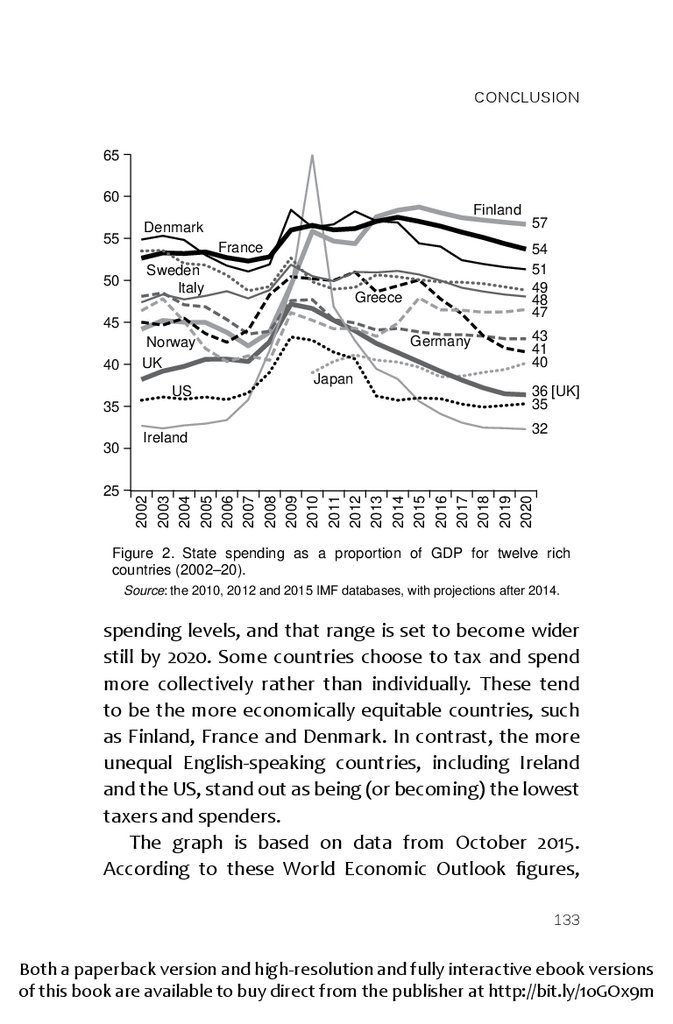
A better politics
1.
PERSPECTIVESA BET TER
POLITICS
How Government Can
Make Us Happier
DANNY DORLING
with illustrations by Ella Furness
2.
A Better PoliticsHow Government Can Make Us Happier
‘The thing that is lacking in the often machine-like short-term
tactics of British politics is any vision of what we could be as individuals and as a nation. Danny Dorling makes simple arguments
for a better society – ideas that are grounded in practical idealism and backed up with intelligent interpretation of evidence
and data.’
From the foreword by Lord Victor O. Adebowale, Crossbench Peer
‘Starting from the very reasonable view that public policy should
concentrate on what would further our well-being, Dorling argues for a provocative range of policies. This is a useful corrective to the focus on measured economic growth, which can all
too readily dominate our thinking; these ideas deserve further
debate.’
Dame Kate Barker, Former member of the Bank
of England’s Monetary Policy Committee
‘In The Argumentative Indian, Amartya Sen encourages us to
consider the traditions, contributions and shared humanity of
people like us who are different – Danny Dorling has done that
for me.’
Sir Peter Bottomley, Conservative MP and former minister
‘A formidable intervention into current political debate.’
Anthony Giddens, Former Director of the LSE
‘What matters most, what makes us happy, and what, if anything, governments can do to help us thrive are vital questions.
Some of the answers around money and housing are admirably
clear. Others are unavoidably complex – governments will always struggle to influence our relationships. But no one will read
this book without finding new insights and inspiration.’
Geoff Mulgan, Chief Executive of Nesta
This low-resolution PDF is licensed under a Creative Commons License and
may be passed on electronically for free. It must not be copied for sale.
3.
‘Whether one leans left or right, this is a remarkably engagingbook. Dorling is ahead of his time in blending common sense
with an emphasis on the use of objective evidence about societal happiness.’
Andrew Oswald, Professor of Economics,
University of Warwick
‘One sentence captures Danny Dorling’s argument ‘we are
not focussing enough on the issues that make us most unhappy in this most unequal of affluent societies’. By the end of
reading this lucid, data rich and engaging book it is impossible
to disagree.’
Matthew Taylor, Chief Executive, RSA
‘This lively and accessible book is a wake- up call to anyone involved in public policy. It reminds us that happiness, and love,
are terms too rarely mentioned, and even less frequently
measured, and yet they are at the heart of what makes a good
society. Politicians, policy makers and practitioners could all
benefit from asking the central question – what can be done
to make us happier? Danny Dorling challenges, and informs,
and does so in a way that makes the reader think again about
what really matters.’
Julia Unwin, Chief Executive of the
Joseph Rowntree Foundation
Both a paperback version and high-resolution and fully interactive ebook versions
of this book are available to buy direct from the publisher at http://bit.ly/1oGOx9m
4.
London Publishing Partnership — A Better PoliticsDanny Dorling is the Halford Mackinder Professor of Geography at the University of Oxford. He grew up in Oxford and
went to university in Newcastle upon Tyne. He has worked
in Newcastle, Bristol, Leeds, Sheffield and New Zealand.
With a group of colleagues he helped create the website
www.worldmapper.org, which shows who has most and least
in the world. Much of Danny’s work is available open access
(see www.dannydorling.org). His work concerns issues of
housing, health, employment, education and poverty.
His many books (some co-authored) include Injustice:
Why Social Inequality Still Persists (Policy Press, 2015), Inequal
ity and the 1% (Verso, 2014), The Social Atlas of Europe (with
D. Ballas and B. D. Hennig; Policy Press, 2014), All That Is S olid:
The Great Housing Disaster (Allen Lane, 2015), Population
10 Billion (Constable, 2013), So You Think You Know About
Britain? (Constable, 2011), The Visualization of Social Spatial
Structure (Wiley, 2012), Geography (with C. Lee; Profile,
2016) and People and Places: A 21st-Century Atlas of the UK
(with B. Thomas; Policy Press, 2016).
This low-resolution PDF is licensed under a Creative Commons License and
may be passed on electronically for free. It must not be copied for sale.
5.
A Better PoliticsBoth a paperback version and high-resolution and fully interactive ebook versions
of this book are available to buy direct from the publisher at http://bit.ly/1oGOx9m
6.
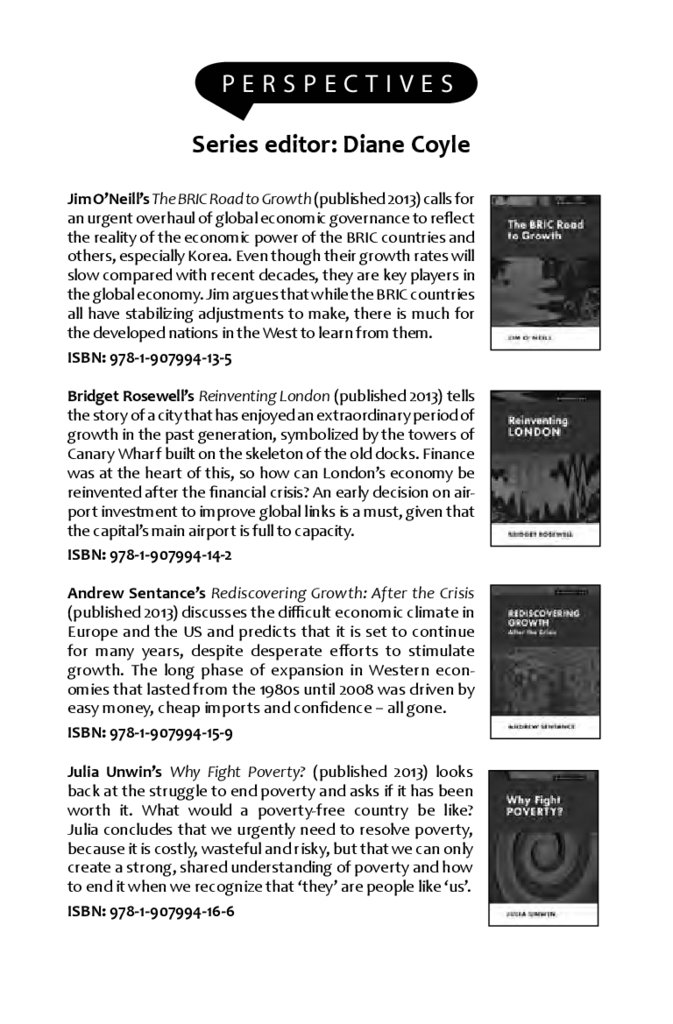
PERSPECTIVESSeries editor: Diane Coyle
The BRIC Road to Growth — Jim O’Neill
Reinventing London — Bridget Rosewell
Rediscovering Growth: After the Crisis
— Andrew Sentance
Why Fight Poverty? — Julia Unwin
Identity Is The New Money — David Birch
Housing: Where’s the Plan? — Kate Barker
Bad Habits, Hard Choices: Using the Tax
System to Make Us Healthier — David Fell
A Better Politics: How Government Can Make
Us Happier — Danny Dorling
Are Trams Socialist? — Christian Wolmar
This low-resolution PDF is licensed under a Creative Commons License and
may be passed on electronically for free. It must not be copied for sale.
7.
A Better PoliticsHow Government Can
Make Us Happier
Danny Dorling
with illustrations
by Ella Furness
london publishing partnership
Both a paperback version and high-resolution and fully interactive ebook versions
of this book are available to buy direct from the publisher at http://bit.ly/1oGOx9m
8.
Copyright © 2016 Danny DorlingCartoons: copyright © 2016 Ella Furness
Published by London Publishing Partnership
www.londonpublishingpartnership.co.uk
Published in association with
Enlightenment Economics
www.enlightenmenteconomics.com
All Rights Reserved
ISBN: 978-1-907994-53-1 (pbk)
A catalogue record for this book is
available from the British Library
This book has been composed in Candara
Copy-edited and typeset by
T&T Productions Ltd, London
www.tandtproductions.com
Ebook versions of this book are also available
(epub: 978-1-907994-54-8; interactive PDF: 978-1-907994-55-5).
For a free PDF version see www.londonpublishingpartnership.co.uk
or www.dannydorling.org. The PDF of this book is licensed
under a Creative Commons License and you may pass it on
electronically for free, but it must not be copied for sale.
This low-resolution PDF is licensed under a Creative Commons License and
may be passed on electronically for free. It must not be copied for sale.
9.
To Dimitris BallasBoth a paperback version and high-resolution and fully interactive ebook versions
of this book are available to buy direct from the publisher at http://bit.ly/1oGOx9m
10.
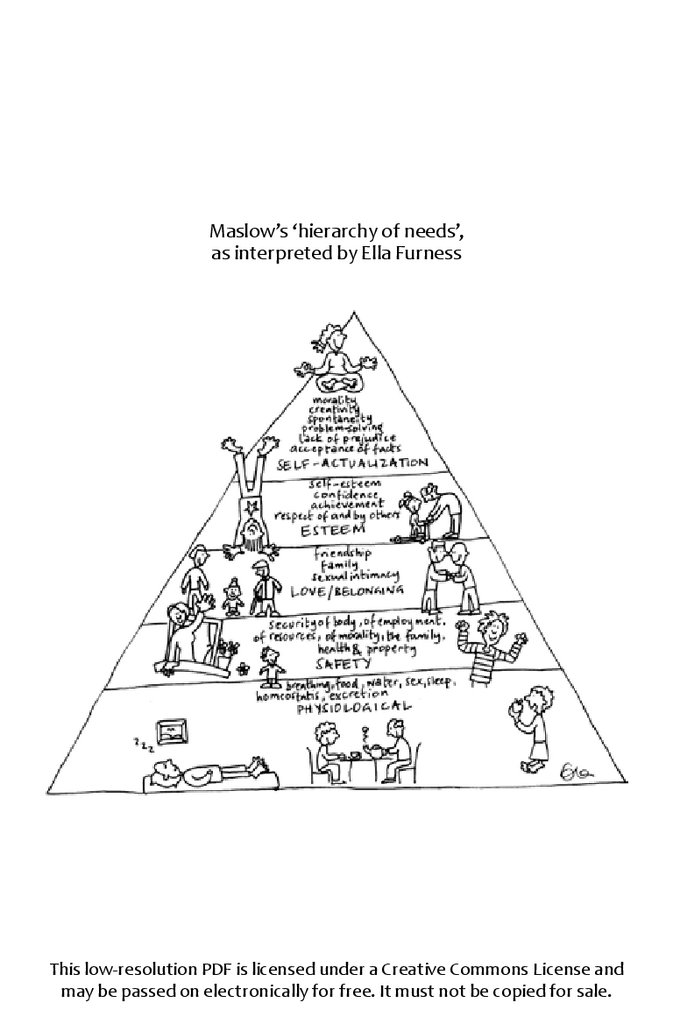
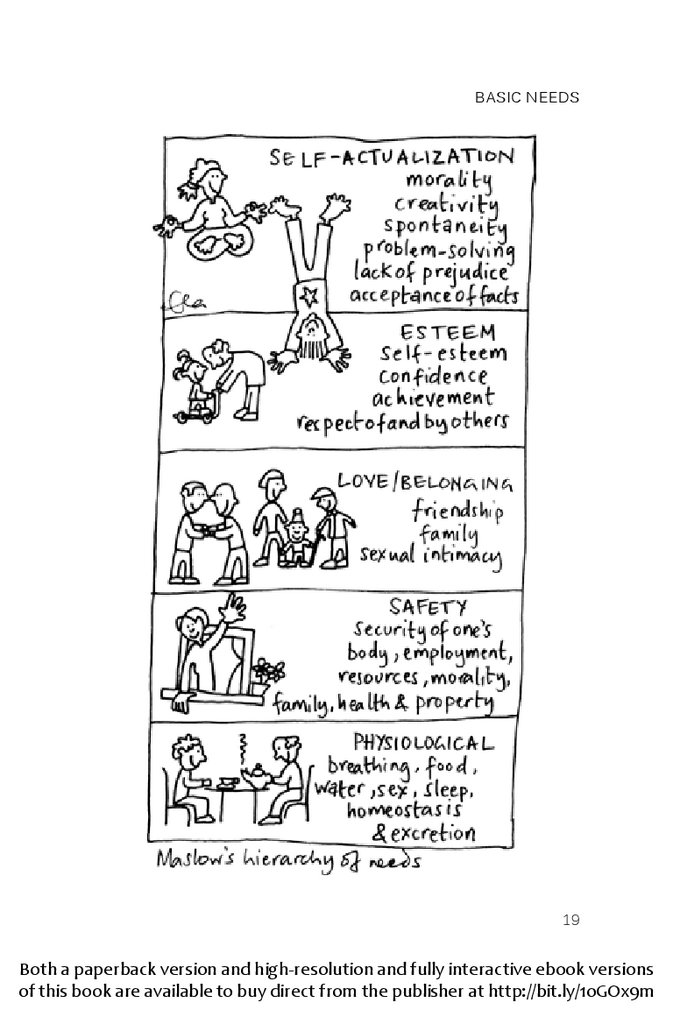
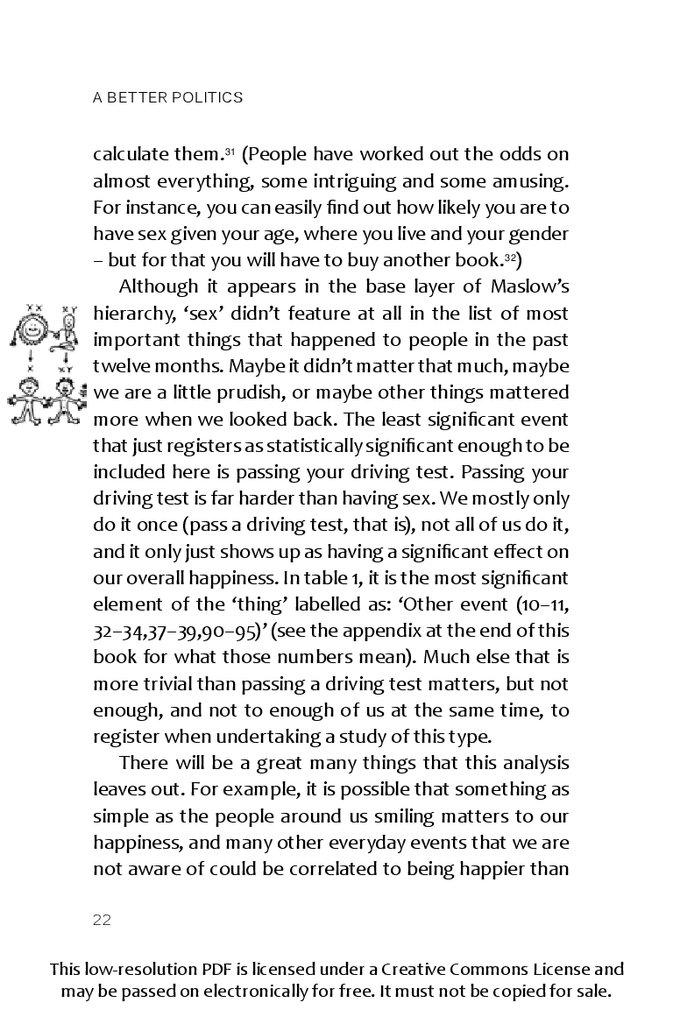
Maslow’s ‘hierarchy of needs’,as interpreted by Ella Furness
This low-resolution PDF is licensed under a Creative Commons License and
may be passed on electronically for free. It must not be copied for sale.
11.
Happiness is about the heartland1Both a paperback version and high-resolution and fully interactive ebook versions
of this book are available to buy direct from the publisher at http://bit.ly/1oGOx9m
12.
This low-resolution PDF is licensed under a Creative Commons License andmay be passed on electronically for free. It must not be copied for sale.
13.
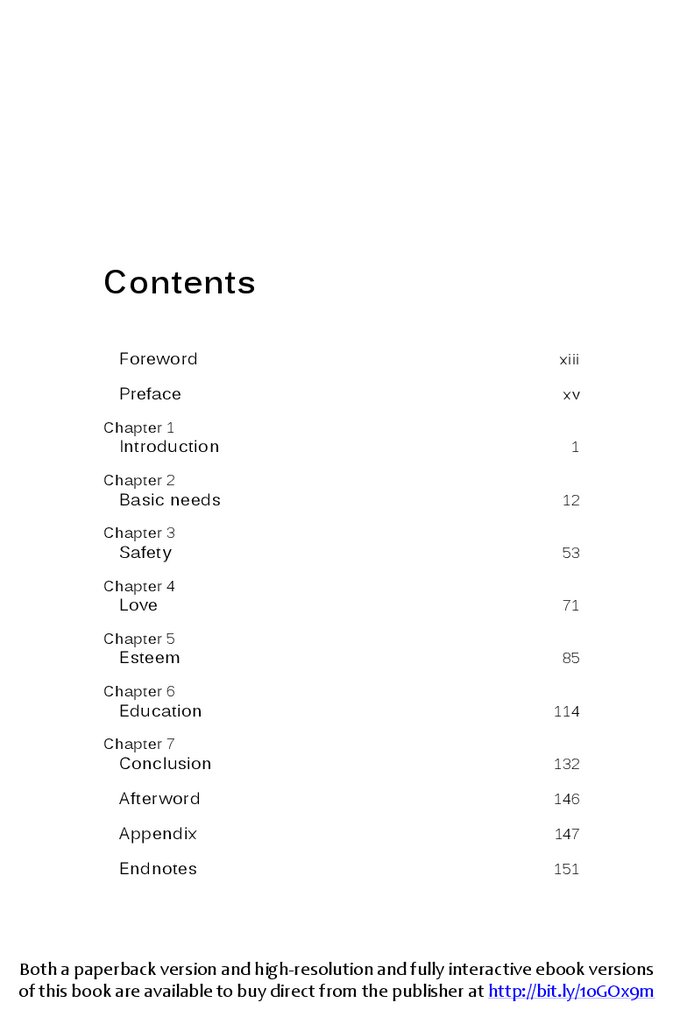
ContentsForeword
xiii
Preface
xv
Chapter 1
Introduction
Chapter 2
Basic needs
Chapter 3
Safety
Chapter 4
Love
Chapter 5
Esteem
Chapter 6
Education
Chapter 7
1
12
53
71
85
114
Conclusion
132
Afterword
146
Appendix
147
Endnotes
151
Both a paperback version and high-resolution and fully interactive ebook versions
of this book are available to buy direct from the publisher at http://bit.ly/1oGOx9m
14.
This low-resolution PDF is licensed under a Creative Commons License andmay be passed on electronically for free. It must not be copied for sale.
15.
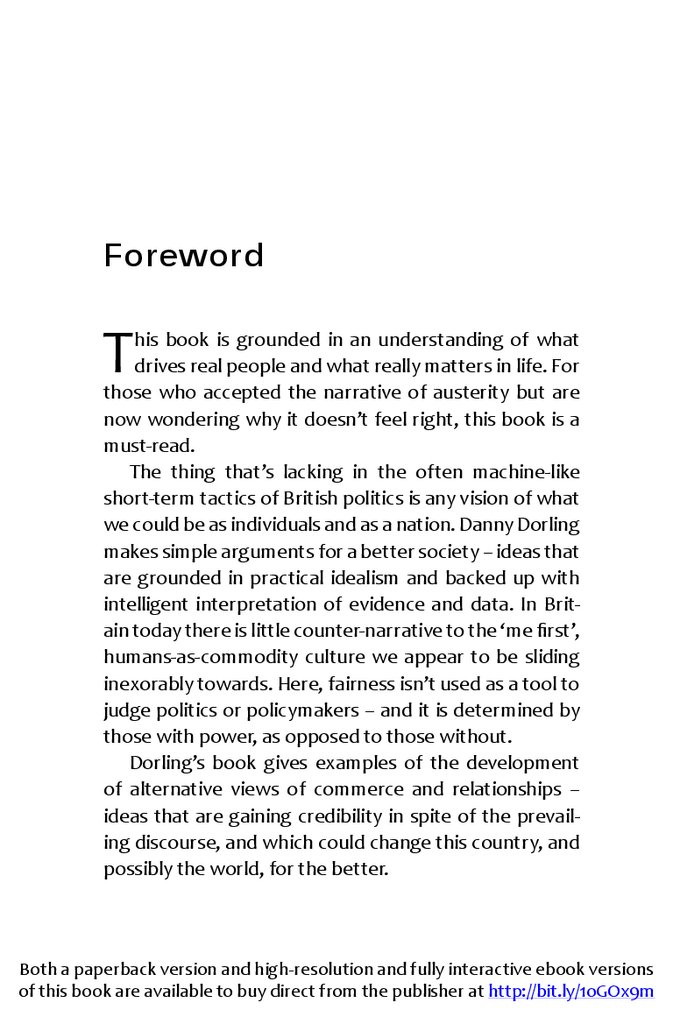
ForewordT
his book is grounded in an understanding of what
drives real people and what really matters in life. For
those who accepted the narrative of austerity but are
now wondering why it doesn’t feel right, this book is a
must-read.
The thing that’s lacking in the often machine-like
short-term tactics of British politics is any vision of what
we could be as individuals and as a nation. Danny Dorling
makes simple arguments for a better society – ideas that
are grounded in practical idealism and backed up with
intelligent interpretation of evidence and data. In Britain today there is little counter-narrative to the ‘me first’,
humans-as-commodity culture we appear to be sliding
inexorably towards. Here, fairness isn’t used as a tool to
judge politics or policymakers – and it is determined by
those with power, as opposed to those without.
Dorling’s book gives examples of the development
of alternative views of commerce and relationships –
ideas that are gaining credibility in spite of the prevailing discourse, and which could change this country, and
possibly the world, for the better.
Both a paperback version and high-resolution and fully interactive ebook versions
of this book are available to buy direct from the publisher at http://bit.ly/1oGOx9m
16.
ForewordThe future is often decided by the things we fail to
debate. This book is a call to discuss things that have
become uncomfortable for politicians; it’s a call to the
future of policymaking and to the role of government
in creating the conditions for human policy. We need to
listen carefully.
Lord Victor O. Adebowale CBE, Crossbench Peer
xiv
This low-resolution PDF is licensed under a Creative Commons License and
may be passed on electronically for free. It must not be copied for sale.
17.
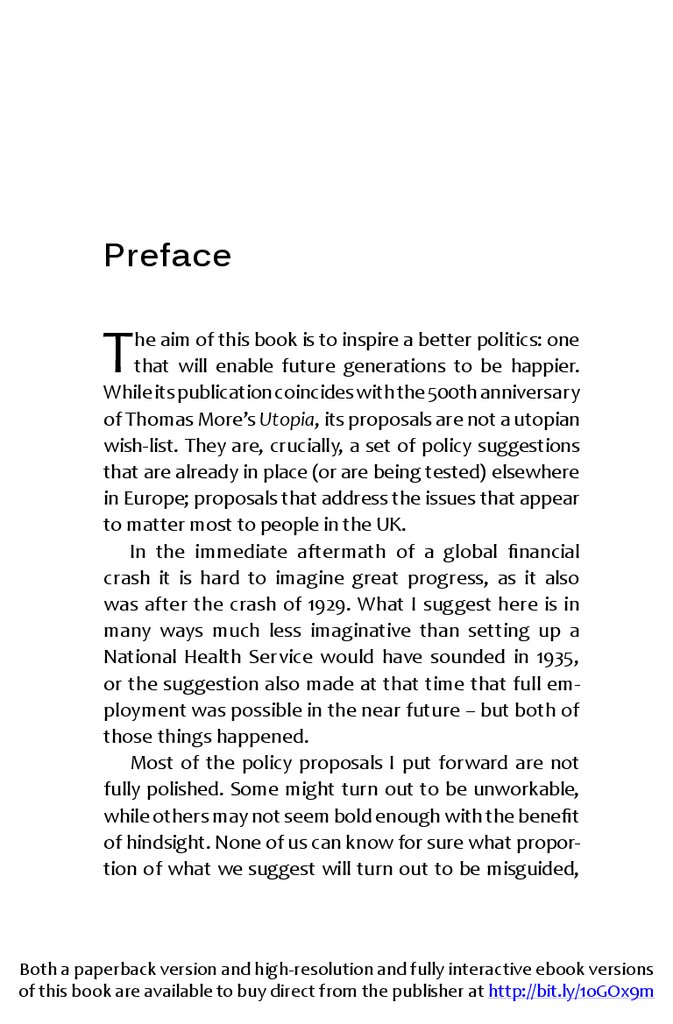
PrefaceT
he aim of this book is to inspire a better politics: one
that will enable future generations to be happier.
While its publication coincides with the 500th anniversary
of Thomas More’s Utopia, its proposals are not a utopian
wish-list. They are, crucially, a set of policy suggestions
that are already in place (or are being tested) elsewhere
in Europe; proposals that address the issues that appear
to matter most to people in the UK.
In the immediate aftermath of a global financial
crash it is hard to imagine great progress, as it also
was after the crash of 1929. What I suggest here is in
many ways much less imaginative than setting up a
National Health Service would have sounded in 1935,
or the suggestion also made at that time that full employment was possible in the near future – but both of
those things happened.
Most of the policy proposals I put forward are not
fully polished. Some might turn out to be unworkable,
while others may not seem bold enough with the benefit
of hindsight. None of us can know for sure what proportion of what we suggest will turn out to be misguided,
Both a paperback version and high-resolution and fully interactive ebook versions
of this book are available to buy direct from the publisher at http://bit.ly/1oGOx9m
18.
Prefaceor where we might have hit the nail on the head. That is
often only apparent in retrospect.
What is certain is that there is no shortage of evidence,
ideas and choices for us to consider if we wish to. There
are many policies that we could adopt if we really want
to be collectively happier and healthier. We could have a
government that makes our lives happier, if we win the
argument for it.
Acknowledgements
I am very grateful to the following for various comments
on various stages of the manuscript that became this
book: Richard Baggaley, Dimitris Ballas, Florence Rose
Burton, Sarah Campbell, Sam Clark, Diane Coyle, David
Dorling, Dawn Foster, Amanda Goodall, Aniko Horvath,
Vittal Katikireddi, Carl Lee, Chris Lynch, Avril Maddrell,
Connor McCarthy, Paul Nicolson, Andrew Oswald, Karen
Shook, Natasha Stotesbury, Sally Tomlinson, Kathy
Wrigley and Terry Wrigley. Many thanks are also due to
Ailsa Allen for drawing all the graphs and tables.
Danny Dorling, University of Oxford*
* Oxford: ‘that crowded, clucking duckpond of vanity and ruffled
feathers’. 2
xvi
This low-resolution PDF is licensed under a Creative Commons License and
may be passed on electronically for free. It must not be copied for sale.
19.
Chapter 1Introduction
To make a real difference we need to shift common
sense, change the terms of debate and shape a new
political terrain.
— Doreen Massey3
T
he aim of this book is to inspire a better politics:
one that will enable future generations to be happier, with goals of greater well-being and better health,
rather than wealth maximization. Happiness does not
mean being ecstatic: it is the avoidance of misery, the
gaining of long-term life satisfaction, the feeling of fulfilment, of worth, of kindness, of usefulness and of love.
We need new measures of what matters most to us.
The book is also about ‘the collective good’. We cannot truly be happy if those around us are not happy.
Not just our family and friends, but our fellow citizens,
whose lives are entwined with ours and will affect us
for good or ill at some point. This book looks at evidence and suggests policies that take account of that
evidence. We live in an information-rich, ‘scientific’
Both a paperback version and high-resolution and fully interactive ebook versions
of this book are available to buy direct from the publisher at http://bit.ly/1oGOx9m
20.
A BETTER POLITICSworld, but this is a recent phenomenon. Yet while we
might not fully understand climate change or sub
atomic physics, we should now find it easier to understand what makes us happy; and we can also compare
ourselves with other nations on key measures of health
and well-being.
Politicians often say that they are addressing the
issues that matter most to people. But they rely on opinion surveys in which the questions have been predetermined. What have people themselves said, unprompted,
about what is most important to them or their family?
How do their answers relate to how happy and healthy
those same people are?
Being happy is not the be-all and end-all, but it’s better
to be happier if you can. Politicians often promise that
if they are elected they will ensure that the electorate
will be ‘better off’ than if the other lot are elected; but
do politicians actually know what it is that makes people
happy? Other academics have approached this question
in many very different ways. 4
This book begins with statistical evidence from a
scientific paper. Yet although almost all of the facts presented in these pages are referenced, it is not a researchbased volume. Instead, this book is a collection of ideas
– based mostly on the work of others, including much
readily available evidence – on what policies could best
safeguard us (better than current policies) from what
the evidence indicates harms us the most.
2
This low-resolution PDF is licensed under a Creative Commons License and
may be passed on electronically for free. It must not be copied for sale.
21.
IntroductionBefore going any further, why might you want to
consider the arguments and evidence presented in this
book? One reason is that, while it isn’t exactly a new
phenomenon, inequality in our society is getting worse
– particularly when we look at the growing gap between
the very wealthy and the rest, including those with least.
This matters because it appears that growing inequality
can make it harder to enact the policies that could most
improve our happiness.
When it was first observed that despite rising average
material wealth, people were not happier than their parents had been, researchers in economics – not in psychology, sociology or politics – began to ask why. Recently,
many economists have pointed out that old economic
growth models, those used by both the left and the right,
were failing.5 The new models concern findings that could
not have been made a generation ago, because then it
was true that well-being was generally increased by having more material goods. A generation ago, what people
needed above all else was a good enough home to live in
and the means to be able to keep it warm. A generation or
so before that, most people in the UK did not have spare
clothes, or enough money to eat well most of the time. In
our generation, many of us eat too much. Most people,
although far from all, now have enough.
Recent research has shown that now, living in a country
with higher levels of well-organized collective spending
produces a happier population; and that when countries
3
Both a paperback version and high-resolution and fully interactive ebook versions
of this book are available to buy direct from the publisher at http://bit.ly/1oGOx9m
22.
A BETTER POLITICSare compared, public policies such as social insurance and
employment protection are among the most important
factors in predicting well-being among citizens. This
may come as a surprise if you think that being taxed as
little as possible is what gives people the most economic
freedom and leads to them enjoying ‘life, liberty and the
pursuit of happiness’ to the fullest. It is worth reflecting
that Thomas Jefferson wrote those famous words into
the American Constitution. Many believe that he took
inspiration for this from John Locke, who had written, in
his ‘Essay concerning human understanding’, that ‘The
highest perfection of intellectual nature lies in a careful
and constant pursuit of true and solid happiness.’
Economist Benjamin Radcliff summarized his research
findings on this for an American audience:
The differences in your feeling of well-being living in
a Scandinavian country (where welfare programs are
large) versus the US are going to be larger than the
individual factors in your life. The political differences
trump all the individual things you’re supposed to do
to make yourself happier – to have fulfilling personal
relationships, to have a job, to have more income. The
political factors swamp all those individual factors.
Countries with high levels of gross domestic product
consumed by government have higher levels of personal satisfaction. 6
Radcliff is correct about the correlations when happiness is measured carefully,7 but of course people do
4
This low-resolution PDF is licensed under a Creative Commons License and
may be passed on electronically for free. It must not be copied for sale.
23.
Introductionnot wake up each day and check how much their government spends and feel happier if taxation and public
spending is higher. Living in better-organized (and often
higher-taxing) countries makes leading our personal
lives easier, allows us to get on with our families, and
with other people more widely. (Although there are
also societies where overall taxation is lower but where
income inequality is lower and well-being is higher than
in the UK. 8)
Until recently, economists’ models have maximized
what they call ‘utility’: the satisfaction achieved from
the consumption of a good or service given individual
preferences. However, a growing number of economists
have, in the last twenty years, started looking at happiness instead. 9 Before the 2008 crash, some leading economists began arguing that there were things that were
much more important to life and well-being than money.
For example, Ann Pettifor10 and Anastasia Nesvetailova11
foresaw the turmoil to come in 2008 and argued that
there was a need for new understanding in economics.
That new understanding should include a better appreciation of happiness.
Alois Stutzer and Bruno Frey have recently shown
that people in more consumerist societies are likely to
overestimate how much enjoyment they will gain from
the goods they consume, and they discount the harm
working too many hours and commuting too much
will cause them. As Stutzer and Frey put it, ‘suboptimal
5
Both a paperback version and high-resolution and fully interactive ebook versions
of this book are available to buy direct from the publisher at http://bit.ly/1oGOx9m
24.
A BETTER POLITICSchoices result’.12 Even more recently, John Helliwell has
shown that environmental sustainability depends on
well-being:
If people really are happier working together for a
worthy purpose, this exposes a multitude of win–win
solutions to material problems, thereby building community while meeting material needs.13
This new thinking has wide-reaching implications. It has
emerged because we are so much better off, in material
ways, than our parents were – and yet no happier.
As happiness economics is based on relating wellbeing to other life events, economists Gus O’Donnell
and Andrew Oswald have recently explained that the
new economic research has:
one strength that may not be completely recognized
by all economists. People are not asked how much one
thing makes them happy compared to another. Deeply
complicated cause-and-effect survey questions are
thereby largely eschewed, and that is an advantage.14
You do not ask people what they think makes them
happy, but instead observe how their levels of happiness
change and try to associate that with other changes in
their lives at that time.
This book is heavily influenced by happiness economics, but I am not an economist and so it also uses a wider
range of sources from the social sciences, humanities
6
This low-resolution PDF is licensed under a Creative Commons License and
may be passed on electronically for free. It must not be copied for sale.
25.
Introductionand sciences, and includes many examples from current
affairs. To present consistent evidence, results from
a single survey of happiness are referred to, but it is
important to recognize the much wider context to this
work. Many recent studies point in similar directions. The
sense that it is time we measured success differently is
infectious. On 28 June 2012, the General Assembly of the
United Nations agreed to pass resolution A/RES/66/281,
which states that:
The General Assembly, … Conscious that the pursuit of
happiness is a fundamental human goal, … Recognizing also the need for a more inclusive, equitable and
balanced approach to economic growth that promotes
sustainable development, poverty eradication, happiness and the well-being of all peoples, decides to proclaim 20 March the International Day of Happiness.15
Thomas Jefferson might have approved.
So what does promote happiness? To try to answer
this question, in 2006 a colleague and I investigated some
data about what is most important to people, and how
that might relate to their health and happiness. More
recent work by others suggests that what we found a
decade ago continues to hold true.16 In Britain, a large
household panel study has been conducted annually for
the past twenty-five years. In four of those years (September 1992 to December 1995) an unusual question was
added. It was unusual because to answer this question,
7
Both a paperback version and high-resolution and fully interactive ebook versions
of this book are available to buy direct from the publisher at http://bit.ly/1oGOx9m
26.
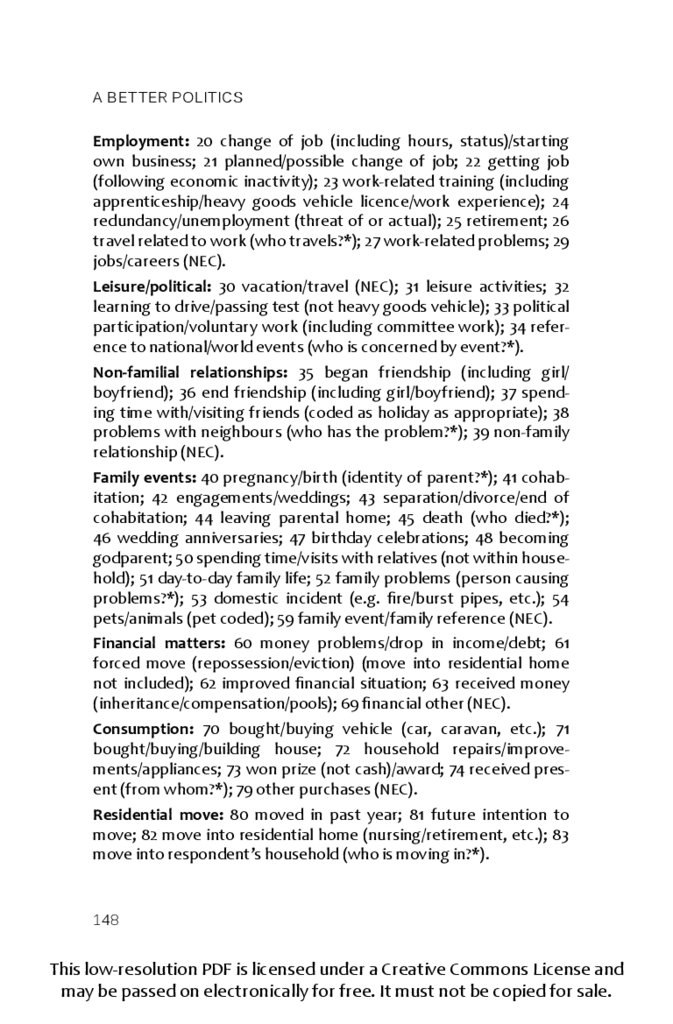
A BETTER POLITICSyou had to write in an answer. Here is the question. Try
it yourself in relation to the most recent twelve months:
State in your own words what in the last year has
happened to you (or your family) which stood out as
important.
It is a straightforward question. So please record
your responses, but don’t feel bad if you don’t have four.
Up to four responses can be recorded.
1. .......................................................................................
2. .......................................................................................
3. .......................................................................................
4. ......................................................................................
Over ten years later I remain shocked by the responses
people gave. It is fair to say that this question was asked
at the end of a very long interview-style survey. Perhaps
many people were simply sick of answering questions.
Maybe they thought that some of the answers they had
already given covered everything that mattered. Nevertheless, a large and representative sample of the population answered, so it is worth considering carefully what
they said.
8
This low-resolution PDF is licensed under a Creative Commons License and
may be passed on electronically for free. It must not be copied for sale.
27.
IntroductionIn the UK, in those years (1992–1995), a majority of
the up-to-four answers were left blank: ‘Nothing else
of importance happened to us’. Most people only noted
down one or two things. There were as many people
recording nothing at all as there were people who listed
three or four events.
Nothing happens to most people most of the time; at
least nothing that they would say is important to them. Out
of the 143,86017 possible opportunities to give responses
to that question in this survey over those years, 94,911
(66%) were either left blank or filled in as something equivalent to ‘nothing’. The second most common response
was to state that someone in your family other than you
had ended or started a relationship (3,728 events, 3%).
The third most common was to report that you had gone
on holiday (3,635, 3% again), the fourth most common
was that you had moved home (2,810, 2%), and the fifth
most common was that something had happened to your
health (2,678 responses, 2%). Many more than 2% of people
move home in a given year, but for many who do it was
just not an important enough event to list.
People are very forgetful. Men are more likely to be
forgetful than women.18 The survey revealed that men
who have just become fathers are far less likely to list
their new baby as an important event than women who
have just become mothers. One of the first things we
discover is that life is not that eventful for many people
much of the time, but also that the usual preoccupations
9
Both a paperback version and high-resolution and fully interactive ebook versions
of this book are available to buy direct from the publisher at http://bit.ly/1oGOx9m
28.
A BETTER POLITICSof the media tend not to appear. When unprompted,
hardly anyone answers ‘immigration to Britain rose and
this harmed me and my family’ or ‘I worried about government economic policy this year’. Respondents also
do not mention terrorism, or at least they did not at the
time of those surveys.19
So, if you struggled to come up with four important
things that happened to you or your family in the past
twelve months, don’t despair, but please do write in an
answer on at least one of the four lines above if you can
– and then I’ll ask you one more question at the start of
the next chapter.
As I’ll explain below, it turns out that half of all the
important things that happened to people in the past year
were not associated with being significantly happier. For
example, most health-related events were not, on average, good news for most people. You probably do not want
any of the four most important things that happened to
you in the last year to concern your health. Worry, anxiety
and clinically diagnosed depression are now rising generation after generation among young people in the most
unequal of affluent countries.20 This affects the children
of the rich in our society just as much as those of affluent,
average, modest or poor backgrounds.
A better politics is not simply a politics that maximizes individual happiness related to everyday events,
including those important, personal events. We also
gain happiness from clean air and green spaces in ways
10
This low-resolution PDF is licensed under a Creative Commons License and
may be passed on electronically for free. It must not be copied for sale.
29.
Introductionthat surveys (such as the one used here) cannot pick up,
even though other studies do. 21 Governments also need
to consider long-term issues such as climate change, species extinction, pollution and avoiding war, famine and
plagues. 22 But governments – the politicians that constitute them, the civil servants who work for them, and all
of us who vote – also occasionally need to be reminded
of what it is that actually preoccupies most people.
The UK prime minister at the time of writing, David
Cameron, floated the idea of the government monitoring happiness in 2005, and introduced a happiness
index in 2010. 23 In 2015 the first baseline measures were
published. 24 It will be interesting to see how they have
changed by 2020. A recent report sponsored by the UK
government described ‘the most compelling evidence’
for a link between economic performance and higher
well-being. This came from a study of a manufacturing
plant in Finland, which found that a one-point increase
in job satisfaction (on a six-point scale) resulted in a 9%
increase in productivity. 25
My first and most important suggestion for a better
politics is that governments should concern themselves
with what matters most to people, according to the evidence. This means people have to be asked.
The next chapter explores what we can learn from
surveys that do just that. The results are surprising. They
hold valuable lessons for politicians, no matter what
party they represent.
11
Both a paperback version and high-resolution and fully interactive ebook versions
of this book are available to buy direct from the publisher at http://bit.ly/1oGOx9m
30.
Chapter 2Basic needs
Human beings, who are almost unique in having the
ability to learn from the experience of others, are also
remarkable for their apparent disinclination to do so.
— Douglas Adams and Mark Carwardine26
I
t was ten years ago, just before the global financial
crisis, that my colleague Dimitris Ballas and I conducted
our experiment using the answers people had written at
the end of the survey described above. We tried to discover the secret to happiness. We coupled the answers
with additional data on the same people’s state of happiness. Events that in retrospect stood out as important to
you or your family are good potential candidates for the
things that significantly affected your state of happiness.
One reason to search for the secret to happiness was
that many researchers had begun to worry that something was wrong. My colleague Dimitris is an economist
by background, and had been trained to consider people
as rational economic agents, all continually aiming to
maximize their individual satisfaction or ‘utility’. 27 In the
This low-resolution PDF is licensed under a Creative Commons License and
may be passed on electronically for free. It must not be copied for sale.
31.
Basic needsorthodox theory, wider society was of little importance.
But what if many people individually striving to maximize
their own utility cause harm, in aggregate, to the crowd?
And what if one needs to be part of a happy crowd to
maximize one’s own happiness?
So now here’s the second question.
Have you recently been feeling reasonably happy, all
things considered?
Take your pick and please circle just one answer
below: 1, 2 or 3.
1. No, I’ve generally felt less than reasonably happy.
2. I’ve felt the same as usual.
3. Actually, I’ve felt more than reasonably happy.
If you answered 1 or 3, why? What has made you more or
less happy? Do you know? Is it possible to know and articulate your feeling as a number? Might it be in your nature to
be happier than might reasonably be expected, or less
happy than you consider it would be reasonable to be?
Here, the baseline is the level of happiness it is reasonable to expect. It is admittedly vague and, by definition,
highly subjective. Yet this was exactly how the question
was put to participants in the British Household Panel
Surveys of the 1990s.
13
Both a paperback version and high-resolution and fully interactive ebook versions
of this book are available to buy direct from the publisher at http://bit.ly/1oGOx9m
32.
A BETTER POLITICSDimitris and I compared what unprompted events
people recorded in the survey with their average reported
levels of happiness, and we tabulated our findings. As this
book is using our results, there is a large extract from that
table below (see table 1). Lamentably, the table does not
give the answer to life, the universe and everything, but it
is an attempt to summarize what appears to matter most
to the lives of typical British people in the 1990s.
What mattered most in the 1990s is probably still of
most significance to people today. Furthermore, it takes
many years to digest the results of data like this and to
begin to link this table to other political, economic and
social events and subsequent evidence. Also, later surveys tend not to ask people these questions so directly
and without prompts.
It turns out that many of the answers that we found
to be important have been known for a very long time.
And, in hindsight, they are not that surprising. But it may
also be the case that people can forget what matters
most. The UK in the past forty years appears to have
become one of those more forgetful places.
Another reason you haven’t heard of our findings
before is because the table was titled ‘OLS regression
equation of subjective happiness and major life events
(adjusted for gender, age, age squared and education)’.
Both that title and the fact that it was printed on
page 1,249 of a very academic journal understandably
helped put people off the scent. 28
14
This low-resolution PDF is licensed under a Creative Commons License and
may be passed on electronically for free. It must not be copied for sale.
33.
Basic needsNow the time is right to reveal all.
The answer to the secret of happiness is … ‘34’ – a little lower than the ‘42’ prophesied by Douglas Adams in
The Hitchhiker’s Guide to the Galaxy.
There are thirty-four events that happen in our lives
with sufficient frequency and importance to warrant
consideration here. The most common is ‘Nothing
important happened to us this year’. If you replied earlier that you are a little less happy than usual, as nothing
important has happened to you recently, then you are
not alone. Everybody hurts (sometimes).
Table 1 lists the thirty-four ‘things’ that can happen
to you in the order of those most likely to correlate with
you reporting greater happiness to those most correlated with reporting the least happiness. In the second
column of the table, the effect of each event is modified
by how frequently it occurs, and the final column shows
the ranking based on that prevalence. For any individual,
it is the first and third columns of the table that matter
most. We cannot be happy all the time, because many
sad things will happen to us, but we can at least begin to
concentrate more on what it is that matters most, and
try a little harder to prevent or delay that which harms
our happiness the most, rather than concentrating on
trying to achieve things that are not so strongly associated with well-being.
This book is ordered into chapters that group the
events listed below into a well-known hierarchy of
15
Both a paperback version and high-resolution and fully interactive ebook versions
of this book are available to buy direct from the publisher at http://bit.ly/1oGOx9m
34.
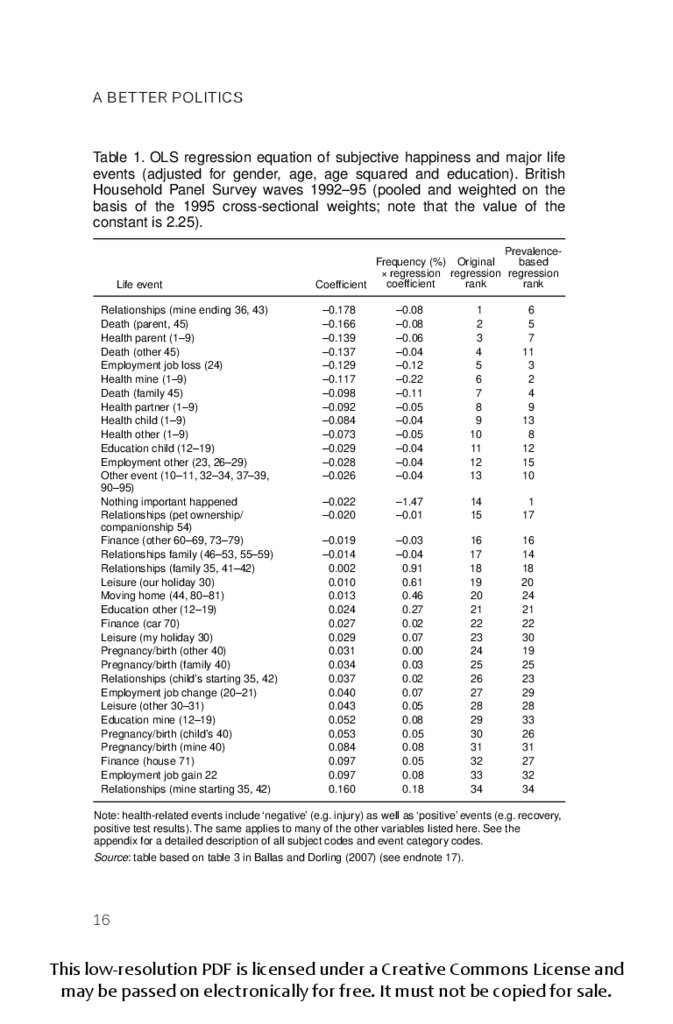
A BETTER POLITICSTable 1. OLS regression equation of subjective happiness and major life
events (adjusted for gender, age, age squared and education). British
Household Panel Survey waves 1992–95 (pooled and weighted on the
basis of the 1995 cross-sectional weights; note that the value of the
constant is 2.25).
Life event
Relationships (mine ending 36, 43)
Death (parent, 45)
Health parent (1–9)
Death (other 45)
Employment job loss (24)
Health mine (1–9)
Death (family 45)
Health partner (1–9)
Health child (1–9)
Health other (1–9)
Education child (12–19)
Employment other (23, 26–29)
Other event (10–11, 32–34, 37–39,
90–95)
Nothing important happened
Relationships (pet ownership/
companionship 54)
Finance (other 60–69, 73–79)
Relationships family (46–53, 55–59)
Relationships (family 35, 41–42)
Leisure (our holiday 30)
Moving home (44, 80–81)
Education other (12–19)
Finance (car 70)
Leisure (my holiday 30)
Pregnancy/birth (other 40)
Pregnancy/birth (family 40)
Relationships (child’s starting 35, 42)
Employment job change (20–21)
Leisure (other 30–31)
Education mine (12–19)
Pregnancy/birth (child’s 40)
Pregnancy/birth (mine 40)
Finance (house 71)
Employment job gain 22
Relationships (mine starting 35, 42)
Prevalencebased
Frequency (%) Original
× regression regression regression
rank
coefficient
rank
Coefficient
–0.178
–0.166
–0.139
–0.137
–0.129
–0.117
–0.098
–0.092
–0.084
–0.073
–0.029
–0.028
–0.026
–0.08
–0.08
–0.06
–0.04
–0.12
–0.22
–0.11
–0.05
–0.04
–0.05
–0.04
–0.04
–0.04
1
2
3
4
5
6
7
8
9
10
11
12
13
6
5
7
11
3
2
4
9
13
8
12
15
10
–0.022
–0.020
–1.47
–0.01
14
15
1
17
–0.019
–0.014
0.002
0.010
0.013
0.024
0.027
0.029
0.031
0.034
0.037
0.040
0.043
0.052
0.053
0.084
0.097
0.097
0.160
–0.03
–0.04
0.91
0.61
0.46
0.27
0.02
0.07
0.00
0.03
0.02
0.07
0.05
0.08
0.05
0.08
0.05
0.08
0.18
16
17
18
19
20
21
22
23
24
25
26
27
28
29
30
31
32
33
34
16
14
18
20
24
21
22
30
19
25
23
29
28
33
26
31
27
32
34
Note: health-related events include ‘negative’ (e.g. injury) as well as ‘positive’ events (e.g. recovery,
positive test results). The same applies to many of the other variables listed here. See the
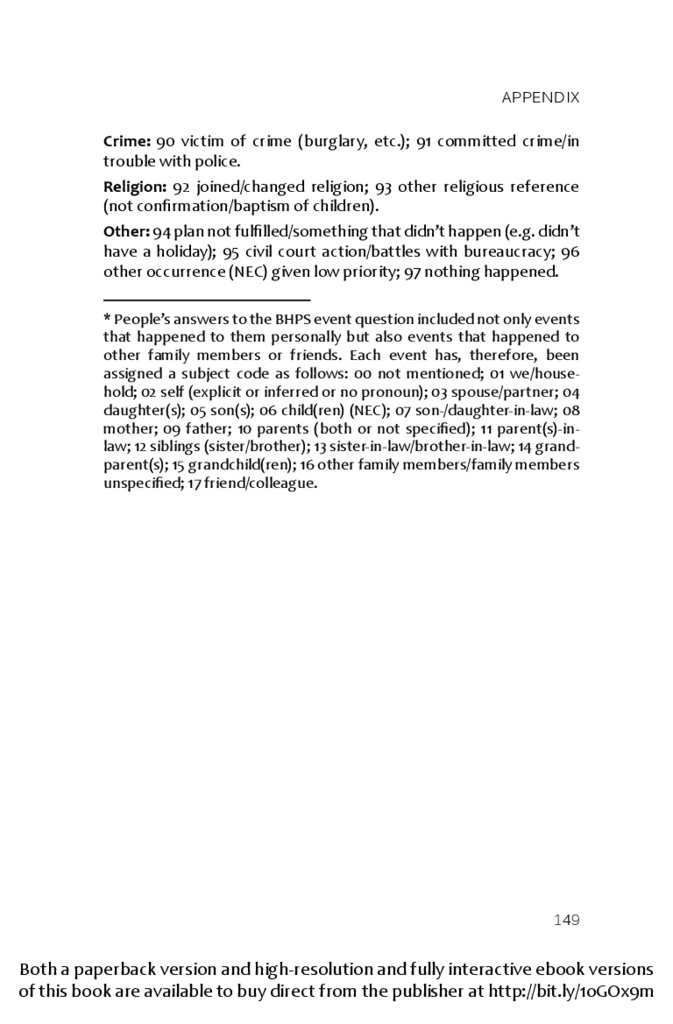
appendix for a detailed description of all subject codes and event category codes.
Source: table based on table 3 in Ballas and Dorling (2007) (see endnote 17).
16
This low-resolution PDF is licensed under a Creative Commons License and
may be passed on electronically for free. It must not be copied for sale.
35.
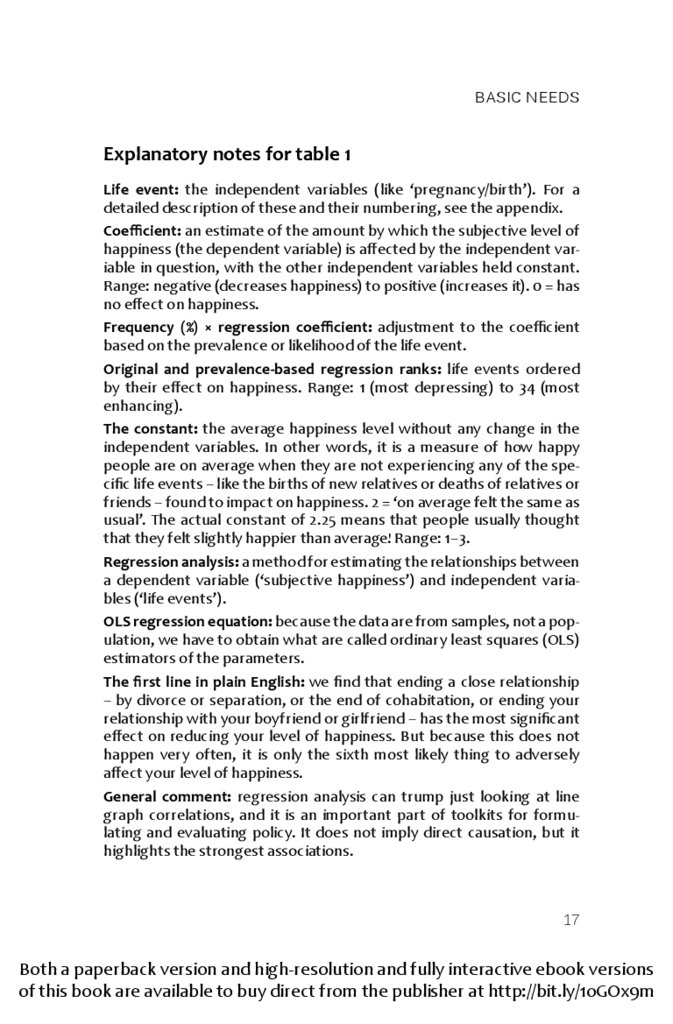
Basic needsExplanatory notes for table 1
Life event: the independent variables (like ‘pregnancy/birth’). For a
detailed description of these and their numbering, see the appendix.
Coefficient: an estimate of the amount by which the subjective level of
happiness (the dependent variable) is affected by the independent variable in question, with the other independent variables held constant.
Range: negative (decreases happiness) to positive (increases it). 0 = has
no effect on happiness.
Frequency (%) × regression coefficient: adjustment to the coefficient
based on the prevalence or likelihood of the life event.
Original and prevalence-based regression ranks: life events ordered
by their effect on happiness. Range: 1 (most depressing) to 34 (most
enhancing).
The constant: the average happiness level without any change in the
independent variables. In other words, it is a measure of how happy
people are on average when they are not experiencing any of the specific life events – like the births of new relatives or deaths of relatives or
friends – found to impact on happiness. 2 = ‘on average felt the same as
usual’. The actual constant of 2.25 means that people usually thought
that they felt slightly happier than average! Range: 1–3.
Regression analysis: a method for estimating the relationships between
a dependent variable (‘subjective happiness’) and independent variables (‘life events’).
OLS regression equation: because the data are from samples, not a population, we have to obtain what are called ordinary least squares (OLS)
estimators of the parameters.
The first line in plain English: we find that ending a close relationship
– by divorce or separation, or the end of cohabitation, or ending your
relationship with your boyfriend or girlfriend – has the most significant
effect on reducing your level of happiness. But because this does not
happen very often, it is only the sixth most likely thing to adversely
affect your level of happiness.
General comment: regression analysis can trump just looking at line
graph correlations, and it is an important part of toolkits for formulating and evaluating policy. It does not imply direct causation, but it
highlights the strongest associations.
17
Both a paperback version and high-resolution and fully interactive ebook versions
of this book are available to buy direct from the publisher at http://bit.ly/1oGOx9m
36.
A BETTER POLITICSneeds. Its most famous description appeared in a paper
by the American psychologist Abraham Maslow, published during World War II. 29
Given that Maslow was writing in 1940s America, it
is perhaps unsurprising that he concentrated on the
individual – with the relationship between the individual
and society being implied. He came up with a hierarchy
that started with basic physical needs and moved on up
to safety, love, esteem and, finally, self-actualization:
to realize your apparent potential and be all that you
can be.
In fact, ‘other people’ matter most in determining our
happiness. The event most strongly related to being less
happy than average is the ending of a close relationship.
The single event most strongly related to being happy
is starting a new relationship. It is hardly surprising that
most popular songs are about love. But we’ll get on to
love later, because if you look down the list in table 1,
you’ll see that sorrow associated with love is just as
important as the start of a new relationship.
Combined, the death of parents (1), or of any others
around you (2), and your own health (3) actually matter
more in aggregate than splitting up with someone. It is
just that those three events are separated in the table.
Similarly, the four types of pregnancy (mine, my child’s,
someone else’s in my family, and another’s), when combined, matter more than starting a new relationship
with someone.
18
This low-resolution PDF is licensed under a Creative Commons License and
may be passed on electronically for free. It must not be copied for sale.
37.
Basic needs19
Both a paperback version and high-resolution and fully interactive ebook versions
of this book are available to buy direct from the publisher at http://bit.ly/1oGOx9m
38.
A BETTER POLITICSEven though births and deaths are becoming more
spread out in time, they matter more in aggregate to our
happiness than starting and ending relationships with
our partners – an event that has become more frequent,
because more people marry more than once, and, on
average, have a greater number of exclusive relationships during their lifetimes than their parents did. 30
The table’s results suggest that what matters most
to us in aggregate is the health of those around us,
our health, and the births and deaths of relatives and
friends. We easily forget that the most valuable thing we
have is our health and the health of others around us.
People die on average at an older age than they used to,
fewer children are born per couple, and we enjoy much
better physical (if not mental) health than our parents or
grandparents. And yet, even given all that, these events
are still those that most prevent us from being happy or
that most often make us more than ‘reasonably’ happy.
What matters most to us as human beings does not
change quickly.
It is easier today not to think about death because it
is shielded from us, hidden away in hospitals and homes
for the elderly. Death is also hidden in miscarriages that
we don’t speak about; just as being unable to have a
child is hidden from polite conversation. On aggregate,
it makes people very happy to start a family, even if they
don’t always anticipate this, and it also makes grandparents very happy. However, bringing up a family does not
20
This low-resolution PDF is licensed under a Creative Commons License and
may be passed on electronically for free. It must not be copied for sale.
39.
Basic needsappear to make parents happier than other adults while
they are doing it (although that may vary by country, as
it can be easier in some places where childcare and good
schooling is more easily accessible and free).
We are also especially good at forgetting pain: a beneficial trait in itself, but it may make us underestimate
sorrow. If I had never seen the table above I would not
have been able to write about how important births and
deaths still are, despite knowing from my own life how
much they matter. I believed issues such as ‘the economy’, ‘the NHS’ or ‘immigration’ mattered the most,
because I have read so many news reports on opinion
polls. We are overloaded with polling information where
newspaper editors chose the questions that pollsters
ask, and it makes us think that we are odd if we place too
much emphasis on things that – according to polls – are
not seen by others as important.
It is normal to be most concerned with the mountainous problem that is immediately in front of you – no matter how insignificant a molehill it might later appear. Taking a driving test, for example. It took me five attempts
to pass. It was the hardest and most stressful test I ever
took. In hindsight I am very grateful to all those instructors who failed me, because I am still here and have not
hit and injured anyone else. I now mostly cycle, partly
because I know how likely (eventually very likely) it is
that I will be involved in a crash if I drive – I happen to
know the odds because I read the work of those who
21
Both a paperback version and high-resolution and fully interactive ebook versions
of this book are available to buy direct from the publisher at http://bit.ly/1oGOx9m
40.
A BETTER POLITICScalculate them. 31 (People have worked out the odds on
almost everything, some intriguing and some amusing.
For instance, you can easily find out how likely you are to
have sex given your age, where you live and your gender
– but for that you will have to buy another book. 32)
Although it appears in the base layer of Maslow’s
hierarchy, ‘sex’ didn’t feature at all in the list of most
important things that happened to people in the past
twelve months. Maybe it didn’t matter that much, maybe
we are a little prudish, or maybe other things mattered
more when we looked back. The least significant event
that just registers as statistically significant enough to be
included here is passing your driving test. Passing your
driving test is far harder than having sex. We mostly only
do it once (pass a driving test, that is), not all of us do it,
and it only just shows up as having a significant effect on
our overall happiness. In table 1, it is the most significant
element of the ‘thing’ labelled as: ‘Other event (10–11,
32–34,37–39,90–95)’ (see the appendix at the end of this
book for what those numbers mean). Much else that is
more trivial than passing a driving test matters, but not
enough, and not to enough of us at the same time, to
register when undertaking a study of this type.
There will be a great many things that this analysis
leaves out. For example, it is possible that something as
simple as the people around us smiling matters to our
happiness, and many other everyday events that we are
not aware of could be correlated to being happier than
22
This low-resolution PDF is licensed under a Creative Commons License and
may be passed on electronically for free. It must not be copied for sale.
41.
Basic needsusual. But we don’t record a stranger smiling as a significant event when asked. It is possible that frequently
being ignored matters greatly to us, but again we don’t
recognize that as an event other than in saying ‘nothing
happened’. Having a particular set of beliefs that you
hold that get you through life might matter. But as the
full title of the table says, it is a regression analysis using
pooled data from waves of surveys – nothing more,
nothing less.
Incidentally, that ‘constant’ of 2.25 matters quite
a lot. The constant is a measure of peoples’ average
recorded happiness level when they are not experiencing any of the specific life events mentioned as being
of any significance, such as births or deaths. This shows
that we tend to lean towards the optimistic. A value of 2
would indicate that the average response to the question of whether we are feeling reasonably happy is to
reply ‘same as usual’. In fact, more of us reply ‘more so
than usual’. In other words, we think we are – on average – more happy than usual. Unfortunately, this may be
a bad thing in the wider scheme of things because we
cannot on average be happier than average … and we
may overestimate how well we are doing compared with
what might be possible; but more on that later. 33
In between nothing of any importance happening to
you (the most likely thing) and passing your driving test
(the rarest event that shows up in the analysis) is much of
the rest of life’s rich tapestry: some thirty-two possible
23
Both a paperback version and high-resolution and fully interactive ebook versions
of this book are available to buy direct from the publisher at http://bit.ly/1oGOx9m
42.
A BETTER POLITICSother events. Some are not that unusual, such as taking a
holiday; others are profound, including experiencing the
death of a loved one. They all matter and, importantly, it
matters that they are not all that surprising.
The single event that on its own makes us happiest
is starting a relationship. Getting hired to do a new job
is the next most rewarding experience. Happiness can
be fleeting; changes of state can make us happiest. But
before we get to what makes us most happy, let’s worry
about what damages our happiness the most.
Death
What makes us most unhappy is the ending of a relationship, and – in aggregate – we become most unhappy
upon the ending of relationships as a result of death.
Most common is the death of a parent. For most of us,
when they die, our parents are the people we have known
the longest. However, just because it is a predictable
24
This low-resolution PDF is licensed under a Creative Commons License and
may be passed on electronically for free. It must not be copied for sale.
43.
Basic needsevent does not mean that we will deal with it well when
it occurs.
People in the UK are living longer and longer, but
recently there has been a drop in life expectancy for
women aged over sixty. The drop was ‘only’ five weeks
in length, but five weeks for the average older woman is
the equivalent to the average harm caused if all women in
Britain were to smoke an additional 9,163 cigarettes during
their lives. This is because each cigarette takes 11 minutes
off your life on average.34 For women aged over eightyfive, the group for whom the recent rise in mortality was
first recorded, there has been a drop of 2.5 months in life
expectancy in just two years. The number of deaths rose
abruptly in 2015, so these statistics will worsen.
Could it be that the rise in smoking in the past has
led to more of our mothers and grandmothers dying a
little earlier? Unnamed experts talking to The Telegraph
said that ‘the trend could be the result of changes in
the lifestyles of the “baby boomer” generation, with
older women more likely to drink regularly, and to have
smoked, than previous generations’. 35 But for this to be
true, there would have had to have been a remarkably
rapid take-up of cigarettes among women in the past,
especially among older women. It turns out that these
deaths were not due to lung cancer or similar causes,
and neither were the additional deaths due to flu. 36
Speculation – yet to be confirmed – suggests that
this rise in deaths among elderly women is related to
25
Both a paperback version and high-resolution and fully interactive ebook versions
of this book are available to buy direct from the publisher at http://bit.ly/1oGOx9m
44.
A BETTER POLITICSthe impact of austerity in the UK. In other words, when
home visits to those known to be vulnerable were cut,
when pensioner income credit was reduced, and when
residential homes were struggling, the frailest of the
elderly were more likely to die a little earlier. One director
of public health that I spoke to described impoverished
elderly women living on their own as ‘the canaries in
the mine’. There were tens of thousands of women who
died a little too early in Britain in 2012, 2013 and almost
certainly through to 2016, although data for the past
two years has yet to be released. 37
The fact that the rise in mortality was much higher
for elderly women than for men perhaps gives us a clue.
Elderly women are much more likely than elderly men to
be living on their own. Men die on average earlier than
women, and usually marry women a few years younger
than themselves. Men are also usually much better off
(financially) than women in old age.
As well as being more likely to be poor and to live
alone, women in the UK have borne the brunt of austerity measures. Some 85% of the cuts to benefits have
already been taken from women – around £22 billion in
the period 2010–14 – and the cuts are projected to rise
rapidly in the 2015–19 period. 38 Almost the entire UK government deficit is to be repaid through sacrifices made
by women. Men are usually better off than women,
and their pensions are higher; furthermore, women
more often end up in low-paid work because of care
26
This low-resolution PDF is licensed under a Creative Commons License and
may be passed on electronically for free. It must not be copied for sale.
45.
Basic needsresponsibilities, which is one reason that they get worse
pensions. A group of largely male politicians decided
that women should bear most of the burden of cuts.
Preventing the deaths of young people is often seen as
much more important than preventing avoidable mortality among the frail and old. And yet even if you agree with
that, you should stop and think about those who are left
behind. Because people do care about deaths. Peoples’
happiness plummets most when others close to them die.
The vast majority of deaths are of the very elderly.
Think about how you might end up if you are lucky
enough to die old. Let me say that again, because people
don’t like to think about this, and that might be part of
our more general political problem. In what sort of a
society, with what kind of care, do you want to end up?
Do you want your relatives to have time to visit you, or
would you rather they were working all available hours
to perform better economically? Do you want the people
who are caring for you towards the end of your life to be
worrying more about how they will pay their own bills
on their low income or worrying more about you? Will
you end up feeling like a burden to everyone around you?
The vast majority of the deaths that we experience
are of people older than us: our grandparents, and then
our parents. Despite the predictability of most deaths,
they shock us deeply. The death of a parent is almost as
damaging to our happiness as the end of a relationship
with a partner. It is the second most damaging life event
27
Both a paperback version and high-resolution and fully interactive ebook versions
of this book are available to buy direct from the publisher at http://bit.ly/1oGOx9m
46.
A BETTER POLITICSof all the thirty-four discussed here in terms of its effect
on our happiness. We need fewer deaths among the
young, more ‘good deaths’39 of those older than us, and
a better way of coming to terms with death generally.
That is not what we have had in recent years. Even the
very rich often have bad, lonely deaths in the UK. 40
The hardest deaths to cope with are those for which
there is little warning, and when people die out of the
expected age order. The saddest deaths recorded are those
of grandchildren by grandparents, and of children by parents. These are the rarest but they result in the greatest
drop in happiness. The deaths of the young are also the
most preventable, and preventing them has much wider
benefits to family and friends than any cost–benefit model
ever measures, because of their wider ramifications.
In the UK we tolerate much higher death rates among
the young than are tolerated in the rest of Western
Europe. Perhaps we are not so good at understanding
how important mutual care, compassion, solidarity and
cooperation are? The US has the highest infant mortality
rate in the rich world because so many parents there
bring children into the world while in poverty. In the UK
we do not do much better.
Around 6,000 children die each year in the UK, mostly
when very young. In 2014 a paper in The Lancet explained
that the UK was in the worst section of the Western
European league table for both infant and child mortality, and below ‘countries including Cyprus, Greece, Spain
28
This low-resolution PDF is licensed under a Creative Commons License and
may be passed on electronically for free. It must not be copied for sale.
47.
Basic needsand Portugal and … more in line with Poland and Serbia
than with the high performing countries such as Iceland,
Sweden and Germany’. 41 Perhaps people in the UK don’t
care much about it. Maybe we think these deaths almost
always occur to other peoples’ children, and we don’t
worry as much about other people as those in other
affluent countries do? Infant death rates are highest
within the UK in the poorest inner cities and in Northern
Ireland. In all of the rest of Europe, only parents in Romania and Malta see more of their infants die. 42
The UK has the highest level of economic inequality – the widest differences between rich and poor – in
Europe. The best-off 10% in the UK take 28% of national
income, a larger share than in any other European country. This gap is almost entirely due to the best-off 1% in the
UK taking such a large slice of the cake. 43 People in more
economically unequal countries trust each other less
and think of many others around them as less deserving.
Lower trust and greater inequality move together hand
in hand. 44 It is because of how we organize our society
that, for every one hundred children born, twice as
many children die in childhood in the UK than in Sweden.
There were no causes of death that were significantly
more frequent in Sweden than in the UK. 45 How society
is organized affects all causes of death, from infection to
congenital malformation to car crashes.
In affluent countries, the most common cause of
sudden death of children, young adults and the elderly
29
Both a paperback version and high-resolution and fully interactive ebook versions
of this book are available to buy direct from the publisher at http://bit.ly/1oGOx9m
48.
A BETTER POLITICSis to be hit by a car. In fact it is now widely agreed that
the word ‘accident’ should no longer be used to describe
these deaths, as in aggregate they are very predictable.
Children in the UK are twice as likely to be killed when
crossing the road as those in France, Norway or the Netherlands. 46 None of these individual deaths is ‘expected’,
but the number is very predictable year on year, as is the
effect on surviving family and friends. Similarly, it is also
a devastating shock when people kill themselves or die
from drug poisoning or overdoses. Despite recent rises
in the relevant figures, these deaths continue to surprise, and destroy, families. Because the chances of such
an event at any one time are rare, we tend to discount
the overall risk and burden. We also dislike talking about
mental illness. Because of this, as a society, we ignore
too much avoidable suffering. Of the eleven affluent
countries for which comparable statistics exist, we in the
UK are second only to the US in terms of the frequency
of mental illness. 47
However, in other measures (such as suicide rates)
we fare better than other countries. There is nothing
inevitable about these rankings. Murders, for example,
are much rarer in the UK than in the US, for the obvious
reason that guns are far harder to obtain in the UK. What
little gun crime there is in the UK is more commonly found
in the countryside than in the city.48 The suicide rate in the
UK, although rising, is much lower than in France, where
a higher rate of suicides has been tolerated for longer.49
30
This low-resolution PDF is licensed under a Creative Commons License and
may be passed on electronically for free. It must not be copied for sale.
49.
Basic needsHowever, suicide remains the leading single cause of
death for those aged 25–49, accounting for 26% of the
deaths of all men who die in the UK between the ages of
20 and 34 (and 13% of women in that age range), and of a
further 13% of all men who die by age 49.50 The absolute
numbers who die due to suicide are higher in the forties
than at any other point in life. All else being equal, our happiness levels tend to fall as we grow older and gain more
responsibilities, regrets and recriminations; but they then
rise again after our forties. We then begin to appreciate
our blessings more and dwell less on misfortunes.51
In other causes of death not due to disease, the UK
also fares poorly. Of thirty-two European countries, the
UK has the fourth highest rate of drug-induced death
amongst those aged 15–64, and that was before recent
rises in UK drug-related deaths. 52 In September 2015 it
was reported that 3,346 people in England and Wales
had died as a result of drug poisoning in the year 2014.
This is the highest number since records began, and
two-thirds of those deaths involved illegal drugs. 53 There
was a 64% increase in deaths involving heroin and/or
morphine in England and Wales between 2012 and 2014.
That is an unprecedented increase in such a short time.
Why do so many more people become addicted to drugs
in the UK than in many other affluent countries, and why
is the rate rising now? Deaths involving cocaine rose by
46% over the same period. Figures for 2015 will not be
available until late in 2016.
31
Both a paperback version and high-resolution and fully interactive ebook versions
of this book are available to buy direct from the publisher at http://bit.ly/1oGOx9m
50.
A BETTER POLITICSPoliticians often dislike coroners commenting on the
underlying social and political causes of excess premature mortality. The reaction of the government to the
news of rising mortality in 2015 was to say:
Any death related to drugs is a tragedy… Our drugs
strategy is about helping people get off drugs and stay
off them for good, and we will continue to help local
authorities give tailored treatment to users. 54
Yet, at the same time, local authority budgets were
being cut, and cut again. One result has been the loss of
much valuable local collective experience of dealing with
drug addiction. In November 2015 one local resident of
Oxfordshire wrote to the council complaining about the
extent of the cuts to local services, saying he could not
understand why services were being cut when funding
had only had a ‘slight fall’. The Conservative leader of
Oxfordshire County Council wrote back to him to explain
that the fall was £72 million, or 37% of local budgets, and
was not ‘slight’. The resident in question was the prime
minister, David Cameron. 55
Dealing with what life throws at us individually is very
different from dealing with it on a collective basis. None of
us can completely protect ourselves from pain, or ensure
we maximize our happiness and minimize our suffering
at all times. But we can work together to increase our
overall well-being and minimize the risk of the harm that
could befall any of us. We can ensure that services exist in
32
This low-resolution PDF is licensed under a Creative Commons License and
may be passed on electronically for free. It must not be copied for sale.
51.
Basic needscase we or our friends or family need them, but instead
we voted to cut council budgets, reduce rehabilitation
assistance for drug addicts, and cut social service visits to
elderly people, harming most those that live on their own.
Other affluent countries take reducing mortality
more seriously. For example, in 1997 the Swedish parliament introduced a policy called ‘Vision Zero’ that
required avoidable deaths and serious injuries on Swedish roads to be reduced to zero by the year 2020, and it
commanded government to ensure that it happens. 56 In
other countries road networks are built to minimize traffic crashes. The worth of a human life is set many times
higher in their cost–benefit analyses of new underpasses
and bridges, or in decisions over what speed traffic
should be slowed down to. Public transport systems are
promoted because they are far safer, and more cycling
and walking are encouraged. Not so in the UK. Here we
are still battling to have 20 miles per hour zones introduced into most towns and villages, in residential streets
and near shops and schools. By 2030 over a quarter of
the UK population will be aged over sixty-five. When hit
by a car at an impact speed of 30 mph, the risk of fatality
for pedestrians aged sixty or older is 47%, compared with
a figure of 5% for younger adults. 57
The stories our mortality statistics tell are all about
real people and communities; they are not just abstract
statistics. In 2014 two pensioners were killed on the A49
road near Church Stretton in Shropshire, an area with
33
Both a paperback version and high-resolution and fully interactive ebook versions
of this book are available to buy direct from the publisher at http://bit.ly/1oGOx9m
52.
A BETTER POLITICSa population of 4,700. These deaths were reported as
having had:
a large impact on this small town, affecting many
people and extending well beyond the boundaries
of close family and friends. Both of those killed were
well known and both were physically active and going
about their normal everyday tasks. 58
As more of us die in old age, more of us may want to
have more control over how, and exactly when, we will
die. Deaths affect the living in detrimental ways more
than any other major influence on self-reported levels of
happiness. We should care more about surviving friends
and family than we currently do. Government should
include estimates of the harm done to the lives of surviving friends and relatives in its calculations of whether it
is worth designing safer roads and making other policies
less harmful and more helpful. 59
Across the UK today, small campaigning groups are
working to reverse the rising trends in drug overdoses, in
road deaths, in early childhood mortality and in preventable
deaths amongst the elderly. The reason they give for their
work is simple: the effects on those who are left behind, on
the survivors.60 We don’t like to talk about death, but death
matters. We should learn from the countries where earlier
and sudden deaths are rarer than in the UK.
We urgently need to ascertain why there has been a
recent reduction in life expectancy among the elderly in
the UK, especially among women.
34
This low-resolution PDF is licensed under a Creative Commons License and
may be passed on electronically for free. It must not be copied for sale.
53.
Basic needsWe need to prioritize actions that reduce the number
of sudden deaths among young people. Specifically, the
prevention of road deaths and deaths from drugs must
become a focus of urgent importance. We need to look
at other countries to understand why our children are
now among the most likely to die young in all of Europe.
We need to talk more about suicide – because among
those entering middle age it is now the most common
cause of death.
We need to think more about good deaths and good,
long lives.
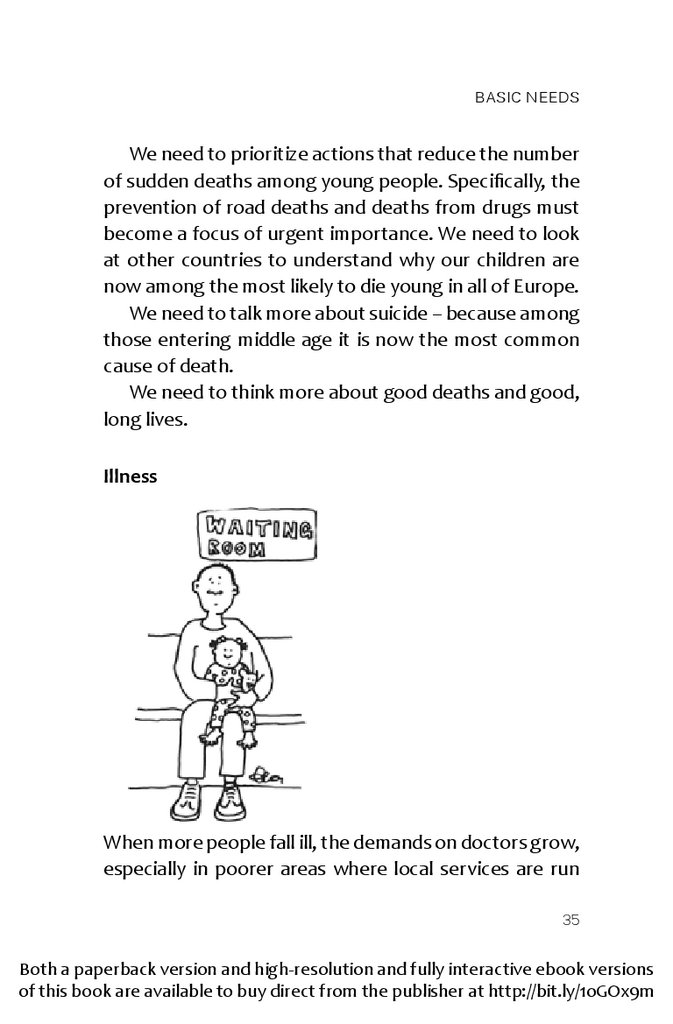
Illness
When more people fall ill, the demands on doctors grow,
especially in poorer areas where local services are run
35
Both a paperback version and high-resolution and fully interactive ebook versions
of this book are available to buy direct from the publisher at http://bit.ly/1oGOx9m
54.
A BETTER POLITICSdown. Four out of every five hospital consultants in the
UK were considering early retirement in 2015. Two out of
five work overtime every week, all year, without fail. One
NHS consultant’s experience is characteristic of recent
changes and experiences:
For the first time in my life on anti-depressants … it
affected my sleep… [I am] not very tolerant with
kids… [I am] unable to support them through GCSEs
and A-levels … due to stresses at work. 61
Nurses and other health workers report similar
fatigue, and have far lower incomes than consultants.
Social workers, old age home carers, porters, paramedics:
all are seeing their standard of living fall as wages in the
public sector are frozen and as tax credits are removed.
When those looking after our health are becoming more
anxious and less healthy themselves, the rest of us cannot
be cared for so well. Both in the NHS and beyond it, the
majority of carers are women, who live longer than men,
but who also live longer in ill health.
In winter 2015 a junior doctor who works in the
accident and emergency department of an NHS hospital wrote to me. She told me that sometimes the only
thing she could do that was actually of use was spend
time with a patient, listening. But that is incompatible
with the four-hour target to discharge people, so staff
end up passing ‘complicated’ patients around the
NHS. In November 2015 the Organisation for Economic
36
This low-resolution PDF is licensed under a Creative Commons License and
may be passed on electronically for free. It must not be copied for sale.
55.
Basic needsCo-Operation and Development (OECD) explained that
the UK needed an extra 47,700 nurses and 26,500 doctors to be able to match provision in France, Canada,
Belgium, Germany, New Zealand and Denmark. At an
annual cost of £5 billion a year, this would require higher
taxation, 62 but it would allow better staffing levels at
weekends, in August and during other holiday periods.
Putting extra money into hospitals makes little difference, though, if they can’t discharge patients because
there is no social care available locally, which is the case
in many areas. Mental health funding cuts leave more
people in hospital beds because it is not safe for them to
go home. Among the population as a whole, resilience
and life skills are declining; front-line accident and emergency services are now replacing general health education. The doctor who explained all of this to me in her
letter said that the NHS needed more funding in public
health to prevent future healthcare being overwhelmed.
She was young and enthusiastic, not burnt out like so
many of her older colleagues. However, despite being a
doctor, she could only just pay her rent in a shared house.
All around her, services were being offered for tender to
the lowest bid from any private provider.
As American astronaut John Glenn once said of the
experience of being launched into space, ‘I feel about as
good as anybody would, sitting in a capsule on top of a
rocket that were both built by the lowest bidder’. Being
cared for in old age in a care home that is being run at
37
Both a paperback version and high-resolution and fully interactive ebook versions
of this book are available to buy direct from the publisher at http://bit.ly/1oGOx9m
56.
A BETTER POLITICSthe lowest possible cost, being looked after by people
who can find no other work – people who leave their
jobs as fast as they can get a better one – what kind of
an old age will that be?
As yet, the freezing of NHS funds at current levels
(‘ring-fencing’) is not being suggested as a major reason
for the rising mortality rates among some groups in the
UK. However, part of what is going wrong in the short
term is that the Department of Work and Pensions
(DWP), which is separate from the NHS, requires its
staff, especially those at a relatively junior level, to make
daily decisions about individuals that could directly harm
their health. The DWP publishes guidance for Job Centre
officials who decide whether claimants who may have
infringed rules should have their payments stopped.
The guidance says: it would be usual for a normal
healthy adult to suffer some deterioration in their
health if they were without:
1. Essential items such as food, clothing, heating and
accommodation, or
2. Sufficient money to buy essential items for a period
of two weeks.
The Decision Maker must decide if the health of the
person with the medical condition would decline more
than a normal healthy adult. 63
Research published at the end of 2015 demonstrated
that for every 10,000 assessments the DWP undertakes
in just one of the programmes designed to cut benefits
38
This low-resolution PDF is licensed under a Creative Commons License and
may be passed on electronically for free. It must not be copied for sale.
57.
Basic needs(the Work Capability Assessment), an additional 7,020
antidepressants have to be prescribed and an additional
six suicides result. In the four-year period 2010–13, some
1.03 million existing claimants were reassessed (3% of the
working-age population). The number of suicides associated with this programme was 590, and the number of
additional antidepressants prescribed was 725,000. 64
These numbers will be far higher by the time you read
this; with every single number representing an individual
story of tragedy. 65 All the while, hundreds of thousands
of people receiving government-sponsored ‘psychological preparation’ sessions, 66 supposedly to make them
‘work ready’, are being repeatedly given demeaning
messages such as: ‘Nobody ever drowned in sweat.’ 67
We choose how much we prioritize our health and
well-being over competing commitments. In other
countries in Europe more is spent on welfare and health.
Health spending per person is 49% higher in Germany,
41% higher in Denmark and 27% higher in France than it is
in the UK. 68 In addition to spending more on health, most
other countries in Europe are willing to put more health
warnings on food items that contain a lot of sugar (or
levy a sugar tax), or to have alcohol taxes that are higher
than ours. They also use tax revenues to pay for better
collective social security than is offered in the UK. 69
In contrast, UK government officials are now being
instructed (as the guidance quotation directly above
makes clear) to expect people’s health to deteriorate as a
39
Both a paperback version and high-resolution and fully interactive ebook versions
of this book are available to buy direct from the publisher at http://bit.ly/1oGOx9m
58.
A BETTER POLITICSresult of the ‘discretionary’ social security sanctions that
are being applied. This should itself cause us to realize that
there is something very wrong at the heart of our politics.
As an emeritus professor of law in Scotland explained in
October 2015: ‘Benefit sanctions, as they have developed
in the UK, are incompatible with justice.’70
The sanctions affect some groups receiving benefits
far more than others and so will cause illness, especially mental illness, to rise more among those groups.
Women with care responsibilities are disproportionately
sanctioned for not attending Job Centre appointments:
Women are being expected to meet near impossible
conditions in order to receive a basic benefit. When
those conditions aren’t met these women are sanctioned, often losing all of their benefits – sometimes
repeatedly – as the result of a system that doesn’t
take account of the specific circumstances of many
women’s lives.71
Almost all of these women are caring for children, who
also suffer.
Welfare should not be a weapon, and its withdrawal
should not be used as a form of punishment. You would
not punish people by withdrawing their access to healthcare, so why is it acceptable to punish them by withdrawing social security payments and, hence, access to food?
Why target women more than men, children more than
adults? Our welfare system is miserly in comparison with
40
This low-resolution PDF is licensed under a Creative Commons License and
may be passed on electronically for free. It must not be copied for sale.
59.
Basic needsthose in most other European countries, which results in
more premature mortality and illness in the UK, which
in turn spreads fear, mistrust and unhappiness into the
wider population.
It is very important to remember that the deaths of
others cause us the most unhappiness, when measured
across the population as a whole, closely followed by
the ill health of our loved ones. This is especially true
when it comes to the poor health of our parents, which
affects most of us much more than our own ill health
(which we adapt to). Most of us are fairly healthy, and
we are likely to live through the declining health of our
parents. Illness amongst our children, although more
rare, is especially hurtful. It is worth repeating that this
is particularly so for grandparents, who do not expect to
outlive their grandchildren. In contrast, achieving good
health and being well-treated results in significant rises
in happiness.
Watching those around us suffer as welfare benefits
are withdrawn harms us even if we are ourselves better
off. Watching our friends and neighbours being unable
to pay the rent, or seeing them become ill from worry
or from cold as they turn down the heating, hurts. Even
if we can pay our way, it hurts us to see others suffer.
So we try not to look. But as Professor John Middleton,
England’s longest serving director of public health,72
explained in November 2015: ‘Health professions deal
every day with the victims of welfare failure and a sick
41
Both a paperback version and high-resolution and fully interactive ebook versions
of this book are available to buy direct from the publisher at http://bit.ly/1oGOx9m
60.
A BETTER POLITICSfood system.’ 73 Food is at the base of Maslow’s hierarchy
of needs. Some community doctors in the UK now issue
vouchers from local food banks in addition to prescribing medicines.
We are not focusing enough on the issues that make
us most unhappy in this most unequal of affluent societies. Table 2 provides data on inequality and health
outcomes in some of the world’s most affluent nations.
The US is a stark outlier: the most unequal large rich
nation in the world has both a considerably higher rate
of infant mortality and lower overall life expectancy
than any other affluent nation. Data on mental ill health
is not included in the table because comparable data for
most of these countries is not available, and this lack of
information must surely limit the willingness of policymakers to tackle these illnesses. In the UK today, around
one in four people suffers from mental illness. Mental
health disorders must not be overlooked by health
policy, despite the difficulty of their measurement.74
Somewhat easier to measure is the huge gap in household incomes between the poorest tenth of households
and the richest.
In the UK the poorest tenth of households, even
after adjustment for household size, receive just 2.7% of
all income (after benefits are included and taxes taken
away). This is less than 10% as much as the best-off tenth
of households in the UK, who have recourse to 28% of all
disposable income. Among the twenty-five most affluent
42
This low-resolution PDF is licensed under a Creative Commons License and
may be passed on electronically for free. It must not be copied for sale.
61.
Basic needscountries in the world with a population of at least 2 million people, only in the US and Singapore do the best-off
10% take a higher proportion of total national income.
Greece, Spain and Italy now look as unequal as the UK
because of cuts to the living standards of the poorest
people under austerity. Contrast these countries with
Finland, Slovenia and Denmark to see the other political
possibilities and choices as to what level of inequality
to tolerate. In December 2015 the Finnish government
suggested it would pilot a basic living wage of £576 per
citizen per month for its resident population.75
More equitable affluent countries tend to have lower
infant mortality rates than those of more unequal countries. Table 2 makes clear that no other affluent country
in Europe has infant mortality rates as high as the UK’s.
Elsewhere in the rich world, only Canada, New Zealand
and the US match or exceed the UK rate. The picture is
much less clear when it comes to comparing life expectancy, which reflects many factors, influenced by what
has happened to a population over decades, including
immigration or emigration of those that are fitter and
healthier. Infant mortality and mental illness are more
highly correlated to inequality because they are influenced far more quickly in reaction to some immediate
change in circumstances.
The first column in table 2 shows income inequality
between the highest-income and lowest-income decile
groups of households, with the countries being ranked
43
Both a paperback version and high-resolution and fully interactive ebook versions
of this book are available to buy direct from the publisher at http://bit.ly/1oGOx9m
62.
A BETTER POLITICSTable 2. Income inequality in affluent nations, infany mortality, life expectancy
and income shares.
Country
United States
Singapore
Israel
Greece
Spain
Italy
United Kingdom
Portugal
South Korea
Japan
Australia
Canada
New Zealand
Ireland
France
Austria
Switzerland
Netherlands
Germany
Sweden
Norway
Belgium
Finland
Slovenia
Denmark
Infant
1st-to-10th mortality
rate
ratio
(per
(household
1000)
income)
18.75
17.63
15.06
12.55
11.62
11.23
10.37
9.96
9.95
8.84
8.71
8.64
8.29
7.44
7.44
6.97
6.63
6.59
6.53
6.26
6.24
5.78
5.51
5.41
5.20
7
3
4
4
4
4
5
4
4
3
4
5
6
4
4
4
4
4
4
3
3
4
3
3
4
Life expectancy
in years, in 1990,
2000 and 2013
(and overall
change)
1st decile
group
75, 77, 79 (+4)
75, 79, 83 (+8)
77, 79, 82 (+5)
77, 78, 81 (+4)
77, 79, 83 (+6)
77, 80, 83 (+6)
76, 78, 81 (+5)
74, 77, 81 (+5)
72, 76, 82 (+10)
79, 81, 84 (+5)
77, 80, 83 (+6)
77, 79, 82 (+5)
76, 79, 82 (+6)
75, 77, 82 (+7)
78, 79, 82 (+4)
76, 78, 81 (+5)
78, 80, 83 (+5)
77, 78, 81 (+4)
76, 78, 81 (+5)
78, 80, 82 (+4)
77, 79, 82 (+5)
76, 78, 80 (+4)
75, 78, 81 (+6)
74, 76, 80 (+6)
75, 77, 80 (+5)
1.60
1.64
1.70
2.00
2.10
2.20
2.70
2.60
2.20
2.91
2.80
2.80
3.10
3.40
3.20
3.10
3.50
3.40
3.60
3.50
3.30
3.60
3.90
3.70
4.00
Household income
share (%)
10th decile
group
30.00
28.97
25.60
25.10
24.40
24.70
28.00
25.90
21.90
25.71
24.40
24.20
25.70
25.30
23.80
21.60
23.20
22.40
23.50
21.90
20.60
20.80
21.50
20.00
20.80
Note: the 1st-to-10th ratio is the ratio of the mean (after tax) household income of the top decile group
in a population to that of the bottom decile group, adjusted to take account of household size. Infant
mortality is as reported by the World Bank (2015), and life expectancy is as reported by the World
Health Organisation (2015) for both men and women combined. Global Health Observatory data
repository, accessed November 2015 (http://bit.ly/1pcf4aB).
Source: N. Stotesbury and D. Dorling. 2015. Understanding income inequality and its implications: why
better statistics are needed. Statistics Views, 21 October. (See http://bit.ly/20BOEkd.)
by that ratio. For instance, in the UK the highest-income
tenth of households receive 10.37 times more income
than the lowest-income tenth: 28% compared with 2.7%.
In the US the highest-income tenth take 30%, compared
with 1.6% for the lowest-income decile. By 2013, the lowest life expectancy in the rich world (the 3rd column) was
in the US, with 79, but very equitable Denmark, Slovenia
44
This low-resolution PDF is licensed under a Creative Commons License and
may be passed on electronically for free. It must not be copied for sale.
63.
Basic needsand Belgium were only a year ahead (all at 80), the UK (at
81) was just a year ahead of them, just below Norway and
Sweden (at 82) and Switzerland, Australia, Italy, Spain
and Singapore (all at 83), with Japan heading the list at
84, five years ahead of the US. In the twenty-three years
to 2013, life expectancy in the US increased by only four
years. Some nineteen countries in the table did better,
five achieved the same increase, and none performed
any worse than the US. Part of the reason for this is
that infant mortality is often highest in those affluent
countries where the richest tenth take over a quarter of
all household income, as the richest are usually families
without very young children.
Human beings are intrinsically and primarily self-
regarding, just like other species. Self-regard is a neutral
concept, not a critical one. Like other species, humans
may adopt more collective behaviours if they have benefits for themselves and their kin. Often what benefits the
collective also benefits the individual. Of course, we are all
very different, with a wide range of sexualities and ethnicities, practising no religion or one of many possible ones.
In accepting others who are not similar to us, humans
have achieved a great deal of success, and many of these
successes are becoming more frequent over time; but by
accepting others as equal, we accept them as being like us
in another way, in the respect they deserve, in the chances
they should have, and in how they should be treated, not
least when they (and we) are ill.
45
Both a paperback version and high-resolution and fully interactive ebook versions
of this book are available to buy direct from the publisher at http://bit.ly/1oGOx9m
64.
A BETTER POLITICSA better politics of illness and health would be a
politics that did not tolerate government officials being
instructed to carry out acts that they knew would damage health.
We should ensure that our National Health Service
is in the future funded at the normal European level by
raising more tax.
We should introduce preventative taxation, such
as on sugar in foodstuffs. We should also look more
carefully at the underlying causes of poor health, and
at how accepting higher levels of poor health in the
overall population harms the long-term happiness of
us all.
Births
A better politics would not only concentrate on preventing harm – it would also promote happiness. Births are
greeted by substantial increases in happiness for the
new parents and grandparents, at least in the year that
46
This low-resolution PDF is licensed under a Creative Commons License and
may be passed on electronically for free. It must not be copied for sale.
65.
Basic needsfollows (this happiness ‘spike’ flattens out later as we
age and the pressure of parenting kicks in). But many
people who desperately wish to be parents are currently
prevented from getting help. Fertility treatment in the
UK is a postcode lottery. Although services are commissioned centrally in Wales, Scotland and Northern
Ireland, in England fertility treatment depends on where
you live and the current policy of your local Clinical Commissioning Group. Groups in poorer areas, with greater
demands on general health services, are more likely to
find that budget limitations oblige them to cut family
planning and fertility services, including services to prevent unwanted pregnancies and the spread of sexually
transmitted diseases.
Government policy in the UK now means that if any
family has a third or subsequent child after April 2017
they will receive no tax credits or any universal credit
benefits for those children. The Children’s Society,
a national children’s charity, explained that this was
another government measure targeted at the poorest
families: ‘The announcement to limit child tax credits
to two children is effectively a two child policy for
the poorest families.’ The government’s Secretary
of State for Work and Pensions, Iain Duncan Smith,
proposed in 2012 to cut the income of 584,000 poor
families with an adult in work. 76 The Chancellor, who
three years later introduced this measure in his 2015
budget, said that:
47
Both a paperback version and high-resolution and fully interactive ebook versions
of this book are available to buy direct from the publisher at http://bit.ly/1oGOx9m
66.
A BETTER POLITICSBritain is home to 1% of the world’s population; generates 4% of the world’s income; and yet pays out 7% of
the world’s welfare spending. It is not fair to the taxpayers paying for it. It needs to change.77
However, the Chancellor misled us when he implied that
these three proportions are comparable and that such a
comparison is meaningful.
Britain is home to only half of one per cent of the
world’s children, but that does not mean we are having
too few children. We have fewer children because we are
more affluent; we also spend more on welfare because
we are more affluent than the vast majority of other
countries. However, Britain has one of the lowest levels
of welfare spending in the rich world because its taxes
are very low. Rather than being unfair to taxpayers, the
current situation is unfair to most children, and to the
majority of adults. It benefits the richest, who avoid
paying the tax they would pay if they lived elsewhere in
Europe. For decades people in the UK and in every other
country in Europe have been having families that are,
on average, so small that our population would quickly
decline were it not for immigration. There is no need to
curtail the opportunity to become a parent in the UK
unless you hold strange eugenic ideas.
It is harder for people to become parents in Britain
today than at any time in the country’s history. The cost
of housing has accelerated since the economic crash,
helped in part by government policies, such as ‘Help to
48
This low-resolution PDF is licensed under a Creative Commons License and
may be passed on electronically for free. It must not be copied for sale.
67.
Basic needsBuy’, that were introduced in the immediate aftermath
of the crash.78 It is not just poorer potential parents who
cannot now afford children – it is the vast majority of
young adults. Most can no longer countenance becoming parents before their thirties.
Britain does not have a surplus of children. Since 2011
the mean age of first becoming a parent has risen each
year, accelerating to the point that by 2014 it had passed
thirty for women and was even older for men. The number of babies born each year began to fall more rapidly
after 2013 as a result.79 There is no longer anywhere in
Europe where fertility is at ‘replacement level’. 80 Every
country in Europe requires immigration to sustain its
population level, its economy, its public services and its
pension system. Policies to aid parenthood need not be
altered that significantly, but we should avoid polices
that make it harder for those who want to have children. Some 54,000 women are forced out of their jobs
each year in the UK as a result of becoming a parent. 81
Maternity pay and paternity leave have been improved
in recent years, but many people now work on shortterm or zero-hours contracts and so they do not benefit
from these provisions. The greatest rise in employment
is in self-employment, and there is no access to security
such as parental leave for most people for this rapidly
growing group of workers.
To feel able to have children, people need stability.
We need to not be forced to work every hour we can just
49
Both a paperback version and high-resolution and fully interactive ebook versions
of this book are available to buy direct from the publisher at http://bit.ly/1oGOx9m
68.
A BETTER POLITICSto get by – or, conversely, to feel under pressure to put a
career first and earn as much as possible before having
a child. We need to be able to imagine cutting down on
the amount of paid work we do for a few years when
a child is very small, and to have affordable childcare
nearby, but most of all we need to know that it is OK
to become a parent, and that it is not some selfish act
we should engage in only if we can afford it. None of us
would be here now if some of our forebears who ‘could
not afford it’ had not become parents despite the odds.
Every one of us has ancestors who were poor. And when
others around us have children, and take parental leave,
we need to recognize that they are not disadvantaging
us by doing so, just as we are not disadvantaged by having to collectively fund the education of their children.
To be able to become parents with less fear, young
adults also need to have truly affordable housing available in which they can start families. This is much more
important than access to childcare, as are stable jobs;
but an extension of affordable childcare is vital too,
starting before the age of five, when children begin
primary school.
Housing is discussed in more detail in the next chapter, but it matters in this context. If housing is made
cheaper, then having a family, among other things,
becomes easier. That rare thing, a secure tenancy,
should be obtainable by all, including would-be parents.
The government would simply need to change the law
50
This low-resolution PDF is licensed under a Creative Commons License and
may be passed on electronically for free. It must not be copied for sale.
69.
Basic needson assured short-hold tenancies so that any new ones
issued must be for at least three years, or five years if
a family has children. As the tenancies are currently
renewed each year, such a law change would not need
to be retrospective. Throughout the rest of Europe
housing is cheaper, the quality of housing is often higher,
rooms are larger, landlords make smaller profits, and the
highest-income tenth own a smaller proportion of the
housing stock (see table 2 above). 82
If employment is more secure and stable too, then
parenthood is also easier to countenance earlier. Employment can be made more secure by using legislation to
ensure that redundancy payments and out-of-work benefits are on a level similar to those in other countries in
Northwest Europe, not lower, as is the case today. That
reduces the chances of infertility, as people do not delay
pregnancy when they have more secure employment
earlier on, or when they fear the consequences of unemployment less. And both the human and financial costs
of attempts to overcome infertility, and the heartache it
causes, are then reduced.
Just a few decades from now, people without children may well be labelled as burdens on the state. Setting aside the use of such a charged term, taking care of
older people who do not have family support costs the
state more than supporting young families would now.
Having children saves money on mental health costs in
the long run. This is because people with kids are less
51
Both a paperback version and high-resolution and fully interactive ebook versions
of this book are available to buy direct from the publisher at http://bit.ly/1oGOx9m
70.
A BETTER POLITICSlonely and depressed. Beyond the workplace, a significant part of the social networks of many adults comes
through friendships with the parents of other children
in nurseries and schools, through shared celebrations
and shared caring. Children are among the most effective socializing agents for both younger adults and the
elderly.
How many people will there be a few decades from
now living in their old age, unhappy? Some will be those
who were so busy trying to keep up with the materialist
society we live in that they had little time for anything else.
How many will have put off, or have been forced to put
off, something that was nagging in the back of their mind
because most of their friends were also putting it off?
And then, one by one, many of their friends and siblings
found a way to become a parent while they did not. And
how many suffer in silence because ‘austerity’ means that
their local NHS literally decides it is too expensive to help
them to have a child. Children should not be consumer
commodities you cannot have if you cannot afford them.
Children are not a cost. They are a benefit. We should
appreciate life for the miracle that it is.
52
This low-resolution PDF is licensed under a Creative Commons License and
may be passed on electronically for free. It must not be copied for sale.
71.
Chapter 3Safety
Nowadays people know the price of everything and the
value of nothing.
— Oscar Wilde, The Picture of Dorian Gray
A
fter starting a new relationship and getting a new
job, the third most significant single event associated with higher than usual happiness in any given year
is securing a permanent home. Yet this is becoming
increasingly difficult for younger people. The average age
of a first-time buyer was only twenty-four in the 1960s
(see figure 1). By 2012 that had risen to thirty-five, with
people having to find an average deposit of £27,500. 83
Today these figures are higher still, and more and more
people will have to rent into their forties and fifties. This
is true even for those who have been to university and
secured a good job. Most new renting involves private
short-term tenancies. Today’s younger generation are
much less likely to have the security of accommodation
their parents had.
Both a paperback version and high-resolution and fully interactive ebook versions
of this book are available to buy direct from the publisher at http://bit.ly/1oGOx9m
72.
A BETTER POLITICSFigure 1 uses information from the British Social Attitudes Survey to show the proportion of people by age
that had a mortgage or owned their home outright each
year in Britain from 1983 to 2012. Time is depicted along the
x-axis of the figure, with the y-axis being age. The figure
is a simplified version of a much more complicated graph
that was first published in the Telegraph newspaper.84
In the distant past older people generally did not
buy their home. Even as recently as 1983, a majority
of those aged over fifty were renting from the local
council or from the remnants of the old private rented
sector. Several generations – those who grew up from
the 1930s through to the 1980s – saw the quality of the
housing they lived in improve. Now, council house building has ceased and the public rented housing stock has
diminished as a result of the ‘right to buy’ policy. Today,
quality improves only for a minority, while others live in
increasingly overcrowded properties that are not well
maintained. The worst maintenance is that by private
landlords, as routinely revealed by the government’s
own annual survey of housing.
The mortgage market grew in the 1980s, but a new
private rented market for students and young professionals also began to expand. By the 1990s there were
fewer older people renting, and by the 2000s fewer still.
People who had taken out mortgages in the 1980s were
beginning to pay them off, but younger people were
increasingly unable to get mortgages and the private
54
This low-resolution PDF is licensed under a Creative Commons License and
may be passed on electronically for free. It must not be copied for sale.
73.
SafetyYear
‘83 1985
1990
1995
2000
20
2005
2010 ‘12
Usually less
than 50%
30
Usually
between 50%
and 70%
40
50%
50
Age
Usually higher
than 70%
60
70%
70
80
Usually less
than 50%
Usually
between 50%
and 70%
70%
90
50%
Figure 1. People with a mortgage or who own outright in the UK by age,
1983–2012 (percentage within a single year of age and year group).
(Note that data are missing for 1988 and 1992; the trends have been
interpolated over those two years.)
Source: analysis by the author of the British Social Attitudes Surveys.
rented sector expanded further. Then, with the crash in
2008, the mortgage market dried up for first-time buyers
but boomed for buy-to-let landlords. Most people aged
55
Both a paperback version and high-resolution and fully interactive ebook versions
of this book are available to buy direct from the publisher at http://bit.ly/1oGOx9m
74.
A BETTER POLITICSbetween twenty-five and fifty were renting again, but
now mostly from private landlords.
By the early 1990s, buying a home became associated
with an increase in happiness that is more than seven
times the happiness boost linked with simply moving
home. This is perhaps related to the fourth and fifth most
significant events associated with greater happiness:
becoming pregnant or your child becoming pregnant
(discussed at the end of chapter 2). The arrival of a newborn often necessitates moving to a bigger property, or
at least it did in the past.
So why are fewer people able to afford the security
of their own homes? Why are so many finding rent so
hard to pay that they know they have no hope of saving
for a deposit? The inability to save, rapidly rising prices
in many areas, higher profit-taking by British banks than
European banks, and lower median wages in the UK all
contribute to preventing people who would like to buy
from doing so. It is ‘investors’ and landlords who are
increasing their share of property ownership. We are
using our existing housing stock less and less efficiently
compared with more equitable European countries. 85
In the UK council tax benefit has been cut, while
rent, gas and electricity costs have gone up. The result
of this is that many British households (as many as a
quarter) can no longer pay for rent, fuel and food while
also saving at least £10 a month. These changes affect
poorer households with children the most because,
56
This low-resolution PDF is licensed under a Creative Commons License and
may be passed on electronically for free. It must not be copied for sale.
75.
Safetyrelative to wealthier households, expenditure on these
necessities comprises a larger percentage of their overall consumption.
People will go without food, and will then go without
heat for their homes, before they fail to pay the rent.
Yet in London the number of families issued with a court
summons for not paying their rent doubled from 7,283 in
2013–14 to 15,509 in 2014–15. 86 There was a 50% increase
in the use of bailiffs to evict households over that same
period. When you are evicted, you also face £125 in court
costs and £400 in bailiff’s fees – in the UK you pay for
your own eviction.
Over half a million children in London are now living in
poverty. Half of those children are housed in the private
rented sector, and that number has doubled in a matter
of just a few years. When the families of those children
are evicted for not paying their rent, or move on because
they can no longer pay their rent as it rises, those children often have to move to another school, losing their
friends and having to make new ones. Children in poverty and in private rented accommodation move, on
average, more than once every three years. 87
We cannot be happy if we do not feel safe and secure
in our homes. The government has a responsibility
towards the quality and quantity of housing available
and it must introduce the security and quality in socially
and privately rented housing that we currently lack
compared with nearby countries. The government must
57
Both a paperback version and high-resolution and fully interactive ebook versions
of this book are available to buy direct from the publisher at http://bit.ly/1oGOx9m
76.
A BETTER POLITICSget involved in rent regulation, and control the buying
of properties by buy-to-let landlords. It must intervene
in the housing market to halt the ongoing escalation
of house prices. One way it could do this is by adopting
Kate Barker’s suggestion that capital gains tax is paid on
all properties. 88
Rents
Young professionals also now suffer from having to pay
high rents to private landlords. This is causing increased
angst even for them, despite this group being reasonably well off, with higher and more reliable incomes than
others of their age, with supposedly bright prospects
and usually no dependants. This phenomenon is best
58
This low-resolution PDF is licensed under a Creative Commons License and
may be passed on electronically for free. It must not be copied for sale.
77.
Safetyknown in London, but it is also becoming prevalent in
a number of other affluent cities in some of the most
unequal countries of the rich world, although generally not elsewhere in Europe. London is now the most
expensive very large city to live in in the world. To find a
comparable situation to London, but in a smaller affluent
city, you have to travel to San Francisco.
By 2015, in any neighbourhood of San Francisco, it
had become impossible for a single teacher to pay the
median rent on a one-bedroom apartment; the average
rent in the very poorest neighbourhood there rose to
$3,500 a month. Californian teachers’ starting annual
salaries were $50,000. After paying taxes and buying
food, any teacher without recourse to wealth would
inevitably find themselves in debt. 89 However, travel a
third of the way round the world in the opposite direction and you come to Tokyo, where rents have fallen
by over 15% in the last ten years as landlord greed is
better controlled. 90 In contrast, in the UK, rents in the
city of Oxford, for example, are rising rapidly and will
soon exceed £1,000 a month for a one-bedroom apartment. This will leave rent consuming a large majority
of a newly qualified teacher’s income of £22,000 a year.
Indeed, it leaves very little after taxes are deducted
and clothes and food are paid for. 91 Few newly qualified
teachers stay long in the city, meaning that a very large
proportion of teachers in Oxford’s schools are young
and inexperienced.
59
Both a paperback version and high-resolution and fully interactive ebook versions
of this book are available to buy direct from the publisher at http://bit.ly/1oGOx9m
78.
A BETTER POLITICSAverage UK private rental prices went above £1,000 a
month during the early autumn of 2015. One-bedroom flats
in London had already passed that price level in August 2015.
Nationally, in 2015 rents were rising by 4.6% a year, but by
20% a year in London boroughs like Islington.92 Part of the
reason for this is landlord greed, and part of it, according
to the bank UBS, is because by 2015 ‘London house prices
[became the] most overvalued in the world’.93
Rising rents are ‘socially cleansing’ poorer people from
the more expensive parts of the UK. In many London
boroughs a third of poor families have had to leave their
homes, their boroughs or possibly London entirely since
2010. In most cases it was the cut to housing benefit that
forced them to leave. For others living across Southeast
England and in other expensive areas, when households
were hit by redundancy or illness or divorce, high housing
costs then mattered for people who had thought they
were immune. This was compounded by the introduction
of the ‘benefits cap’, which mostly affects households
with children, especially disabled children, and the unrelenting annual above-inflation rises in rents.
Jeremy Corbyn, the leader of the Labour Party, represents Islington North, an area of London with one of
the highest rates of poverty in Europe. He puts it bluntly:
Frankly we’re being socially cleansed. The rent goes
up, the benefit cap doesn’t meet the rent. That means
[people are] either forced to go hungry or move away
from their families and the lives they’ve built. 94
60
This low-resolution PDF is licensed under a Creative Commons License and
may be passed on electronically for free. It must not be copied for sale.
79.
SafetyIt is possible to stop this. In Scotland, Nicola Sturgeon,
the leader of the Scottish National Party, has promised
to introduce local rent regulations for the private sector
in ‘high-pressure areas’. She has the power to do so. The
old argument that rent regulation would reduce the
supply and quality of rented housing appears flawed.
The quality of much UK private rented accommodation
is awful by normal European standards, including Eastern European standards, and the price is simply too
high. 95 Making sure that minimal standards are enforced
would at first most help those currently living in damp,
rodent-infested, poorly insulated, dilapidated accommodation in the UK. This would save money for the NHS as
well. Berlin has had successful rent regulation for years,
and it has far higher quality housing as a result. The
regulations were recently tightened up in Berlin to stem
housing-cost inflation.
Social (and later private) housing rents should be
subject to regulation, to ensure that they are not
more than 30% of disposable income. Tenants such as
students who might wish to leave their tenancy early
could do so, but landlords could not insist that they
do. If the quality of accommodation is substandard,
tenants should have the right to improve it, deduct
the cost from their rent, and extend their tenancies
by more years in proportion to how much they had to
spend. That would give the landlord an incentive to
improve standards. Private renting needs to be made
61
Both a paperback version and high-resolution and fully interactive ebook versions
of this book are available to buy direct from the publisher at http://bit.ly/1oGOx9m
80.
A BETTER POLITICSa reputable housing sector so that good pension companies can invest in it.
Improving tenants’ terms and conditions would
result in a fall in the value of property, overall, as landlords would get a lower yield from their investment.
More housing still needs to be built, but in recent years
the private sector has failed to deliver. Local authorities
need to coordinate additional housebuilding, including
planning transport links and other infrastructure. Their
involvement would curtail the profits made by the current oligopoly of a few large housebuilders. The state
could encourage small housebuilding projects. The private housing market is failing.
Savings
For several years the Office for National Statistics (ONS)
has been monitoring both the wealth and well-being of
62
This low-resolution PDF is licensed under a Creative Commons License and
may be passed on electronically for free. It must not be copied for sale.
81.
SafetyUK citizens. In early autumn 2015 it first published results
on the effect of savings on well-being. What the ONS
found was startling. It is not income that matters most
to us, but having some savings:
An individual’s level of personal well-being is strongly
related to the level of wealth of the household in which
they live. Life satisfaction, sense of worth and happiness are higher, and anxiety less, as the level of household wealth increases. The levels of household income
are less strongly related, with relationships found only
with life satisfaction and sense of worth. 96
In other words, people feel safer if they have savings
they can fall back on. If wealth were more evenly distributed, far more of us could have savings and a few would
not have such great fortunes. One person’s personal
income, through receiving an income from unprotected
tenants, results in a reduction in the tenants’ safety. Protect the tenants and regulate their rent and they gain a
lot. The landlord loses only a little profit; total net safety
increases.
In the five years from 2010, an additional 207,000
people in the UK became paper millionaires, mostly
because the value of their property had risen. 97 They
didn’t suddenly become wealthy, because in almost
all cases their wealth had been just a little short of a
million pounds a few years earlier. It represented a 41%
increase in millionaires in the UK in that period, and
63
Both a paperback version and high-resolution and fully interactive ebook versions
of this book are available to buy direct from the publisher at http://bit.ly/1oGOx9m
82.
A BETTER POLITICSyet most simply had a property that was (in theory)
worth some more, but that they still needed to live
in. In the ONS survey, high levels of property wealth
and private pension wealth were not found to be
related to higher levels of personal well-being. It was
smaller amounts of liquid wealth that correlated most
strongly with higher personal well-being – savings
for a rainy day. However, a quarter of households can
currently save nothing at all, and another quarter can
save almost nothing. Only those at the very top of the
wealth parade can save a lot, and saving a lot does
not make you feel much more secure than saving a
modest amount.
One in every sixty-five people in the UK is now a
paper millionaire, 98 but few feel they have money to
burn. Above them in the wealth parade are those
receiving some £42 billion in bonuses in their pay in
just one year. Most of these people work in financial
services, but most bankers receiving a bonus feel their
bonus is small in relation to those of a few of their
colleagues. And even those colleagues feel (literally)
poor compared with the wealthiest 1,000 families in
the UK, who have doubled their wealth holdings in the
five years since 2010. Self-perceptions of wealth are all
relative.
The UK is now home to the world’s third-largest
concentration of people whose wealth is worth over
64
This low-resolution PDF is licensed under a Creative Commons License and
may be passed on electronically for free. It must not be copied for sale.
83.
Safety$50 million: so-called ultra high net worth individuals.
Britain ranks just below much more populous China and
the US. Worldwide inequity has risen again in recent
years, faster than had been expected. As the chief
executive of Oxfam put it: ‘Are we really happy to live
in a world where the top 1% own half the wealth and the
poorest half own just 1%?’ 99 The global realignment of
wealth away from Europe and the US will take decades.
In the meantime, we need to be concerned with the next
few years.
The US provides a model of what the UK may become
if the rise in wealth inequalities is not curtailed. More
65
Both a paperback version and high-resolution and fully interactive ebook versions
of this book are available to buy direct from the publisher at http://bit.ly/1oGOx9m
84.
A BETTER POLITICSthan 3 million American households have a net wealth
of between one and two million dollars, and at least a
further 3 million have more than two million dollars each
in assets.100 In 2015 the 400 richest US families owned,
in total, more wealth than 36 million median-wealth
families did, combined.101 Each held the same wealth as
90,000 average US families. Even the middle 20% of US
households, including the median, had wealth averaging
only $12,200 per household. The top 20% held more than
all the rest combined.102
Annual wealth taxation is needed because the alternative is that a small group becomes ever wealthier to
the detriment of the rest. Progressive annual property
taxation would achieve a great deal, as could a simple
flat tax on the value of all property owned, but even
that would not be as effective as a more progressive tax
based on total land value and property value. Council
tax is a regressive tax that only applies to some property
and not to land.
Saving small amounts should be encouraged and
property speculation should be discouraged. Everyone
needs some savings for a rainy day in order to feel
secure. The Child Trust Fund was one government policy
that tried to encourage this. It has now been cut, but it
has reduced some wealth inequalities. Less inequality
results in more security for all. Taxing the rich more
could pay for that security, including the restoration of
the Child Trust Fund.
66
This low-resolution PDF is licensed under a Creative Commons License and
may be passed on electronically for free. It must not be copied for sale.
85.
SafetyEviction
Safety matters. The implications of not being safe can
be terrifying and harmful to our health. In just twelve
months to June 2015, 43,000 households were evicted in
England and Wales: the highest number ever recorded
and 50% higher than the rate at the depth of the economic recession. According to the Financial Times, ‘the
situation is likely to deteriorate as a result of Chancellor
George Osborne’s plan to reduce the overall benefits
cap’.103 Is it any wonder that people’s well-being is so
influenced by some savings? You are not safe if you are
poor, or of modest (or even average or mildly affluent)
means in the UK today. The rich fear joining the mildly
67
Both a paperback version and high-resolution and fully interactive ebook versions
of this book are available to buy direct from the publisher at http://bit.ly/1oGOx9m
86.
A BETTER POLITICSaffluent and getting on that downward slope; they will
try hard to avoid any fall in their wealth. The current
extent of the fear is extreme, because the gaps are now
so wide.
Housing is in short supply because it is now being
used in ways that are more inefficient than at any time
since records of our use of housing began in 1911. A
higher proportion of homes are empty and more rooms
in them are underused than ever before. Becky Tunstall,
professor of housing policy at the University of York,
has demonstrated this using data from every census up
to 2011.104 We know we did not have a large number of
empty or underused homes before 1911. Almost all of
this spare capacity is in the private sector, and mostly
it is found among those who own outright, largely due
to older homeowners holding on to large properties for
the rising asset value, possibly hoping to pass that on
to their children when they die. At the same time, and
partly because of the increases in property hoarding
that Professor Tunstall uncovered, homelessness and
overcrowding are also rising.
We need to build more homes, because we currently have too few, and our population is rising due to
immigration. However, the five largest building firms in
the UK have a disproportionately large stake in overall
housing construction. These five firms secured that
advantageous position in recent years by taking over
their smaller competitors, who suffered the most in the
68
This low-resolution PDF is licensed under a Creative Commons License and
may be passed on electronically for free. It must not be copied for sale.
87.
Safetyhousing crash of 2008.105 The situation we find ourselves
in is very unusual and calls for new routes out of the
crisis. The market has not, cannot and will not deliver
enough homes to the people in most need.
The quickest way to relieve the housing crisis and
reduce evictions would be to introduce policies that
encourage people living alone in properties with many
more rooms than they use to think sooner about downsizing and to discourage people from buying second
homes as an investment. Very large properties could
be subdivided into flats in future. This happened before
when economic inequalities fell. Incidentally, the former
chairman of the National Trust, Simon Jenkins, agrees
that we are not using our existing housing well enough.
But we will eventually have to build more.106
We will also have to build more housing because
our population is rising. We have to build retirement
apartments (with lifts) attractive enough for people to
downsize to, not ghettos for the elderly. We have to
build homes in and near cities, where people will not
need cars to be able to live good lives. And we have to
ensure that the value of housing begins to fall towards
normal European levels so that there is a disincentive to
hoard housing.
The purchase of housing as an investment should
be made unaffordable by increasing taxation on empty
homes and ensuring that capital gains tax applies to all
property.
69
Both a paperback version and high-resolution and fully interactive ebook versions
of this book are available to buy direct from the publisher at http://bit.ly/1oGOx9m
88.
A BETTER POLITICSAlready in the UK a lot of effort goes into ‘prevent[ing]
the eviction and repossession of vulnerable borrowers
who have defaulted on their housing loan’.107 But, in contrast, in Sweden the risk of getting into that situation
in the first place is minimized by the state. In Germany
people are far freer to choose between renting and
buying than they are in the UK; buying in Germany has
benefits but is no great investment. In the Netherlands
tenancies are better controlled, so the quality of rented
housing is higher and the price is lower. In France rented
homes are much more spacious, on average, than in the
UK. In the US property taxes are fairer. The Japanese are
decades ahead of the British in terms of planning housing to fit in with public transport, so car use there has
been falling for many years.
Housing in the UK needs to be for homes, not for
investment. And we need to look abroad to see how
to make this the case. We need to look at how housing policy in other countries has contributed to better
mental health in those countries. We need to ask why
we allow a tiny proportion of people to profit so much
from charging such high rents and demanding such high
prices for homes? Having so many people living in tenures that are so insecure does not promote well-being in
a population. It spreads mistrust.
70
This low-resolution PDF is licensed under a Creative Commons License and
may be passed on electronically for free. It must not be copied for sale.
89.
Chapter 4Love
If there is one word that encapsulates the new sense of
connection between people that seems to be emerging
it is ‘humanity’. The common outrage is overwhelmingly
directed at its opposite – inhumanity.
— Ursula Huws108
W
hat do people want above all else? For most people
the answer is simple: other people. People to love
them, occasionally hug them, always respect them and
care for them, and for them to care for in return. People do not want policies that focus on maximizing profit
or wealth. This is so overwhelmingly apparent that it is
staggering to be told that we should consign our most
important relationships to the ‘private sphere’. In an age
when all can be fed, kept warm and sheltered, it is shocking that we cannot supply these basics adequately to all
– because of a policy focus on wealth maximization.
People have greatly valued their relationships, and
feared being ostracized, since long before the words
‘economic’ and ‘growth’ had any meaning. However,
Both a paperback version and high-resolution and fully interactive ebook versions
of this book are available to buy direct from the publisher at http://bit.ly/1oGOx9m
90.
A BETTER POLITICSit takes a strangely economistic way of measuring the
world to determine this anew. This kind of strange
measurement is what Dimitris Ballas and I did when we
estimated what best predicted happiness (or its lack) in
the model that is the evidence base for this book. Our
relationships with each other are what matter most to
us, but for those who like to see these things set out in
numbers, here they are.
If your main relationship has ended during the past
year, that will have had the highest detrimental effect on
your happiness of any possible single event (this is shown
in the table in chapter 2 by the single biggest negative
coefficient, –0.178). The cause is usually separation or
divorce. Fortunately, because separation is relatively rare,
it is only the sixth most detrimental event by prevalence:
that is, its impact multiplied by its likelihood. It is not so
much that marriage is good for us – although getting married is – it is that splitting up is so very bad for us.
Other relationships matter too, especially with pets
– which are much more important than we tend to give
them credit for. Something that negatively affects a pet
is the fifteenth most detrimental event overall, or seventeenth by prevalence. Pets tend to leave our social circle a
little more often than long-term human partners, mostly
because cats and dogs have short life expectancies.
Relationships with the rest of your family (pets aside)
are frequently mentioned, but often for making people
less ‘reasonably’ happy than usual, such as after a family
72
This low-resolution PDF is licensed under a Creative Commons License and
may be passed on electronically for free. It must not be copied for sale.
91.
Loveevent. When you last met up with your family did you all
sing round the piano? Or did you drink and eat too much
and try to avoid an argument? But what is key to understanding ourselves is that our relationships with others
figure as more important than anything else in our lives.
Family
Our greatest joy is associated with successfully starting
a new relationship. This is true whether it is measured in
terms of just the individual effect or in terms of the prevalence, and thus the aggregate impact; such is the joy of
finding someone special. Hopefully, at least two people
are made happier when this happens. Usually, of course,
more people share in the happiness as well. Wider family
73
Both a paperback version and high-resolution and fully interactive ebook versions
of this book are available to buy direct from the publisher at http://bit.ly/1oGOx9m
92.
A BETTER POLITICSand friends tend to approve, on average, of a new relationship beginning among their acquaintances.
The joy associated with starting a new relationship
worthy of reporting at the end of a survey is, on balance, so
great that people’s reporting of their children finding love is
a significant and positive event in their own lives, although
it is four times less important to them in securing greater
happiness as is finding someone for themselves: 4.32 times
(0.160 divided by 0.037) according to the table in chapter 2.
Statistics can be used to dull the most romantic of truths!
Making, keeping and not breaking relationships is
more important than anything else to us humans. We
are wired to worry about each other, to care for each
other and to need to be cared for. Some suspect that the
minority who are less attuned to the social are the ones
who try hardest to argue that money is more important
today.109 As far as we can tell, from a long series of small
studies, people with a huge amount of money are no
better at maintaining happy relationships than people
who have less, and they are possibly worse at it.110
If you accept that relationships are so important, what
would you then want of a government, and of each other?
Not seeing our relationships end prematurely through ill
health turns out to be the most important need. But we
have covered death and illness above. What we need is
an understanding about how other government policies
can help us stay together when we want to do so. Government can also make that harder in all kinds of ways.
74
This low-resolution PDF is licensed under a Creative Commons License and
may be passed on electronically for free. It must not be copied for sale.
93.
LoveIt is easy to list all the things that governments do to
separate people from their loved ones. An obvious one is
to imprison them. The punishment of prison is the punishment of separation, and this is discussed in the next
section. Governments can make it harder for people
to stay housed, to keep to one job, to start a family, to
avoid long commutes, to avoid having to move home frequently, and harder to avoid working excessive hours. In
all these ways governments make it easier for us not to
meet people, and more likely that we will split up.
Out of thirty-four countries with comparable data, the
UK has the fourth highest annual divorce rate. Only in the
US, Puerto Rico and Russia is divorce more common.111
Countries where fewer people get married in the first place
or where divorce is more difficult to obtain have lower rates,
but even taking this into account the UK rate is remarkably
high. Of course many couples in the UK never marry, but
cohabiting relationships are no more secure than marriages.
And we do know that the number of children brought up
by one parent in the UK is high by international standards.
Furthermore, the strain of poverty, inequality and poor
housing makes sustaining relationships more difficult, and
can help trigger domestic violence; and then, in turn, the
children who witness domestic violence are more likely to
commit crime and end up in prison later in life. At least 40% of
those convicted of a crime and imprisoned have witnessed
domestic violence at some point during their childhood.112
All social issues are interlinked.
75
Both a paperback version and high-resolution and fully interactive ebook versions
of this book are available to buy direct from the publisher at http://bit.ly/1oGOx9m
94.
A BETTER POLITICSPeople need space and time for relationships. Opportunities to interact are curtailed because our leisure time and
social interactions are cut when our working and commuting hours rise. Government can help ensure we have more
leisure time. Policies such as six-hour days or more choice in
general over when and whether to work (discussed later in
this book) have implications for the health of our relationships. People need more time and space to both start and
sustain a relationship, but also to be free to end it when it
really has failed. Politics can help in all of this, as it did in the
past when divorce laws were liberalized and, more recently,
when same-sex marriage was legalized.
Prisons
The ultimate sanction government has, in a country
without the death penalty, is to imprison people, breaking their relationships with others.
76
This low-resolution PDF is licensed under a Creative Commons License and
may be passed on electronically for free. It must not be copied for sale.
95.
LovePrisons used to be small private affairs, locally
rganized, few and far between. Then they grew greatly
o
in number and size during the Victorian period, with
industrialization and urbanization. In the UK we i mprison
more people per capita than any other country in Europe.
Women are disproportionately more likely than men to
be imprisoned for non-violent offences, but men are far
more likely to be in prison than women, e
specially men
who grow up in poverty. As Michael Gove, the government’s Secretary of State for Justice, put it in October
2015:
Prisons were the ‘biggest failure’ in the criminal justice process. They failed to rehabilitate those caught
behind their walls, and created a perpetual revolving
door of release and reconviction.113
Around 7% of all children in the UK have had a parent
imprisoned while they were growing up. This is not a
small proportion and reflects just how many adults are
incarcerated. It is the same proportion of the UK’s children enrolled in private schools,114 which is also very high
for a European country. Very few children in most of the
rest of Europe either attend a private school or have had
a parent who has been imprisoned. The UK is the most
divided of European societies.
We have so many prisons in the UK not because
we are inherently particularly vindictive but because
social relationships and safety nets have broken down
77
Both a paperback version and high-resolution and fully interactive ebook versions
of this book are available to buy direct from the publisher at http://bit.ly/1oGOx9m
96.
A BETTER POLITICSover recent decades, and there is now much more fear
of crime.115 However, the most recent increase in the
prison population in the UK has occurred with very
little evidence of an overall increase in crime. Our
judicial system may be becoming more vindictive.116
Despite little overall rise in crime there has been an
18% increase in (mostly racist) hate crimes in the UK,
rising from 44,471 recorded in 2013–14 to 52,528 in
2014–15.117
Fear is constantly used to defend both our rates of
imprisonment and many more laudable but only palliative
interventions.118 In the summer of 2015 officials working
for Kids Company, the now-defunct charity, claimed that
without their charity workers, London would descend
into savagery, arson and riot.119 It was fear of yet more
riots that led magistrates to impose such long prison
sentences on people convicted of very minor offences
during the 2011 riots in London and elsewhere. An
unhappy, unequal, segregated and dysfunctional society
is also a society that has more rioting, insurrection and
theft.120
Prisons are the extreme example of the many ways
in which current government policies harm our relationships with each other, and we already have more prison
cells per head than any other country in Europe.121 Despite the Secretary of State for Justice’s recent lament
about prison not working, the current government is
78
This low-resolution PDF is licensed under a Creative Commons License and
may be passed on electronically for free. It must not be copied for sale.
97.
Loveplanning a new large-scale, profit-making, private-sector-led prison-building programme. Criminologists, and
former chief constables, explain:
At their very centre, prisons are unhealthy and damaging places for both prisoners and prison officers.…
If we need fewer police and more social workers then
government should plan for that. Such an approach
could lead to a radical downsizing of the prison estate
with the closure of old prisons and no need to build
replacements.122
The government should stop relying on charities
to rehabilitate prisoners. The UK should have a policy
target to reduce prisoner numbers each year, as part of
the politics of kindness.123 We need to realize that some
government policies actively break up the relationships
that matter most to people. Most people see mass
imprisonment as necessary to maintain law and order,
but the long-term effect is more lawlessness and less
order.
The 7% of our children who leave school with a
parent having been imprisoned need far more of our
resources than the children of the most affluent who
are educated away from the rest of society and at such
great expense. We need to create a society that separates us from each other far less than the one we now
live in.
79
Both a paperback version and high-resolution and fully interactive ebook versions
of this book are available to buy direct from the publisher at http://bit.ly/1oGOx9m
98.
A BETTER POLITICSAnxiety
When we feel less valued, less loved and less secure, we
become more anxious. Between 1993 and 2007 the number of people experiencing an anxiety-related mental
health disorder in the UK rose by more than an eighth.
An extra 800,000 people a year were diagnosed as suffering from an anxiety disorder in 2007 compared with
1993. At the extreme, over 6,000 people a year commit
suicide (see chapter 2). Suicide is the leading single cause
of death among men in the UK between the ages of
twenty-five and forty-nine. And since these figures were
collected – since the economic crash – the situation has
become worse.124 But suicide is just the tip of an iceberg
of anxiety.
How do people in the UK deal with anxiety? We
have 50,000 family doctors to help us – but at the same
80
This low-resolution PDF is licensed under a Creative Commons License and
may be passed on electronically for free. It must not be copied for sale.
99.
Lovetime we have 280,000 professionally qualified accountants.125 This is possibly the highest per capita number of
accountants on the planet. Do we really need to train so
many of them and have so few young people training in
medicine, in nursing, in teaching or in social work?
In the UK, as Prem Sikka, professor of accounting at
the University of Essex explains:
If anything, accounting firms have undermined na
tional tax revenues and used their expertise to excel
at money laundering, bribery, corruption and other
antisocial practices.126
Why do we encourage so many of our apparently most
talented young adults to go into careers in the financial
services and consulting industries? Commentators often
retort that if we took the City of London out of the UK
economy, this would have a massive negative effect on
Britain’s ability to pay for social services and the NHS.
However, other Western European countries, which are
less reliant on their financiers for their tax base, fund
their health services and social services better than we
do in the UK.
Perhaps accountancy makes some people happy.
As Mary Poppins sings sarcastically in ‘A British Bank’:
‘When gazing at a graph that shows the profits up, their
little cup of joy should overflow!’ 127
Countries that are very economically unequal end
up with fewer carers and more bean-counters. As trust
81
Both a paperback version and high-resolution and fully interactive ebook versions
of this book are available to buy direct from the publisher at http://bit.ly/1oGOx9m
100.
A BETTER POLITICSreduces, we begin to employ more and more people
to audit others. The US has more lawyers per head
than any other country, and those lawyers are most
frequently found in the most unequal cities in the country, such as Miami and New Orleans.128 An untrusting
country has more crime and uses more lawyers in its
everyday business, and routinely in the media, for fear
of counter-litigation. Bosses in Britain ‘seek a legal opinion’ about their actions, and pay a lawyer, more often
than in other European countries. Evidence is currently
being amassed that suggests that it might well be a lack
of moral values among our elite that is one of the key
reasons why we have so many lawyers. The evidence collection tends to concentrate on why the US is so unusual
in this regard, but it often includes the UK as a similar
example.129
It is not just accountants, bankers and lawyers that
are growing in number. In recent decades there have
also been huge increases in the number of security
guards being employed. We have more doorkeepers
and private patrols because we now think we have
to ensure our own and our property’s safety more,
because we have become more anxious. And the more
economically divided we become, the more anxious we
get and the less we trust others. In some parts of very
affluent central London, the 2011 census revealed that
the most prevalent occupation was being employed in
security as a doorman and housed in dormitories nearby
82
This low-resolution PDF is licensed under a Creative Commons License and
may be passed on electronically for free. It must not be copied for sale.
101.
Loveor in accommodation on the premises. People who lived
locally were living in properties not as tenants but as
‘guardians’, protecting the property by being there, but
having no legal right as tenants.130 We know where the
fear is most concentrated. So where is the love?
Levels of anxiety in the UK are high, and trust is low,
as economist Avner Offer and epidemiologists Kate
Pickett and Richard Wilkinson have explained to widespread acclaim. As a result, far more people in the UK
are employed to look after the security of property and
of financial assets than in all other affluent countries,
aside from the US. Yet with fewer doctors available to
the public, and numbers of nurses being low, to achieve
minimal levels of cover, more nurses and doctors are
now having to be employed on a temporary basis than
ever before.131
We are consuming more and more antidepressants.
We are seeing levels of anxiety rising in our younger
people, especially among girls around the age of fifteen.
People are more concerned about the future: about
their own futures, about the future of their children,
and then, when they think more widely than that, about
what will happen to their neighbourhoods, cities and
societies if we carry on with the politics we have.132 Looking further afield, their worries become international:
about immigration, about climate change, terrorism and
the rising international gulf between the mega-rich and
the mostly-poor.133 We need to wean ourselves off our
83
Both a paperback version and high-resolution and fully interactive ebook versions
of this book are available to buy direct from the publisher at http://bit.ly/1oGOx9m
102.
A BETTER POLITICSexcessive preoccupation with finance; we should pay
more attention to measuring ‘happiness preservation’
than to maximizing wealth. Higher government (collective) aspirations would have far-reaching implications,
including for our well-being and for the security of our
relationships.
84
This low-resolution PDF is licensed under a Creative Commons License and
may be passed on electronically for free. It must not be copied for sale.
103.
Chapter 5Esteem
We’re seeing the spontaneous rise of collaborative production: goods, services and organisations are appearing that no longer respond to the dictates of the market
and the managerial hierarchy.
— Paul Mason134
T
he second most important aspect of our lives in
terms of making us happy is work. Here, our happiness rises not so much as a result of how much we are
paid, but rather from whether we have a job at all and
how secure it is.
Being paid well is very important. We show how
much we disrespect people when we pay them a minimum wage rather than, at the very least, a living wage.
However, just having a job is the most important thing
when it comes to happiness and employment; then –
after securing employment – being respected at work
matters. Being shown that you are valued is important, but this finding also shows how much the formal
labour market has come to dominate our thinking.
Both a paperback version and high-resolution and fully interactive ebook versions
of this book are available to buy direct from the publisher at http://bit.ly/1oGOx9m
104.
A BETTER POLITICSRoles that are not formally remunerated have come
to count for less.
To various degrees the work of rearing babies, caring
for children and most work involved in looking after the
ill, the less able and the old has been ignored for a very
long time. Household work, care within families and child
rearing have been ‘invisible’ to economists for generation
after generation, even though the people who do this
work are among the biggest contributors to the economy.
Such work makes it possible for others to take paid work.
If people were to stop doing it, our economies would collapse under the pressure. If we all tried to pay one another
(in a market) to do each other’s housework, healthcare,
old-age care and childcare, we would run out of money to
do so, because the transaction costs would be too high.
Some also argue that if states were brave and visionary,
they would consider paying a wage and, later on, pensions
to people who do these jobs on behalf of their families.
This might be one way in which basic income could be
introduced; but more on basic income shortly.
By the accounting of happiness economics, after
dealing with your relationship ending, and then the
death, or very poor health, of those near and dear to
you, losing your job is most likely to make you unhappy.
Gaining a job is the second best event that occurs to
most people, but it is not associated with as much extra
happiness as losing a job is associated with unhappiness and despair.
86
This low-resolution PDF is licensed under a Creative Commons License and
may be passed on electronically for free. It must not be copied for sale.
105.
EsteemJobs
We saw that with relationships it is better to have never
loved at all than to have loved and lost. Alfred, Lord
Tennyson was wrong when he suggested otherwise!135
The message is not dissimilar where employment is concerned. It is better to never have been in formal employment (which was the case for many women in the not
too distant past) than to have been in and out of work
repeatedly – especially at older ages; however, gaining
another post after having lost one is a great joy, or at
least a relief. Changing a job also tends to be associated
with more happiness, but less than half as much as gaining one in the first place.
In the UK you receive significant compensation upon
being made redundant only if you have been in steady
87
Both a paperback version and high-resolution and fully interactive ebook versions
of this book are available to buy direct from the publisher at http://bit.ly/1oGOx9m
106.
A BETTER POLITICSemployment for a long time, and even then only if your
employer has a policy to pay more than the legal minimum. Now that work has become more precarious
and short term, significant redundancy payments have
become rarer. It is possible to have more stable work
than we have now and to have unemployment benefits
(as people in many other European countries have) that
replace a large proportion of your salary for the first two
years in which you might be searching for another job if
you are made unemployed.
In traditional economics there is a great deal of literature that says that making unemployment and welfare
benefits more generous reduces the incentives to find
work. But, of course, it only reduces the incentives to
find work you would not want to do. Increasing unemployment benefits does not decrease the incentive to
work, when the incentive is not fear and desperation.
In a well-functioning labour market employees are able
to choose between jobs and to choose not to do jobs
that are either too lowly paid or too uninteresting to
them. Such a labour market has near full employment.
In 2015 the lowest unemployment rate in the affluent
world was 3.5% in Norway, followed by 4.0% in Japan and
4.2% in Switzerland – the figure for the UK was 7.2%.136
Fortunately, there is a long list of influential economists
who disagree with the traditional ways of thinking. For
instance, consult Molly Scott Cato’s work on green economics,137 or Mariana Mazzucato’s on entrepreneurial
88
This low-resolution PDF is licensed under a Creative Commons License and
may be passed on electronically for free. It must not be copied for sale.
107.
Esteempublic spending,138 or Kate Raworth’s on the role of social
justice in economics.139
People are most productive when they enjoy their
work and are not being asked to work excessive hours.
An experiment currently being undertaken in Sweden
is described below. It is designed to try to work out
whether, to increase productivity, it is better if full-time
work is six hours a day rather than eight. New ways of
working are currently emerging that allow people to
work more flexibly. We have to work out how such flexibility doesn’t also increase precariousness.
In living memory in Britain there was very little unemployment, and a genuine labour market where most
people had some choice over what work they did. They
did not much fear being labelled as redundant, or being
disposed of as part of an ‘efficiency drive’. There were
also times, in the 1930s and 1880s, when we experienced
mass unemployment and thought we might never return
to having useful work for all. Given how important work
is to us in the grand scheme of things, it is worth asking
how we can ensure that the fate of our children and
grandchildren is not as dependent on luck and timing
as ours has been. If you are very successful, you have
almost certainly also been very lucky.
Over the course of the past forty years, those in the
highest-paid tenth of occupations have pulled ever further ahead.140 Incomes have fallen at the bottom when
compared with the rising cost of living. However, the
89
Both a paperback version and high-resolution and fully interactive ebook versions
of this book are available to buy direct from the publisher at http://bit.ly/1oGOx9m
108.
A BETTER POLITICSliving standards of nine out of ten of the best-off tenth
have fallen since the 2008 crash. Only those who have
secured a place in the best-off tenth of that 10% group
– the 1% – have seen their real incomes increase since
2008.141
Within just the top 1%, it is again mostly those at the
very top, in the top 0.1% of society, who have gained
the most, but even they have gained less than the
even richer 0.01%, even in relative terms! The lives of
the super-rich are shrouded in secrecy, but when the
details are revealed, often through divorce courts, the
extremely wealthy and powerful tend not to have lives
of unbridled happiness.
In January 2015 the apparent needs of a few to gain
yet more esteem reached new heights of ridiculousness
and tragedy. Some 1,700 private flights were scheduled
by global business leaders to land at Zurich and other
airports near to Davos so that the richest businessmen
on the planet (and a tiny number of women) could meet
and feel important and discuss the future of the planet,
and threats such as climate change owing to carbon pollution. Even sharing a private jet with others racked up
an individual return flight bill of £18,500, and the burning
of more fuel in one hour than a car uses in a year.142
In the closeted world they occupy, global business
leaders do not consider taking private flights excessive,
because for them and their contemporaries it is normal.
Waiting and being patient is, for them, not normal. Just
90
This low-resolution PDF is licensed under a Creative Commons License and
may be passed on electronically for free. It must not be copied for sale.
109.
Esteemas most of us would find it hard to travel by horse and cart
today, they find it hard to travel as we travel. One great
problem with esteem and employment is that there are
so many different conceptions of normal nowadays. It
is natural to think that how you behave is normal if you
only compare yourself with those you consider to be
your peers. But a better politics requires us all to have a
wider understanding of normality.
You could argue that television and the Internet have
massively opened peoples’ eyes to different worlds,
but these are often manufactured worlds. Parts of the
media have created the cult of the celebrity, idolized the
wealth and lifestyles of the super-rich, and manufactured poverty-porn for mass consumption. Other parts
are more responsible and less puerile. Before them, the
invention of the novel offered a window onto the lives of
different groups in society and opened up peoples’ eyes
to how Britain’s well-to-do lived (Jane Austen) and how
its poor got by (Charles Dickens). People have always
mainly set their view of normality by how their peers are
faring, and what their priests and leaders tell them, but
in recent generations a wider media has emerged and
we can be better informed. Today we can gain a far better idea of notions of global sustainability, of equity and
fairness, should we wish to.
Often what you can find out about the very well off
is surprising. For instance, even in extremely equitable
Sweden, just 3% of the population consume a quarter
91
Both a paperback version and high-resolution and fully interactive ebook versions
of this book are available to buy direct from the publisher at http://bit.ly/1oGOx9m
110.
A BETTER POLITICSof all international flights by distance a year. In less
equitable France, just 5% of the people fly half of all the
air miles flown by the entire French population each
year. 143 And, it turns out, such frequent and apparently
exotic travel doesn’t even much benefit the travellers.
A government concerned with happiness would not
expand airports.
Studies have found that among World Bank employees, those who were long-distance air commuters were
three times more likely to suffer psychological illness.
People who fly more get more disorientated, get less
exercise and eat less well. They are exposed to a huge
number of germs recycled in cabin air, to toxins in that
air, to excess radiation due to altitude; they age faster,
suffer deep-vein thrombosis more often, and, at the very
least, suffer from repeated jet lag. Other studies also
suggest that these ‘hypermobile’ individuals also tend
not to have the happiest of home lives.144 Being a highflyer is not all it’s made out to be.
At the top of the pay tree in the UK in 2015 was Sir
Martin Sorrell, the chief executive of WPP, who received
£43 million in that year: 3,486 times the minimum wage
at the time. WPP is the world’s largest marketing group,
a firm that makes its money persuading people to buy
things they would not otherwise want or bother to buy.
Marketing has a similar effect on increasing consumption, and hence pollution, as unnecessarily frequent air
travel. WPP has done very well for its clients, and so
92
This low-resolution PDF is licensed under a Creative Commons License and
may be passed on electronically for free. It must not be copied for sale.
111.
Esteemsome £36 million of Sir Martin’s pay packet was made
up of long-term awards for what is called ‘business success’. However, even the shareholders of the company,
who also benefited from its growing profits, were angry
about his 2015 level of remuneration.145 Two weeks after
Sir Martin’s take was revealed, it was announced that
Britain had become the most unequal country in Europe,
according to an analysis of pay rates.146
In contrast to chief executive officers (CEOs), the
lowest-paid workers in companies are rarely paid travel
expenses (even if they drive between clients as care
workers). The lowest paid in the UK also suffer much
more from exhaustion and stress than their counterparts in more equitable countries. With the modest
rise in the UK minimum wage in October 2015 to £6.70
an hour, some 390 minimum-wage workers can be
employed for a year for the annual cost of the average
CEO of a FTSE 100 company in the UK.147
Being paid 390 times less than someone else means
that, in theory at least, you would have had to have
started work in 1626 to be paid as much (by 2016) as they
would have been paid in one year alone. King Charles I
would have been crowned as you began your working life. After 100 years of labour you could have read
Gulliver’s Travels, Jonathan Swift’s satirical account of
inequality and society, published in 1726. After a further
century of work you would have begun to see the dawn
of i ndustrialization in 1826. Another century on and you
93
Both a paperback version and high-resolution and fully interactive ebook versions
of this book are available to buy direct from the publisher at http://bit.ly/1oGOx9m
112.
A BETTER POLITICScould have taken part in the General Strike of 1926. And
finally, by 2016, you could have earned, and maybe even
saved, as much as the boss of your firm might get paid
in a year – if we forget your housing costs, food costs
and the small problem of living that long. Oh, and you
will have done all that as a woman, because the majority of people on the minimum wage are women, and
women are still paid much less than men for doing the
same work.
94
This low-resolution PDF is licensed under a Creative Commons License and
may be passed on electronically for free. It must not be copied for sale.
113.
EsteemNo doubt Sir Martin Sorrell has his own inspiring story
to justify his high income. He has been paid far more than
most of those CEOs. Almost everyone tells themselves
stories that justify most of their actions, but, as psychologists Carol Tavris and Elliot Aronson explain, we all:
need a few trusted naysayers in our lives, critics who
are willing to puncture our protective bubble of
self-justifications and yank us back to reality if we veer
too far off. This is especially important for people in
positions of power.148
Pay inequality in the public sector is far lower than in
the private sector, and it is now also coming down in many
cases. Table 3 uses data released by the National Audit
Office in 2015. It shows the ratio of top pay to median pay
in a number of selected organizations. Not all seventeen
major government departments have r eleased their pay
ratios. Those that have failed to do so include the Department of Health, where inequalities in civil servant pay may
Table 3. Pay ratios in selected government departments and agencies
(2013–15).
Ratio
4.7:1
5.6:1
6.3:1
7.9:1
8.7:1
8.5:1
Maximum
£182,000–£185,000
£200,000–£205,000
£160,000–£165,000
£197,500
£195,000–£200,000
£200,000–£205,000
Median
£38,919
£30,640
£29,185
£25,261
£22,669
£23,805
Organization
HM Treasury 2013–14
Environment Agency (EA)
Environment, farming, rural (Defra)
DCLG: Planning Inspectorate (Admin)
HMRC 2013–14
HMRC 2014–15
Source: the 2014 report can be found at https://www.nao.org.uk/Collections/short-guides-to-dep
artments/ and the 2015 report can be found at https://www.nao.org.uk/search/pi_area/short
-guides/type/report/.
95
Both a paperback version and high-resolution and fully interactive ebook versions
of this book are available to buy direct from the publisher at http://bit.ly/1oGOx9m
114.
A BETTER POLITICSbe very high. However, inequalities within one department measured at two points in time are falling – that
department is HM Revenue and Customs itself.149
Paying people at the top excessive amounts of money
is just one very obvious signal that there is much that is
very wrong with the world of work in the UK. We simply have to compare ourselves with any other country
in Europe to see that pay inequalities indicated as being
normal in table 3 are not tolerated elsewhere.
HMRC was not made more efficient by paying the
person in charge 8.7 times the remuneration of the
median worker in that department in 2013–14. Will that
median (middle-ranking) employee, a tax inspector, feel
well rewarded and motivated on a salary that remains
below £24,000 when inspecting the tax affairs of others
who receive so much more? The National Audit Office
calculation of the median only takes into account those
that are directly employed: it does not include cleaners
if they are subcontracted, or those very highly paid
officials who used to ask for their pay to be made out
to their company rather than to themselves. The latter
practice is now being outlawed, but the subcontracting
of cleaners at below the living wage is not yet outlawed.
If it were, happiness would rise.
At an individual level, stopping the rising trend in
inequality is only easy if you are an employer or trustee
of an organization, a director or an executive. Even
then it is not simple. Your colleagues may well object
96
This low-resolution PDF is licensed under a Creative Commons License and
may be passed on electronically for free. It must not be copied for sale.
115.
Esteemto any curtailing of pay at the top because of what they
describe as ‘market forces’. But look at what HMRC has
done in the table above. Median pay rose by 5% between
2013–14 and 2014–15, while top pay rose by half as much
in percentage terms. But this is still almost five times
as much in absolute terms: a rise at the top of £5,000,
compared with the £1,136 pay rise for those in the middle
that can be calculated from the table above. Relative pay
gaps can fall while absolute differentials still rise.
Before concerning themselves with narrowing
pay ratios, the first thing anyone in charge of any
half-decent organization should do is immediately
pay the living wage. This is not the Chancellor of the
Exchequer’s proposed ‘national living wage’, but the
one that is calculated every year by academics at the
University of Loughborough. The real living wage is
not some fanciful utopian ideal. It is determined with
the support of the Joseph Rowntree Foundation and
the food and confectionery giant Nestlé. An organization that cannot pay the living wage may be badly
run in other ways. People heading such organizations
are beginning to realize that others might come to
that conclusion about their ability. Outside of London
the real living wage is £8.25 an hour. It may be higher
when you read this, as rents and other costs are still
rising quickly.
If you do not have control over wages, or if you are
reliant on benefits or a pension, then you have to lobby
97
Both a paperback version and high-resolution and fully interactive ebook versions
of this book are available to buy direct from the publisher at http://bit.ly/1oGOx9m
116.
A BETTER POLITICSand campaign. Several organizations do this and they
all need help: see www.shareaction.org/justpay, www.
equalitytrust.org.uk and www.cpag.org.uk among many
others. The list of organizations paying the true living
wage is now very long, and it is getting longer. In January 2015 Brent Borough Council became the first local
authority in the UK to offer businesses in their area a
reduction of £5,000 in their business rates if the business
became a living wage employer.150
We all need to concern ourselves with why the UK
pay gap is growing. Two brilliant websites that help in
this task are www.paycompare.org.uk/pay-multiples
and http://highpaycentre.org, with the former reporting on the current pay gaps within many public and
private bodies. So far the only business to actually
refuse to reveal their pay gap is Barclays Bank (but
at least they now pay the real living wage). We need
greater and greater scrutiny of minimal and maximal
pay, and to ask why the gap between the two is not
closing.
We can compare ourselves with other countries.
In 2014 part of Swedish local government began an
experiment to see what would happen if public sector
employees worked only six hours a day but were paid as
if they had worked eight hours. Private sector workers
in the car industry in Gothenburg had already made this
transition and found that it increased efficiency. There
was criticism, but the mayor replied:
98
This low-resolution PDF is licensed under a Creative Commons License and
may be passed on electronically for free. It must not be copied for sale.
117.
Esteemwe’ve worked a long time on this, we’ve not planned
it to be an election thing. These people are always
against shortening hours.151
A year later, when initial results were positive, many
private and public sectors bodies took it up. Swedes
were to be paid for eight hours a day but only asked to
work for six hours a day. This was not just a 33.3% pay
rise: it was an attempt to ensure that no one works for
too long at one thing, and if they do that they work better in those six hours. Other aspects of their lives also
improve, including their relationships within their families. Freedom and happiness increase when people have
more time to choose what they want to do. Most people
will not simply choose to have a siesta, but if they do,
that is their choice.
The news of this Swedish experiment showing initial
signs of success was picked up worldwide. Often, newspapers commenting on it would also inform their readers
that there were health benefits to working fewer hours
for better pay because:
Working between 41 to 48 hours gives workers a 10 per
cent higher risk of stroke, which then jumps to a 27 per
cent increased risk if working 49 to 54 hours.152
People don’t just produce worse work and have skewed
priorities when they work too much. One business commentator in the US concluded: ‘So Sweden has it right,
and the US should follow.’ 153
99
Both a paperback version and high-resolution and fully interactive ebook versions
of this book are available to buy direct from the publisher at http://bit.ly/1oGOx9m
118.
A BETTER POLITICSIn the Netherlands a different experiment is being
developed. In the Dutch city of Utrecht a basic income is
to be introduced during 2016. A randomly chosen group
of welfare recipients in Utrecht will receive around €900
a month, with no conditions attached. Another group
will continue to be subject to the normal regulations.
The project’s manager succinctly describes the theory
as follows: ‘We think that more people will be a little bit
happier and find a job anyway.’ 154 That theory is based
on decades of academic work suggesting that basic
incomes for all are preferable to means-tested welfare.
In which case, why has it never been introduced before?
One argument is that it would be good for removing
the poverty trap but expensive if not introduced at a
very low level, and there may possibly be other adverse
incentives. Another argument against introducing a
basic income is that the rich do not want to pay the extra
taxes that would fund it. However, it could be what even
their own children need to break the cycle of having to
take work they do not want to do simply because it pays
well. In 2017 Finland will begin to experiment with an
€800 a month basic income, to be introduced by their
centre-right government.155 The idea is winning support
from across a wide range of political viewpoints.
The central idea of a basic income is that very few
people abuse the welfare system, and if the welfare system is about ensuring everyone has enough to live on,
why not just give everyone just enough without question?
100
This low-resolution PDF is licensed under a Creative Commons License and
may be passed on electronically for free. It must not be copied for sale.
119.
EsteemAs any basic income is below a level most people would
want to live on, almost everyone continues to carry out
paid work, and part of the taxation of that paid income
goes towards allowing everyone to have a basic income.
However, once a basic income is high enough, people are
free to choose not to do inadequately paid work, or even
better-paid work that they do not see a value in doing, and
so the labour market begins to function properly: people
can exercise choice. A basic income could be introduced
at a very low level, say just £1,040 a year, £20 a week, and
then slowly increased. Imagine if one were introduced
across the European Union at, say, €1,500 a year. That
money would go further in poorer parts of the EU than in
richer countries, and it would reduce the need for people
to move between areas as much as they presently do.
When you introduce a basic income you remove most
of the assessments required in means-tested systems,
and all income gets taxed, much more progressively than
at present. High wealth would also need to be taxed to
pay for a basic income, so such schemes are fiercely
opposed by some of the very wealthy. But no one would
have to do a job that they think is stupid, or too unpleasant to justify the reward being given – just to survive.
Changes in how we live, work and interact are under
way without the need for experimentation to instigate
them, although the introduction of a basic income would
accelerate these new trends. Paul Mason gave some
examples in a 2015 Guardian article:
101
Both a paperback version and high-resolution and fully interactive ebook versions
of this book are available to buy direct from the publisher at http://bit.ly/1oGOx9m
120.
A BETTER POLITICSWe’re seeing the spontaneous rise of collaborative
production: goods, services and organisations are
appearing that no longer respond to the dictates of
the market and the managerial hierarchy. The biggest
information product in the world – Wikipedia – is made
by volunteers for free, abolishing the encyclopaedia
business and depriving the advertising industry of an
estimated $3bn a year in revenue. Almost unnoticed,
in the niches and hollows of the market system, whole
swaths of economic life are beginning to move to a
different rhythm. Parallel currencies, time banks, cooperatives and self-managed spaces have proliferated,
barely noticed by the economics profession, and often
as a direct result of the shattering of the old structures
in the post-2008 crisis.156
So much is changing so quickly when it comes to the
subject of work that it is easy to miss the good news
stories: the experiments with shorter working weeks
and with paying a basic income, and the amazingly rapid
growth in collaborative working worldwide.157
A better politics for a happier, healthier UK would see
the introduction of a basic income: it would initially be at
a very low level, but it would be universal.
To make the labour market work well, people need
to have real choices in that market over what work
they want to do, when to work and for how long. Any
small steps towards making labour an efficient market,
as well as being more competitive and open, should be
welcome.
102
This low-resolution PDF is licensed under a Creative Commons License and
may be passed on electronically for free. It must not be copied for sale.
121.
EsteemUnemployment
The official UK unemployment rate is low by international standards, although still roughly twice that in each
of Switzerland, Norway and Japan. However, in comparison with other European countries there are many who
are self-employed and might not have much actual work,
as well as high numbers of employees on zero-hours
contracts who may not be paid much or anything in
some weeks. This, and the lack of pay bargaining power
that results, means that people are not doing useful jobs
they would have chosen to do in a well-functioning ‘free’
labour market. ‘Low’ UK unemployment means one in six
young adults cannot find a job and are claiming benefits
103
Both a paperback version and high-resolution and fully interactive ebook versions
of this book are available to buy direct from the publisher at http://bit.ly/1oGOx9m
122.
A BETTER POLITICSfor that reason: three times the rate for all adults. If
full-time students who are often also searching for a job
to make ends meet are included, youth unemployment
rates are higher still. From 1945 to 1975, only one in fifty
adults, both young and old, were unemployed at any one
time in most years.158 We have had a better-functioning
labour market before, although in many towns for most
people the bulk of the work on offer was only in a few
factories and was usually extremely monotonous and
often damaging to health. However, fewer women were
in paid work then, partly because an average full-time
factory wage could support a household. More women
had been in work before 1945, when average pay had
been lower, and so many more worked as servants.
It is very important to realize that statistical tricks and
low benefit levels can make official unemployment rates
appear lower than they are. Between 2008 and 2015,
3 million people in the US who had been working left the
labour market and didn’t register as unemployed because
benefits there are so low.159 This resulted in the reported
US unemployment rate falling to 5.1% and zealous politicians claiming that all was well in the land of the free.160
In the UK it is proposed that from April 2017 onwards
adults aged under twenty-two will no longer be eligible
for housing benefit payments. This will force them to
stay with their parents and they will be unable to claim
unemployment benefit if someone in their family has a
job, so one headline measure of the unemployment rate
104
This low-resolution PDF is licensed under a Creative Commons License and
may be passed on electronically for free. It must not be copied for sale.
123.
Esteemwill again appear to fall. These policies were announced in
July 2015, at the same time as a newly elected UK government proposed to abolish the Child Poverty Act of 2010,
replacing it with a new Life Chances Act of 2015 that would
concentrate solely on ensuring young people had what
the government described as ‘chances’. Officials would
no longer have a duty to be concerned about poverty.161
Just before Christmas 2015, child poverty in the UK was
reported to have fallen by 3.7 million – but only because
the Life Chances Act changed the definition of poverty; in
reality, child poverty rose.162
Between 2010 and 2015 in the UK, some £18 billion a
year was cut from welfare benefits, instead of raising
taxes, when the banks had to be bailed out. More cuts are
to come in the very near future: ‘Total managed expenditure is due to fall from 40.9% of national income in 2014–15
to 36.5% in 2019–20.’163 As early as 2014, the initial cuts were
hitting working families on low incomes with children
the hardest. They were already losing £1,650 a year in tax
credits and other benefits. This is a group of people who
were already poor before losing this extra £4.53 a day. The
cuts were concentrated on the North of England, being
43% higher there per family than in the South.164
In the UK we have imported a media culture from
the US that feeds the myth that everyone has a chance.
From The Apprentice to Dragons’ Den, the message is ‘try
hard enough and you can make it’. There are all kinds
of TV and radio programmes on entrepreneurship, and
105
Both a paperback version and high-resolution and fully interactive ebook versions
of this book are available to buy direct from the publisher at http://bit.ly/1oGOx9m
124.
A BETTER POLITICSendless competitions. Everything is a competition, even
making a cake (The Great British Bake Off). The BBC, the
second most lauded national collective treasure after
the NHS, is happily playing along, instead of helping to
promote a different narrative.
One argument that has been made is that the loss of
welfare support will have resulted in more people looking
for work and finding work. By 2015 this claim had been
tested, and the conclusion was that there was no evidence
to support such a claim. Instead, a huge amount of pain
has been inflicted for no evident gain. Within the UK it is
the poorest people in the poorest neighbourhoods in the
poorest cities and regions who have suffered the most
as public spending falls. More local shops shut as people
have less and less money to spend locally. There is a very
large multiplier effect of cutting the incomes of the poor,
because the poor spend all their income.
Back in the 1990s people had little idea that in Britain,
and much of the rest of the rich world, they were living
in a period that would later be seen as the start of an
economic boom that would turn to bust in 2008. The cartoon on the facing page is an updated version of a very
famous cartoon that was popular in the 1930s. Back then
the salary of the man at the top was £10,000 a year and he
wore a top hat, the man below him lived on £1,000 a year
and wore a bowler hat, the man below him wore a t rilby,
and the man at the bottom had a flat cap and was unemployed. Although the times have changed and it is now
106
This low-resolution PDF is licensed under a Creative Commons License and
may be passed on electronically for free. It must not be copied for sale.
125.
Esteema woman at the bottom, the concept remains the same.
However, one difference between now and the 1930s is
that the man at the top is stepping up a rung, not down.
Economic inequality features repeatedly in the pages that
follow, even though no one states in a survey that in the
past year they noticed inequality rising and affecting their
107
Both a paperback version and high-resolution and fully interactive ebook versions
of this book are available to buy direct from the publisher at http://bit.ly/1oGOx9m
126.
A BETTER POLITICSfamily. We have to link what people say matters to them
with that which then affects those events the most.
The real rates of unemployment and underemployment are far higher than is revealed by official figures.
Surveys that ask people if they would like work, or fulltime work, reveal that there are many more such people
than those who are claiming benefits. Many people may
disguise their unemployment through registering for
tax purposes as self-employed, or simply by describing
themselves as self-employed on a census form, when
they actually have little or no work.
Disrespect
There is far more to enabling people to enjoy the esteem
they could have than simply reducing pay inequalities and
108
This low-resolution PDF is licensed under a Creative Commons License and
may be passed on electronically for free. It must not be copied for sale.
127.
Esteemunemployment. For instance, groups that advocate better rights for women explain that a fairer society cannot
be achieved through solely eradicating the gender pay
gap, improving childcare and instituting other progressive measures. For example, even if all the Scandinavian
countries’ policies were adopted in the UK, this would
not eliminate gender-based violence, which still remains
high in Scandinavia but is also possibly better recorded
there than in less-equal affluent societies.165 All Western
societies, even those in Scandinavia, remain patriarchal,
including some other countries with low income inequality, such as Japan and South Korea.
A patriarchy is a society controlled by men. It may
include many women. It tends to give much more weight
to a particular old-fashioned set of economic concerns
over and above social, environmental and more enlightened economic concerns. It tends to not be inclusive
when considering policy and planning objectives. Patriarchy values individual needs over social connections.
It sees productivity as being only about money, and
not about the production of new human lives or the
development of a society that is mutually supportive.
Patriarchy does not see the public sector as a mitigating
force when markets, to various degrees, fail. No sane
family would arrange its internal dynamics using market
forces. Although families are one of the mechanisms
that reproduce and maintain broader social inequalities,
families are also based on love.166 Our love and caring for
109
Both a paperback version and high-resolution and fully interactive ebook versions
of this book are available to buy direct from the publisher at http://bit.ly/1oGOx9m
128.
A BETTER POLITICSothers need not be constrained to our now very small
families.167
In the UK today the main roles for many women are
often seen as the solution to care issues. The love and
enjoyment involved in childcare and other care is routinely undervalued. Women are still routinely objectified
as sexual objects in UK culture and in public discourse.
We know the situation is in many ways much better than
it was a generation ago, so we do not see how antiquated
our current behaviour and social norms may appear in a
generation’s time – if there is more progress. Women in
the UK are still the targets of systemic abuse and serious
violence on a scale that may well be remarked upon in
future as having been intolerable, but which is currently
seen as normal. Institutionally, through gender inequalities, and individually, usually within families, women
suffer far more abuse than men. Families may be based
on love, but there is often a great deal of hate within
them, and that in turn is influenced by the nature of the
society within which families form, exist and try to sustain themselves.
The kinds of policies that are needed include free
universal childcare for under-fives, including the option
to care for your own children. Looking after your own
young children should not be unaffordable. We should
not pay people so badly that all adults in a family have
to take paid work. Flexible working needs to be introduced across all businesses and all sectors, and this is a
110
This low-resolution PDF is licensed under a Creative Commons License and
may be passed on electronically for free. It must not be copied for sale.
129.
Esteemrequirement that will soon become more urgent because
of our ageing population. The disproportionate poverty
rates for women need to be tackled. Two-thirds of those
earning under £10,000 a year, and usually receiving much
less than that, are women. One in four older women in
the UK live below the poverty line.168
Trying to reduce gender inequalities today is like swimming against the tide of this decade. The UK government
plans to try to remove feminism from the A-level politics
syllabus in a move reminiscent of its earlier attempts to
remove climate change from the study of geography in
UK schools.169 Aggregated household statistics ignore
women’s inequitable access to family income and lead
to policy that often does not properly cater for women.
The 2010–15 coalition government reduced tax bills by
£17 billion, and 58% of the beneficiaries were men. Men
arrange to pay themselves more than women.170 Claiming
that these reductions in tax will help the men’s families
demands a particularly quaint view of families.
Despite the legal acceptance of gay marriage, there is
currently a discriminatory emphasis on the importance
of the supposed traditional nuclear family, which can
lead, among much else, to cases of violence against
women being seen as unimportant. There are plans
being executed now to bring in a form of universal credit
and replace tax credits with higher tax allowances, in a
way that is anticipated to adversely affect women much
more than men.
111
Both a paperback version and high-resolution and fully interactive ebook versions
of this book are available to buy direct from the publisher at http://bit.ly/1oGOx9m
130.
A BETTER POLITICSParliament should assess all economic decisions
to determine whether they might adversely impact
women’s lives disproportionately and increase or lower
economic inequalities more generally. Child benefit
needs to be both restored as universal and raised in line
with real earnings. Action is required on discrimination
in the workplace, including pregnancy, maternity leave
and pay discrimination, and support for childcare and
part-time working needs to be improved.171
The position of women in British society is worsening
now, but over recent decades it had been improving and
beneath the surface it may still be improving in a way
that will soon have beneficial effects that may come as
112
This low-resolution PDF is licensed under a Creative Commons License and
may be passed on electronically for free. It must not be copied for sale.
131.
Esteemsomething of a surprise. A new book by Dawn Foster
called Lean Out was published in January 2016. It critiques Sheryl Sandberg’s Lean In, a guide for women in
business, explaining that for all the commercial success
of a very small number of women, their success has
been achieved by an approach that is individualistic and
largely unthreatening to male-dominated capital.172 Far
more women than men now graduate from UK universities. Do we really think that such a highly educated new
young cohort will not change the world for the better?
Do you think that millions of female graduates (and male
ones too) in the UK will in future teach their sons and
daughters to be servile, or will they teach them to stand
up to the few men controlling so much of our money?
Half of all young women in England now go to university,
and that recent shift in educational patterns could have
a huge impact in the future. The next generation could
be transformational.
113
Both a paperback version and high-resolution and fully interactive ebook versions
of this book are available to buy direct from the publisher at http://bit.ly/1oGOx9m
132.
Chapter 6Education
Education should indeed be responsive to the needs of
society. But this is not the same as regarding yourself as
a service station for neo-capitalism.
— Terry Eagleton173
A
s people gain more education, they become more
conscious of their own ability, have more scope to
increase that ability, and feel more valued and recognised by others. Unlike sharing out land, housing and
much other material wealth, education is not a zerosum game. Everyone could feel more valued and be
better educated without others needing to have less,
but achieving this requires a better politics than we currently have.
Self-actualization appears in the upper reaches of
Maslow’s hierarchy. Education aids such actualization.
Education in the UK should be more about learning to
be creative and less about conforming to unimaginative
syllabuses and passing exams.174 The conformity created
by exam results and school league tables will also
This low-resolution PDF is licensed under a Creative Commons License and
may be passed on electronically for free. It must not be copied for sale.
133.
Educationdisempower young people in the future world of work,
as another wave of automation changes the future skills
that are going to be most needed in future employment.
School
After starting a new relationship, acquiring a job, securing a home and becoming a parent or grandparent,
the next most important event associated with gaining more happiness is doing well in education. Sadly,
115
Both a paperback version and high-resolution and fully interactive ebook versions
of this book are available to buy direct from the publisher at http://bit.ly/1oGOx9m
134.
A BETTER POLITICSwhen people comment on their children’s educational
achievements over the past year, they often register
disappointment. Table 1 in chapter 2 shows that parents
are more unhappy than usual when they comment on
their children’s education, in contrast to young adults,
who talk more positively about educational experiences.
More UK parents seem upset with how their children are
doing at school than are impressed.
There are particular aspects of the British education
system that are unusual compared with otherwise
similar countries. In 2013–14, the most recent year for
which there is data for England, the number of children
who were permanently excluded from primary schools
included some 6,510 children with Special Educational
Needs and Disability (SEND) statements. In addition,
a further 30,230 children with SEND but no statement
(i.e. those that did not require special provision) and a
further 8,280 children who were not labelled as SEND
were also permanently excluded. It is possible that more
children are permanently excluded from primary schools
in the UK each year than are expelled from all the other
primary schools of Europe combined.
For secondary schools, most students who are
permanently excluded are those with special needs or
disabilities. In 2013–14 in England alone these included
some 13,340 secondary-aged children with SEND statements and 96,750 with SEND but no statement (a further
100,490 were excluded without being labelled as SEND).
116
This low-resolution PDF is licensed under a Creative Commons License and
may be passed on electronically for free. It must not be copied for sale.
135.
EducationThese numbers are enormous.175 We simply do not know
what happens to all the excluded children. Such high
rates of school exclusion make little sense in terms of
the wider effects on everyone outside of the school.
For children expelled from inner London state
schools at the age of ten, the average cost per child to
the state of dealing with the consequences in the subsequent eighteen years was £70,019 according to a study
published in the British Medical Journal in 2001 that has
withstood any revision since then.176 This is the average
cost of subsequent criminal damage, drug dependency
and treatment after subtracting the normal incidence of
those things. But in the short term it makes the school’s
statistics look better. The school has a strong incentive
to opt for exclusion because it will help its closely monitored results data. How can we be excluding so many
ten-year-olds in England and not asking, in shock, why
we do this to such young children?
In most of the rest of Europe children do not go to
school quite as early as they do in the UK, and children
are not tested at the age of four or five, when they arrive,
as they currently are in England. Those tests have been
shown to be extremely unreliable and potentially very
harmful for children and schools.177
In 2008, 30.5% of all educational expenditure in
the UK was private, mostly on the 7% of children who
attend private schools. On average, between four and
five times as much is spent on each privately educated
117
Both a paperback version and high-resolution and fully interactive ebook versions
of this book are available to buy direct from the publisher at http://bit.ly/1oGOx9m
136.
A BETTER POLITICSchild per year as is spent on each state-educated child’s
provision.178 The next highest private education spending in Europe was in Cyprus, where 17.3% of education
spending goes on a small minority. In contrast, private
education spending is lowest in Norway (1.8%), Finland
(2.6%) and Sweden (2.7%). This spending includes monies
spent on home tutors, pre-school education and tuition
fees, so in these three countries, and in most of the rest
of mainland Europe, there is hardly any private school
education. Overall, state spending on education in the
UK per child is lower than in many other European countries. This is not surprising, as when most of the elite who
control national budgets do not use state education for
their own children, why would they care much about low
rates of spending in state schools?
If this system were beneficial, the UK would not
be languishing, as it is, at the bottom of several education league tables when the richest twenty-five large
countries of the world are compared.179 Within the UK,
Scotland and Wales have universal comprehensive education, while Northern Ireland still has widespread class
(grammar school) and religious (sectarian) school segregation. The current education system does not benefit
the affluent English very much, however, as they become
even more out of touch and segregated, and are trained
to pass exams rather than learn.180
The UK does very badly in international comparisons when young adults are examined at ages up to
118
This low-resolution PDF is licensed under a Creative Commons License and
may be passed on electronically for free. It must not be copied for sale.
137.
Educationt wenty-four. Repeated examining means that in England
and Wales we learn for the day of the test and not in a
way that helps us retain what we were taught, nor are
we taught how to approach problems imaginatively, so
we do badly when tested again at ages up to and including twenty-four.181 Although there are variations around
the UK, all four devolved nations test children repeatedly
and use these tests to rank children according to ‘ability’
or ‘potential’. Very many go on to universities later, with
their own hierarchies of reputation, and then to different kinds of job with huge ranges of income and status.
It is possible that no other country in the world has as
great a range of university scores in international league
tables as the range in the UK.
The British tolerance of extreme differences can hurt
those at the top as well as those at the bottom. While it is
true that most children in private schools do not board182
and that they achieve very high exam grades on average (and higher pay later), they have been trained in a
particular way, taking examinations very seriously at the
expense of other ways of developing the ability to learn.
And does Britain as a whole benefit from being led so
disproportionately by people who have had such narrow
training to jump through particular examination hoops,
rather than a more well-rounded education during which
they mixed with a cross-section of all in society?
Inclusion, respect and working together are not
qualities that have been in vogue in English education
119
Both a paperback version and high-resolution and fully interactive ebook versions
of this book are available to buy direct from the publisher at http://bit.ly/1oGOx9m
138.
A BETTER POLITICSin recent years. A leading educationalist, Sally Tomlinson, put it succinctly in 2015: ‘the neo-liberal dream of
competitive individualism now guides educational consciousness and sensibility’.183 And this affects the privileged as much as the underprivileged. Carry on this way
and every child has to compete harder than the children
before them, each must learn to perform better to the
test, and control and constrain their imaginations more
than those before them did. Our schools risk looking and
becoming more and more like exam factories.
Reports are produced each year on the biases involved
in the recruitment of people to jobs in the UK. The small
minority of university graduates who have been to private schools take up the large majority of starter jobs in
elite financial firms and legal firms in the City of London.
Those who recruit for these jobs know full well about
this bias but respond: ‘How much mud do I have to sift
through in that [state-educated] population to find that
diamond?’ 184 The study that led to that comment being
made explained that it had now become necessary ‘to
challenge dominant narratives which circulate within
the professions about the meaning of merit/talent’.185
The increasing dominance of private schools in UK
public life is a common complaint. It is not just that
people with private school backgrounds dominate in law,
politics, journalism and the upper echelons of management,186 it is that they now dominate even in drama, on
TV and in sport at the elite Olympic level,187 and even in
120
This low-resolution PDF is licensed under a Creative Commons License and
may be passed on electronically for free. It must not be copied for sale.
139.
Education‘popular culture’. According a 2010 column in The Word,
‘around 60% of chart pop and rock acts came from a private school background, whereas twenty years earlier it
had been closer to 1%’.188 That statistic turned out to be
something of an exaggeration, but the original writer of
the article has later explained that:
poshification of pop is, I maintain, a reality. And that
growing stranglehold is as bad for pop as it is for
society.189
A survey of 2,500 people working in the arts that was
released in late 2015 confirmed that 75% had had a parent able to support them so they could work for free
to get into that business.190 In such a climate, someone
who does not quickly achieve great things, or at the very
least a high salary, despite belonging to the 7% who are
privately educated can easily come to feel inadequate.
The inequality within the education system fosters
separation and fear. A few of us struggle to pay for our
children to go to the most expensive schools we can
afford, and more of us try to afford to live in the catchment area of what we consider to be a good school.
We may then give our children the impression that for
us not to achieve this would have been a terrible fate,
and that they should copy our choices when they are
adults. Our children have little understanding of other
children’s lives, of other options, because they mix only
with children in the same narrow band of the hierarchy.
121
Both a paperback version and high-resolution and fully interactive ebook versions
of this book are available to buy direct from the publisher at http://bit.ly/1oGOx9m
140.
A BETTER POLITICSSo segregated have we become that we start treating
different groups of people almost as different species.
Large sections of the population are demonized as
‘chavs’.191 It is in this context that schools, especially
those in England, have to try to teach.
We have socially engineered the current situation
and it makes people callous. It makes some claim that
they would work less hard if they had to give 50% of any
extra income to the government, rather than continue
to pay tax at 45% over a certain, very high, salary level.
Those same people then often suggest that there is
another type of person who should be content to work
more hours for a quarter of the minimum wage – which
is what the introduction of universal credit, as currently
planned, would do with a 75% ‘taper rate’.192 The idea that
such behaviour is reasonable has been created by our
current social and educational systems.
We need to recognize that our competitive schooling
system in the UK produces poor results by international
standards. Better policy options would look more often
to schools in other countries. Our children are not well
served by how we organize our schools, our examinations and our society. This applies to the most supposedly
privileged child, segregated at an early age away from
others, as much as it applies to the rest of us. Without
a better framework for our education system, most of
the inequalities covered in this book will continue to be
socially reproduced and will perpetuate.
122
This low-resolution PDF is licensed under a Creative Commons License and
may be passed on electronically for free. It must not be copied for sale.
141.
EducationUniversities
Children from state schools, on average, do a little better
at university than children from private schools in terms
of the likelihood of gaining a 2:1 or a first-class degree.
One of the reasons for this may simply be because they
went to a state school. State school pupils find university
study easier – and they find being in an environment
with a wide mix of other people easier too. There are
many advantages to non-selective state schools.193 The
fact that they are the high achievers from within their
state schools explains only five of the nine-percentage-point advantage that state school children with the
same A-level grades have at university.194
Despite their disadvantages, even privately educated
children who do poorly at university proceed, on average, to earn more than those who did better than them
123
Both a paperback version and high-resolution and fully interactive ebook versions
of this book are available to buy direct from the publisher at http://bit.ly/1oGOx9m
142.
A BETTER POLITICSat school and university but who were not from such
affluent families.
The findings just outlined do not mean that stateschooled children do well in general. Some economists
have called for increased downward mobility of those
from affluent backgrounds and schooling, to make room
for upward mobility.195 This is tantamount to a call for yet
more competition and angst amongst the rich to match
that existing among the poor. It is no child’s fault if they
attended a private or selective state school. Their parents are almost always simply trying to do the best for
them. A solution to all this angst to get your child to the
top would be to work towards achieving much smaller
income gaps between all occupations, and also towards
reducing the income gap between those not working
and those in employment. If higher incomes were not so
high, if top jobs were not perched on such a steep and
slippery slope, everyone would benefit.196
Another case that now needs to be better made in
the UK is the argument for higher education to be free
at the point of delivery and paid for by all, not individually or by family. You would not ask adults to choose
what level of healthcare they might want in future
and then suggest they take out a loan to pay for it, so
why do the same in university education? Yet we now
have high university tuition fees in England. In most of
Europe, and much of the rest of the UK, there are no, or
low, university fees.
124
This low-resolution PDF is licensed under a Creative Commons License and
may be passed on electronically for free. It must not be copied for sale.
143.
EducationCurrent university students, future students, those
already paying back fees and the parents and grand
parents of all these groups know that many of the
tuition and maintenance loans will never be repaid. At
least they would know that if they looked carefully at
the terms and conditions of the student loan. Although
most graduates will never fully repay their loan, they
will be paying out a great deal of their future earnings
in interest payments. Their university education will cost
them very dear in future. And they also need to be aware
that those terms and conditions can be arbitrarily and
retrospectively changed at any point, with no consultation, in order to increase payments in the short term (as
happened in autumn 2015). Future taxpayers will have
to make up any shortfall, which will include that same
cohort who are now young graduates. One reason many
leading members of the London-based establishment
still favour loans is that they themselves are wealthy
enough to pay their children’s university fees upfront.197
Nick Hillman has helpfully written a small booklet
that shows that the UK is very similar to Germany –
indeed his publication is so clear that, although he has
argued the opposite, it demonstrates that we could
run their system instead of our own.198 A large part of a
better politics involves unravelling mistakes made in our
recent past. They might not have originally looked like
mistakes, because in the past higher education was so
dominated by the upper middle class that public funding
125
Both a paperback version and high-resolution and fully interactive ebook versions
of this book are available to buy direct from the publisher at http://bit.ly/1oGOx9m
144.
A BETTER POLITICSof it appeared to be a subsidy to the affluent, but that
funding was withdrawn just at the time when more and
more working class children, especially women, started
to get into universities. There is a deep irony in the timing
of the decision over the largest absolute rise in loans to
£9,000 in 2010. In that same year it was announced that,
for the first time, a majority of young women in England
were going to university: 51%. This contrasts with a figure of less than 40% for young men.199 Many, if not most,
of those women will never earn as much as an average
non-graduate plumber or taxi driver, let alone the even
higher paid men, but they will still have to spend years
paying the interest on the loans they were encouraged
to think of taking out when they were still children.
Germans still value the role of higher education and
high-quality technical education. People in Germany pay
more in tax and less in rent. UK governments continue to
make the argument that:
At current tax levels, governments can no longer afford
to be the primary or nearly sole source of revenues for
public higher education, and market-related solutions
seem inevitable. 200
Of course, one alternative would be to tax income at
levels similar to those in Germany, and then, suddenly,
the inevitable would become entirely avoidable.
We should learn what not to do by looking at the US,
where the lowest-paid university lecturers have seen a
126
This low-resolution PDF is licensed under a Creative Commons License and
may be passed on electronically for free. It must not be copied for sale.
145.
Educationreal-terms pay cut of 20% between 1986 and 2015, in spite
of rising fees – fees that were instead used to triple the
pay of state-funded college presidents. It is also notable
that US student fees have risen dramatically, while the
number of individuals employed in US universities earning a million dollars a year has doubled. 201 This simply
does not happen in other countries that do not have
such high student fees – which is most other affluent
countries worldwide.
In the US most universities are still officially non-profit
organizations, but some are now profit making. Look at
the attempts in the US in 2014 to pass bills in the Senate to refinance student loans at lower interest rates;
to refinance the loans again in 2015 through the failed
Student Loan Relief Act; and now the serious proposals
by one of the two main Democratic nominees to stand
for president to make public college education free. 202 In
late 2015 retrospective changes were made to the terms
of UK student loans. These brought forward the point
at which they must be repaid. The repayment scheme
that had been promised when the loans were taken out
was revised for students already at university. Children
who decided to go to university on the basis of one loan
scheme found it altered once they were studying at university. Why should anyone believe a government that
misleads children like this?
A university system based on loans is unsustainable in
the medium term. In the short term it has resulted in the
127
Both a paperback version and high-resolution and fully interactive ebook versions
of this book are available to buy direct from the publisher at http://bit.ly/1oGOx9m
146.
A BETTER POLITICSsector being at least a billion pounds better off than it was
a few years ago, but the cost of that extra borrowing to
people who are currently aged eighteen to twenty-one
will be far more than a billion pounds. By 2020, eight years’
worth of English students and graduates will be carrying
the highest student loan debt in Europe. Most of these
new young debtors will be young women.
Education and the environment
Education should not be about getting into so much
debt, competing so hard for grades or being misled so
much by adults. It should be about learning, growing
and enjoying studying – and it was in our recent past.
The survey (again see table 1 in chapter 2) suggests that
education and leisure activities both increase happiness,
128
This low-resolution PDF is licensed under a Creative Commons License and
may be passed on electronically for free. It must not be copied for sale.
147.
Educationalmost identically: they are the sixth and seventh most
significant life events. Travelling for leisure is associated
with happiness, and we typically learn more when we
travel. However, the way we live and spend our leisure
time impacts upon our environment, which in turn
affects us. Travel uses energy and can add to pollution
through greenhouse gas emissions.
Despite climate change being so high on the global
agenda, and such an important part of so much of our
recent education, research and learning, the UK government is currently cutting back most of the support that
had been put in place to enable green energy providers
to grow. 203 In just a couple of days in autumn 2015, two
solar energy firms went bust with the loss of 20,000
jobs because of a change in UK government policy. The
editorial of the Observer newspaper responded:
Just another in a long line of changes that have hit
energy efficiency, onshore wind, biomass and many
other sectors that create jobs and a lower-carbon
economy. These cuts looked particularly irresponsible
in the run-up to the UN climate change talks in Paris,
but at any time it is odd to see a party that wants to
make Britain greater showing little time for nurturing a
new business sector. 205
Our inability to respond well to climate change is a good
example of how we have not been learning.
A shift from long-distance travel to more local travel
would reduce the environmental cost – and there is
129
Both a paperback version and high-resolution and fully interactive ebook versions
of this book are available to buy direct from the publisher at http://bit.ly/1oGOx9m
148.
A BETTER POLITICSoften a lot to explore close to home. Our cities could be
so much better arranged to make travel within them,
and between them, easier and greener. We could spread
out our museums, galleries, concert halls and exhibition
spaces so much better across the country. Almost all
major public arts spending in the UK is concentrated
in London. We need to learn both how to travel better
and to consume less. In more economically equitable
countries public transport tends to be of higher quality,
fewer people drive (why do we in the UK love cars so
much?) and housing is more often located close to the
industry and services where people work. In these countries neighbourhoods are more socially mixed and social
mixing is easier because the economic gaps between
rich and poor are narrower.
It seems that buying a car does make people happy.
Men buy more cars than women do and drive cars more
often, especially at older ages. Why does the purchase
of a car make men in the UK happier? And how do British
men compare with those in Japan, where a car is only
a necessity in rural areas, or in the Netherlands, where
over half the population walk or cycle to work? Have we
in the UK really learned a great deal if we still value car
ownership so highly?
It is not just that car ownership is valued too highly in
the UK, or that an overly competitive education system
makes us all less smart, or that our job market gives such
high rewards to those at the top compared with those at
130
This low-resolution PDF is licensed under a Creative Commons License and
may be passed on electronically for free. It must not be copied for sale.
149.
Educationthe bottom, or that the accumulation of wealth is valued
so greatly over the accumulation of belonging, loving
and caring. We need to learn to value the environment
we live in better, to value travel that inspires us over
travelling fast. We need to learn to pollute less, teach
children in better ways and examine them less. We have
great expectations of our children. We hope that they
will see things more clearly than we have and act better
than we have; but previous generations have suddenly
seen things much more clearly than before and acted
on that insight. It is not impossible to see great change
within just a single generation. As one long-dead economist once said, in his hopes for a future after capitalism:
The love of money as a possession … will be recognised
for what it is, a somewhat disgusting morbidity, one of
those semi-criminal, semi-pathological propensities,
which one hands over with a shudder to specialists in
mental disease. 206
John Maynard Keynes, who died in 1946, also forecast that by 2030, a hundred years from when he was
writing, our lives would be more leisure-filled, and we
would be working on average only fifteen hours a week
in paid work. 207 He forecast that we would all be happier.
Yet many people in Britain now cannot afford an annual
holiday. This includes almost half of all families with
children. 208
131
Both a paperback version and high-resolution and fully interactive ebook versions
of this book are available to buy direct from the publisher at http://bit.ly/1oGOx9m
150.
Chapter 7Conclusion
Insecurity has become pervasive. It permeates the lives
not just of the marginalised but also the reasonably well
off. Our lives feel beyond our control.
— Ruth Lister and Neil Lawson209
L
ooking at how we govern ourselves from the
perspective of what most matters to us, things
appear in a very different light. It is not possible to give
everyone a large financial windfall, but we can all be
happier.
The government that came to power in 2010 in the
UK chose to try to spend a lower proportion of GDP on
the public good than almost any other government in
Europe, and was even forecast to spend less than the US.
It did not manage to do that, because debt repayments
were too high. But its successor government elected in
2015 aims to get close to being that internationally minimal public provider by 2020.
Figure 2 illustrates just how wide is the range of
choices that affluent countries make in terms of public
This low-resolution PDF is licensed under a Creative Commons License and
may be passed on electronically for free. It must not be copied for sale.
151.
Conclusion65
60
55
50
Finland
57
Denmark
France
Sweden
Italy
54
51
49
48
47
Greece
45
40
US
35
25
Ireland
Japan
43
41
40
36 [UK]
35
32
2002
2003
2004
2005
2006
2007
2008
2009
2010
2011
2012
2013
2014
2015
2016
2017
2018
2019
2020
30
Germany
Norway
UK
Figure 2. State spending as a proportion of GDP for twelve rich
countries (2002–20).
Source: the 2010, 2012 and 2015 IMF databases, with projections after 2014.
spending levels, and that range is set to become wider
still by 2020. Some countries choose to tax and spend
more collectively rather than individually. These tend
to be the more economically equitable countries, such
as Finland, France and Denmark. In contrast, the more
unequal English-speaking countries, including Ireland
and the US, stand out as being (or becoming) the lowest
taxers and spenders.
The graph is based on data from October 2015.
According to these World Economic Outlook figures,
133
Both a paperback version and high-resolution and fully interactive ebook versions
of this book are available to buy direct from the publisher at http://bit.ly/1oGOx9m
152.
A BETTER POLITICSproduced annually by the IMF, Finland is projected to
spend 57% of GDP on public services in 2020; France 54%;
Denmark, Belgium and Austria will spend 51%; Sweden
will spend 49%; Italy 48%; Portugal and Norway 47%; Germany 43%; the Netherlands 42%; Greece 41%; Japan 40%;
and Canada and Spain each 39%. The latter two countries
(not all are included in the graph as too many lines in the
middle would then overlap) also spend more than the
UK, or will do from 2016 onwards given planned cuts.
After which UK public spending will be just 36% of GDP.
There is no guarantee that public spending is well
directed. A great deal of public money is spent on arms,
on inefficient officials and on vanity projects; but private
spending can be at least as inefficient and vain – even
dangerous. Vanity private projects can include purchasing second or third homes. In 1899 the economist Thorstein Veblen first identified the rise in vanity purchases
among the rich, which only abated decades later. He
called the new trend ‘conspicuous consumption’: spending to impress others. 210
As I write (in February 2016) our government still aims
to get spending down to 36% of GDP; a post-war and European low. What figure 2 demonstrates is that the UK is
not a high-taxing, high-public-spending nation, although
there is ample conspicuous private consumption.
The essence of the argument of this book is: do
what will make most people happier and take more
care to avoid causing harm. I am impressed by facts
134
This low-resolution PDF is licensed under a Creative Commons License and
may be passed on electronically for free. It must not be copied for sale.
153.
Conclusionand figures. For example, instead of just 11% of working
people being paid under the living wage (as one former
MP recently incorrectly suggested was the case 211), it
turns out that by 2014 some 23% of all those people who
were working outside London were paid so little; a proportion rising from 21% two years earlier. This is despite
over 200 large firms having recently agreed to pay the
living wage, including Barclays, RBS, Lidl and Ikea. Even
with these recent commitments, huge numbers of UK
workers are still paid less than £7.85 an hour – more
than two-fifths of everyone in work in West Somerset,
for example. 212 But there is at least some good news in
that more and more people are actually being paid at
this level.
More and more employers are being won round to
believing that paying the living wage is the right action
to take, and something they can do that is of worth. The
social benefits of decent pay are significant, from reducing money worries to increasing local spending. Try to
imagine how many more large companies could and will
commit to paying the real living wage soon. When will
the first major hotel chain commit to it and become the
brand of choice, especially for anyone spending public
money on a hotel?
What follows are a few more ideas for practical steps
that could be taken in the next few years.
We clearly need a reappraisal of our tax system. Far
greater sums of money are raised by taxation in countries
135
Both a paperback version and high-resolution and fully interactive ebook versions
of this book are available to buy direct from the publisher at http://bit.ly/1oGOx9m
154.
A BETTER POLITICSwhere tax is made fairer, the rich are less exempt and
the income distribution is less dramatically skewed. 213
Housing was discussed in chapter 3, and one conclusion to draw from the housing crisis is that we need
to move towards taxing property wealth on an annual
basis, which would require a reform of council tax. Such
a move would allow both the abolition of income tax
for the very low paid (‘making work pay’) and the introduction of a basic income for all (discussed in chapter 5),
albeit initially at a very low level. This is a radical step
that would require a change in our wider understanding
of what is needed for an economy to work well. Higher
wealth and, especially, property taxation would have
the effect of damping down the housing market, but
it would put more money into the real economy. An
economy that was better balanced would raise employment in meaningful work. Wouldn’t it be a good thing
if fewer people worked as prison guards supervising a
large section of the population (discussed in chapter 4),
or as bankers sending money round in circles within the
financial casino?
A green community energy revolution needs to be
instigated, literally giving power to the people. This is
already happening elsewhere in Europe, in towns like
Freiberg, where trams are powered by electricity largely
generated by local wind and solar sources, where so
many people cycle and walk. 214 Getting there required
a mixture of incentives, intervention, changes in the
136
This low-resolution PDF is licensed under a Creative Commons License and
may be passed on electronically for free. It must not be copied for sale.
155.
Conclusionpower of retail energy providers, changes in the planning process and pump priming. There are many nearby
examples to study – if we wish to look.
We also need to concentrate on our immediate
problems more, such as housing. Very few of us are
actually homeless, but what of future generations?
A building programme is needed. We could use the
existing legislation that gave us the new towns of the
1960s and 1970s, but this time at least 250,000 (prefer
ably carbon-neutral) homes need to be constructed over
a four-year period, with integrated energy generation,
public transport infrastructure, and possibly even food
production. Along with new homes, built by councils
or democratically constituted housing associations, we
need new community structures, community buildings,
public transport infrastructure, and workplaces. With
fairer property taxation the uplift in the value of the land
could be harnessed to make new building self-financing.
The state is needed to ensure that any development is
coordinated. Only the state – us, working collectively –
can see the wider picture.
But what about the personal picture, such as issues
concerning savings, which I first mentioned in chapter 3?
Regional mutual banks for local people to save in and
bank with, and for small local businesses to borrow
from, could be encouraged. This would be possible if
government had the courage to begin to reduce its
underwriting of the largest four banks and to increase
137
Both a paperback version and high-resolution and fully interactive ebook versions
of this book are available to buy direct from the publisher at http://bit.ly/1oGOx9m
156.
A BETTER POLITICSits underwriting of regional mutual banks. These
regional institutions could also be encouraged to invest
in high-tech low-carbon manufacturing in return for the
government underwriting them. 215
Of course there are some who think that all this talk
of how much better things could be is fanciful. They
think most people are fundamentally selfish, and that
such selfishness can be tempered only a little. 216 In his
book How to Be a Conservative, Roger Scruton uses the
word ‘truth’ in eight of his chapter titles, so convinced is
he that he knows what it is. 217 None of us can know for
sure what proportion of what we suggest will turn out
to be misguided and where we might have hit the nail
on the head. That is often only apparent in retrospect.
138
This low-resolution PDF is licensed under a Creative Commons License and
may be passed on electronically for free. It must not be copied for sale.
157.
ConclusionBut all of us can hope and dream and act and advocate.
We can all look beyond our own shores to see if other
people have made a better go of it than we have. We
also need to be more suspicious of the motives of multi
national corporations. 218
We can also imagine children being automatically
protected from poverty and debt by adequate universal child benefit and being given free care, and
education from early childhood through to the end of
university. This could be paid for by cuts elsewhere, and
higher taxes, as is normal in the rest of Europe. Figure 2
showed how most affluent countries choose to tax
and spend far more than we do, but it does not show
that often they also spend that money better than we
do in almost all areas other than healthcare. Our public health spending is still more efficient than in most
other affluent countries, although its effectiveness is
under threat.
Of the twelve affluent nations compared in figure 2,
the UK is one of the very lowest in spending on health.
Only Greece and Italy spend (slightly) less per person
when private and state health spending are combined.
Elsewhere in Europe health spending per person was
twice as much in Switzerland as in the UK in 2013, and it
was 81% higher in Norway, 59% higher in the Netherlands,
49% higher in Germany, 41% higher in Denmark, and 27%
higher in France. 219 The UK commits less money per head
than any comparable country to healthcare. People are
139
Both a paperback version and high-resolution and fully interactive ebook versions
of this book are available to buy direct from the publisher at http://bit.ly/1oGOx9m
158.
A BETTER POLITICSbeginning to notice this and ask why we can’t have a
better NHS.
So how do we change things before it is too late?
Vote; but before you can vote you have to be registered to vote. By mid 2015 it became clear that 1.9 million
people who had been on the UK electoral roll under the
old method of registering households were no longer
listed. The old method allowed any person in a household to register everyone else living there. Many of the
140
This low-resolution PDF is licensed under a Creative Commons License and
may be passed on electronically for free. It must not be copied for sale.
159.
Conclusionunregistered are very young adults. The number of
unregistered voters is growing rapidly as private renting
grows. 220 London alone will lose between six and eight
constituencies in any redrawing of political boundaries
as a result of that drop in registered voters. 221
The referendum on independence in Scotland showed
how many people, including sixteen- and seventeenyear-olds, would vote when presented with something
they were passionate about. In the US, where huge numbers of people are imprisoned and unable to vote, recent
research has shown that simply providing former prisoners with a small amount of information can increase by a
huge proportion the likelihood of them both registering
to vote and voting. 222 A third of the electorate did not
vote in the May 2015 general election, and only a quarter
of the UK electorate voted for the Conservative party
that won. In 2005 it had been even worse, when just 20%
of the electorate voted for the Labour Party and yet the
party still won a majority of seats. No other rich country
has an electoral system that can deliver such undemocratic results. We need a proportional voting system for
Westminster elections, but the UK’s two largest political
parties have been opposed to fair votes when they have
held power.
Until we get fairer votes we need to understand electoral geography and how informal political pacts work. In
2015 in the Sheffield Hallam constituency, the Conservative party hardly campaigned at all, giving their potential
141
Both a paperback version and high-resolution and fully interactive ebook versions
of this book are available to buy direct from the publisher at http://bit.ly/1oGOx9m
160.
A BETTER POLITICSvoters the message they should vote for Nick Clegg,
then leader of the Liberal Democrats. They did not want
Labour to win the seat if their voters voted Conservative.
Clegg held his seat. At the same time, Labour won the City
of Chester seat from the Conservatives when the Greens
chose not to put up a candidate due to local concerns
over fracking, of which the Conservatives were in favour.
Labour won Chester with a majority of 93 – the smallest
majority in the country, after three recounts.223
No tactical voting shenanigans will be necessary
when the ‘Westminster’ UK parliament eventually
142
This low-resolution PDF is licensed under a Creative Commons License and
may be passed on electronically for free. It must not be copied for sale.
161.
Conclusionhas a fair voting system of the kind that is usual in the
rest of the world, in European elections in the UK, and
already in London, Scotland, Wales and Northern Ireland. Think a little further ahead and it is even possible
to imagine the UK parliament not being in Westminster. When the Palace of Westminster has to undergo
its ten-year renovation programme we could put
parliament just to the east of Birmingham, where the
two planned high-speed rail lines from the North East
and North West are due to converge before heading
to London. 224
Something very new is happening in politics in the
UK. It began in Scotland with the very close-run referendum result of 2014, and it is now reaching into England,
where no one predicted Jeremy Corbyn would win so
much support and be elected Labour leader in 2015 or
that his party would win so many votes in the Oldham
by-election later that year. It began earlier elsewhere
in Europe when Green parties emerged as significant
forces. It began on the streets of cities in the US in the
form of new protests against the power of the 1% after
evictions and bankruptcies rose so steeply following the
2008 crash. There is a new progressive politics growing
worldwide, a yearning for greater equality and more
stability.
However, at the same time, the populism of the
far right has also risen again, as illustrated by the Tea
Party in the US and the popularity of Donald Trump as
143
Both a paperback version and high-resolution and fully interactive ebook versions
of this book are available to buy direct from the publisher at http://bit.ly/1oGOx9m
162.
A BETTER POLITICSthe potential US Republican presidential candidate in
early 2016, by the rising popularity of close-to-fascist
parties in France, Italy and in many smaller European
states, and by the rise of UKIP in England. All these
trends are also responses to rising economic inequalities, with the blame so often put on new poorer arrivals rather than on those who already take so much of
the cake.
The message of both recent trends – the progressivism that appears in so many new forms, and the
alarming populism of the right – is that many people in
many countries no longer want to accept things as they
are. The change that is needed is not just the message
of those who would like a kinder politics. Government
can make us happier. 225 But only we can create the government that will do that. And if we make the wrong
choices, the implications are far-reaching.
When people look back on their lives, they often
wish they had done things differently. They wish they
had not had to amass such debts, especially in paying
for education. They wish one particular relationship
had not ended, or that they had been with someone
else. They wish they had become a parent. They wish
they had said goodbye to their loved ones properly
before they died. And they wish that they had not had
to worry so much through so much of their life about
so many issues that they later realized were quite
trivial. 226
144
This low-resolution PDF is licensed under a Creative Commons License and
may be passed on electronically for free. It must not be copied for sale.
163.
ConclusionYou have just finished reading a book with a list of
concrete problems that need solving, ones that really
matter to most people in the UK; a book that contains
some initial suggestions as to how we might begin to
start solving those problems. You need not be young to
avoid regret, but if you are young you have more time
and, perhaps, a greater incentive. If a better politics were
in the direct and obvious interest of the old, wealthy and
powerful, it would already exist.
145
Both a paperback version and high-resolution and fully interactive ebook versions
of this book are available to buy direct from the publisher at http://bit.ly/1oGOx9m
164.
AfterwordT
his book is based on a few ideas that began with the
findings of one academic paper published a decade
ago, using data from a decade before that. Those findings are being extrapolated forwards, and I have thrown
in many ideas that are buzzing around academia, in
books and articles, and reported in newspapers, magazines and elsewhere on the Internet. In all cases I try to
give the most accessible source – one that is not hidden
behind a paywall – in the endnotes below. Most are not
polished ideas and will need rethinking before coming
to fruition. Inevitably, some will turn out to be stupid.
What is certain is that there is no shortage of ideas and
choices. 227
But before we adopt any ideas, we can all benefit
from stepping back and asking what matters most –
and why we appear to have forgotten to do this more
in the countries, like the UK and the US, that are the
most unequal. Then, and only then, can we ask what we
should do about it. We know we need a better politics
for a happier and healthier future. And we know that no
one else will make that politics but us.
This low-resolution PDF is licensed under a Creative Commons License and
may be passed on electronically for free. It must not be copied for sale.
165.
AppendixT
his appendix provides more information on the ways
in which the responses to the open-ended British
Household Panel Survey (BHPS) question asking people
to state in their own words ‘what has happened to you
(or your family) which has stood out as important’ were
coded in the BHPS.
Answers were recorded verbatim, but verbatim
responses were not made available for public release
because of confidentiality concerns. However, the following numeric codes were developed to capture the
full range of events.
Health: 01 ill health/concern about health; 02 hospitalization/operation; 03 accident (involving injury); 04 health tests (positive and
negative); 05 loss of mobility/house-bound; 06 recovery/continuing
good health; 09 health (not elsewhere classified (NEC)).
Caring: 10 caring responsibilities – not childcare (who is cared for?*);
11 babysitting (who is the sitter?*).
Education: 12 starting/in school; 13 leaving school; 14 starting/in
further education (including sixth form); 15 leaving further education; 16 studying for/passing educational/vocational qualifications/acquiring skills/training (NEC); 17 travel related to study; 19
education (NEC).
Both a paperback version and high-resolution and fully interactive ebook versions
of this book are available to buy direct from the publisher at http://bit.ly/1oGOx9m
166.
A BETTER POLITICSEmployment: 20 change of job (including hours, status)/starting
own business; 21 planned/possible change of job; 22 getting job
(following economic inactivity); 23 work-related training (including
apprenticeship/heavy goods vehicle licence/work experience); 24
redundancy/unemployment (threat of or actual); 25 retirement; 26
travel related to work (who travels?*); 27 work-related problems; 29
jobs/careers (NEC).
Leisure/political: 30 vacation/travel (NEC); 31 leisure activities; 32
learning to drive/passing test (not heavy goods vehicle); 33 political
participation/voluntary work (including committee work); 34 reference to national/world events (who is concerned by event?*).
Non-familial relationships: 35 began friendship (including girl/
boyfriend); 36 end friendship (including girl/boyfriend); 37 spending time with/visiting friends (coded as holiday as appropriate); 38
problems with neighbours (who has the problem?*); 39 non-family
relationship (NEC).
Family events: 40 pregnancy/birth (identity of parent?*); 41 cohabitation; 42 engagements/weddings; 43 separation/divorce/end of
cohabitation; 44 leaving parental home; 45 death (who died?*);
46 wedding anniversaries; 47 birthday celebrations; 48 becoming
godparent; 50 spending time/visits with relatives (not within household); 51 day-to-day family life; 52 family problems (person causing
problems?*); 53 domestic incident (e.g. fire/burst pipes, etc.); 54
pets/animals (pet coded); 59 family event/family reference (NEC).
Financial matters: 60 money problems/drop in income/debt; 61
forced move (repossession/eviction) (move into residential home
not included); 62 improved financial situation; 63 received money
(inheritance/compensation/pools); 69 financial other (NEC).
Consumption: 70 bought/buying vehicle (car, caravan, etc.); 71
bought/buying/building house; 72 household repairs/improvements/appliances; 73 won prize (not cash)/award; 74 received present (from whom?*); 79 other purchases (NEC).
Residential move: 80 moved in past year; 81 future intention to
move; 82 move into residential home (nursing/retirement, etc.); 83
move into respondent’s household (who is moving in?*).
148
This low-resolution PDF is licensed under a Creative Commons License and
may be passed on electronically for free. It must not be copied for sale.
167.
AppendixCrime: 90 victim of crime (burglary, etc.); 91 committed crime/in
trouble with police.
Religion: 92 joined/changed religion; 93 other religious reference
(not confirmation/baptism of children).
Other: 94 plan not fulfilled/something that didn’t happen (e.g. didn’t
have a holiday); 95 civil court action/battles with bureaucracy; 96
other occurrence (NEC) given low priority; 97 nothing happened.
* People’s answers to the BHPS event question included not only events
that happened to them personally but also events that happened to
other family members or friends. Each event has, therefore, been
assigned a subject code as follows: 00 not mentioned; 01 we/household; 02 self (explicit or inferred or no pronoun); 03 spouse/partner; 04
daughter(s); 05 son(s); 06 child(ren) (NEC); 07 son-/daughter-in-law; 08
mother; 09 father; 10 parents (both or not specified); 11 parent(s)-inlaw; 12 siblings (sister/brother); 13 sister-in-law/brother-in-law; 14 grandparent(s); 15 grandchild(ren); 16 other family members/family members
unspecified; 17 friend/colleague.
149
Both a paperback version and high-resolution and fully interactive ebook versions
of this book are available to buy direct from the publisher at http://bit.ly/1oGOx9m
168.
169.
Endnotes1. A century ago geographers were more concerned with war
than happiness. The geographical theory ‘Who rules East Europe
commands the Heartland; who rules the Heartland commands the
World-Island; who rules the World-Island commands the world’ advocated war and almost brought the world to the brink of a nuclear
Third World War: http://bit.ly/1uYytef.
2. A. Marr. 2015 (2nd edn). Head of State, p. 15. London: Fourth Estate.
3. D. Massey. 2015. Why the Corbyn leadership is still the best hope
for Labour. In Soundings 61 – Catch the Tide, editorial. London: Lawrence & Wishart. (See http://bit.ly/23SwkFR.)
4. See E. Weiner. 2009. The Geography of Bliss. New York: Twelve.
R. Wilkinson and K. Pickett. 2010. The Spirit Level: Why Equality Is Bet
ter for Everyone. London: Penguin. M. J. Sandel. 2013. What Money
Can’t Buy: The Moral Limits of Markets. New York: Farrar, Straus and
Giroux. E. Skidelsky and R. Skidelsky. 2013. How Much is Enough?
Money and the Good Life. London: Penguin.
5. This writer is a geographer, so this is a journey through happiness
that is more wide ranging than an economics lesson. See D. Ballas
and D. Dorling. 2013. The geography of happiness. In Oxford Hand
book of Happiness edited by S. A. David, I. Boniwell and A. Conley
Ayers, chapter 36, pp. 465–481. Oxford University Press. (See http://
bit.ly/1KlMmBF.)
6. M. Hiltzik (quoting Radcliff). 2013. How much are we willing to pay
for the pursuit of happiness? Los Angeles Times, 3 November (http://
lat.ms/1Klm2aQ).
7. The reason he is correct is explained in A. Barford, K. Pickett
and D. Dorling. 2010. Re-evaluating self-evaluation: a commentary
Both a paperback version and high-resolution and fully interactive ebook versions
of this book are available to buy direct from the publisher at http://bit.ly/1oGOx9m
170.
See View:Page Navigation to return to the last page you were readingEndnotes TO PAGES 5–9
on Jen, Jones, and Johnston (68:4, 2009). Social Science & Medicine
70:496–497. (See http://bit.ly/1Q7zWdc.)
8. D. Ballas, D. Dorling, T. Nakaya, H. Tunstall and K. Hanaoka. 2014.
Income inequalities in Japan and the UK: a comparative study of two
island economies. Journal of Social Policy and Society 13(1):103–117.
(See http://bit.ly/20C1dvU.)
9. A. J. Oswald. 1997. Happiness and economic performance. Work-
ing Paper (subsequently published in The Economic Journal). (See
http://bit.ly/1JTJBHH.)
10. A. Pettifor. 2006. The Coming First World Debt Crisis. London:
Palgrave Schol.
11. A. Nesvetailova. 2007. Fragile Finance: Debt, Speculation and Crisis
in the Age of Global Credit. London: Palgrave Macmillan.
12. A. Stutzer and B. S. Frey. 2012. Recent developments in the
economics of happiness: a selective overview. IZA Discussion Paper
7078, p. 12 (http://ftp.iza.org/dp7078.pdf).
13. J. F. Helliwell. 2014. Social norms, happiness, and the environ-
ment: closing the circle. Sustainability: Science, Practice, & Policy
10(1):1–7. (See http://bit.ly/1nOzMRl.)
14. G. O’Donnell and J. A. Oswald. 2015. National well-being policy
and a weighted approach to human feelings. Journal of Ecological
Economics, forthcoming. (Preprint available at http://bit.ly/1PDe4fu.)
15. United Nations. 2012. Resolution adopted by the General Assem-
bly on 28 June 2012, 66/281, International Day of Happiness (http://
bit.ly/1nOzOIO).
16. M. Fleurbaey and H. Schwandt. 2015. Do people seek to maxi-
mize their subjective well-being? CEP Discussion Paper 1391, LSE
(http://bit.ly/1JTyaQi).
17. Some 35,965 people answered the question in total. Some did
so each year. Not everyone completed the survey every year. Just
under 10,000 people were interviewed each year. See D. Ballas and
D. Dorling. 2007. Measuring the impact of major life events upon
happiness. International Journal of Epidemiology 36(6):1244–1252.
(See http://bit.ly/2036hqU.)
152
This low-resolution PDF is licensed under a Creative Commons License and
may be passed on electronically for free. It must not be copied for sale.
171.
See View:Page Navigation to return to the last page you were readingEndnotes TO PAGES 9–14
18. Staff Reporter. 2009. Adults forget three things a day, research
finds. The Telegraph, 23 July (http://bit.ly/1SiMOBJ).
19. Terrorism is not an event that features as one that people report
as having affected their lives, because it remains so rare. But if a
question is asked about terrorism, for instance in the 2004 presidential election in the United States, then that issue can feature as
‘among the most important issues determining their vote choice’.
I. H. Indridason. 2008. Does terrorism influence domestic politics?
Coalition formation and terrorist incidents. Journal of Peace Research
45:241–259 (see p. 245).
20. D. Dorling. 2015 (2nd edn). Injustice: Why Social Inequality Still
Persists. Bristol: Policy Press. (See figure 21 from this book, which is
available at http://bit.ly/1Q7A24t.)
21. R. Mitchell and F. Popham. 2008. Effect of exposure to natural
environment on health inequalities: an observational population
study. Lancet 372(9650):1655–1660. (See http://bit.ly/1OOHpA8.)
22. Geographers traditionally worry about such things, including
this one and a colleague recently: D. Dorling and C. Lee. 2016. Geog
raphy. London: Profile.
23. BBC. 2010. Plan to measure happiness ‘not woolly’ – Cameron.
BBC UK Politics, 25 November (http://bbc.in/1SapIix).
24. ONS. 2015. Measuring national well-being, domains and meas-
ures – September 2015. Report, ONS (http://bit.ly/1OOHtQe).
25. A. Bryson, J. Forth and L. Stokes. 2015. Happier workers can
lead to higher profits. LSE British Politics and Policy blog, 6 August
(http://bit.ly/23sD5hz).
26. D. Adams and M. Carwardine. 2009. Last Chance to ee. London:
Arrow.
27. He was trained in Greece where, as in many countries other than
the UK and US, economists are also given a wider understanding of
the history of economics. For that wider view see H.-J. Chang. 2014.
Economics: The User’s Guide: A Pelican Introduction. London: Pelican.
28. Note that we could have obscured the results even more. We
didn’t use an ‘ordered-probit model’, which some economists might
153
Both a paperback version and high-resolution and fully interactive ebook versions
of this book are available to buy direct from the publisher at http://bit.ly/1oGOx9m
172.
See View:Page Navigation to return to the last page you were readingEndnotes TO PAGES 14–26
have preferred, and we may have given too colloquial a description
of what the constant and coefficients might mean. We also don’t
explain that the reference category is ‘all other combinations of
subject and type of event’, but we didn’t need to. The paper was
obscure enough already. However, if you want to know more about
these issues, see A. J. Oswald. 2007. Human well-being and caus
ality in social epidemiology. International Journal of Epidemiology
36(6):1253–1254 (http://bit.ly/1OOHxPT).
29. A. H. Maslow. 1943. A theory of human motivation. Psychological
Review 50(4):370–396. (See http://bit.ly/Os2Fkt.)
30. D. Dorling. 2013 (2nd edn). The Population of the UK. London:
Sage. (See http://bit.ly/1LaE9LH.)
31. M. Blastland and D. Spiegelhalter. 2014. The Norm Chronicles:
Stories and Numbers about Danger. London: Profile.
32. D. Spiegelhalter. 2015. Sex by Numbers: What Statistics Can Tell Us
about Sexual Behaviour. London: Profile.
33. If you can’t wait for later, then for insights into why people
in some cultures are more likely to think they are better than
average and having a better time than average, see http://bit.ly/
1OOHyn5.
34. M. Shaw, R. Mitchell and D. Dorling. 2000. Time for a smoke:
one cigarette is equivalent to 11 minutes of life expectancy. British
Medical Journal 320:53. (See http://bit.ly/1KlMtgC.)
35. L. Donnelly. 2015. Alarm over sudden drop in female life expec-
tancy. The Telegraph, 6 April (http://bit.ly/1IFceTd).
36. Conflict of interest note: the author of this book is a member
of the Public Health England (PHE) 2015/2016 Mortality Surveillance
Steering Group.
37. D. Dorling. 2014. Why are the old dying before their time? How
austerity has affected mortality rates. New Statesman, 7 February.
(See http://bit.ly/1P0JVTR.)
38. A. Grice. 2014. Women bear 85% of burden after Coalition’s
tax and benefit tweaks. The Independent, 4 December (http://ind.
pn/1nxth5x).
154
This low-resolution PDF is licensed under a Creative Commons License and
may be passed on electronically for free. It must not be copied for sale.
173.
See View:Page Navigation to return to the last page you were readingEndnotes TO PAGES 28–30
39. E. J. Emanuel and L. L. Emanuel. 1998. The promise of a good
death. Lancet 351(Supplement 2):SII21–29 (http://bit.ly/1OYkxvI).
40. J. Lyons and A. Lines. 2013. Margaret Thatcher dead: she spent
nal weeks with devoted friends at bedside but not her own chilfi
dren. The Mirror, 25 September (http://bit.ly/1Ka8Ntg).
41. I. Wolfe. 2014. Why the UK has a high child death rate. BBC News,
3 May (http://bbc.in/1kElUTo).
42. D. Foster. 2015. Can family support reduce Northern Ireland’s high
infant death rates? The Guardian, 25 March (http://bit.ly/1EFNfvz).
43. Around half of the 28% is taken just by the best-off 1% in the UK.
The UK also has the highest Gini coefficient of income inequality in
Europe (0.351): OECD. 2015. In it together – why less inequality benefits all. Report, OECD. (See http://bit.ly/1AmZl0V and particularly
chapter 1, Table 1.A1.1: ‘Key indicators on the distribution of household disposable income and poverty, 2007, 2011 and 2013 or most
recent’ (http://bit.ly/1SYWYI6).)
44. A. Offer. 2006. The Challenge of Affluence: Self-Control and Well-Be
ing in the United States and Britain Since 1950. Oxford University Press.
45. P. Tambe, H. M. Sammons and I. Choonara. 2015. Why do young
children die in the UK? A comparison with Sweden. Archives of Dis
ease in Childhood, 13 August, doi:10.1136/archdischild-2014-308059
(http://bit.ly/1JE4Pt2).
46. Pedestrian Safety. 2015. European comparisons of child pedes-
trian safety: WHO data on deaths in 2010–2012 per 100,000 children
(http://bit.ly/1Tnak1g).
47. The Equality Trust. 2015. Mental health: people in more equal
s ocieties are far less likely to experience mental illness. Report, Equality Trust (http://bit.ly/1LaEvSv).
48. This is partly because gun crime includes the malicious use of
air rifles: D. Dorling. 2011. Unique Britain. Open Democracy website
article, 15 May (http://bit.ly/1SJvFm4).
49. B. McPartland. 2013. Why France has such a high rate of sui-
cides. The Local (Paris correspondent), 10 September (http://bit.ly/
1ZSiCOH).
155
Both a paperback version and high-resolution and fully interactive ebook versions
of this book are available to buy direct from the publisher at http://bit.ly/1oGOx9m
174.
See View:Page Navigation to return to the last page you were readingEndnotes TO PAGES 31–34
50. Strictly speaking these proportions are for England and Wales,
but the UK will be similar, possibly slightly higher in more recent
years over that larger geographical extent. See ONS. 2013. What are
the top causes of death by age and gender? Statistical Release, 22
October (http://bit.ly/1Gqt1w0).
51. Staff Reporter. 2010. The U-bend of life: why, beyond middle age,
people get happier as they get older. The Economist, 16 December
(http://econ.st/1t3wD10). Note that this is a global average: it varies
by country and far more by individual, although being 48 as I write,
it is comforting to think that the most probable way from here on
through is up.
52. EMCDDA. 2011. Annual report 2011. The state of the drugs prob-
lem in Europe: drug-related infectious diseases and drug-related
deaths. European Monitoring Centre for Drugs and Drug Addition,
15 November (http://bit.ly/1VqCXsZ).
53. ONS. 2015. Deaths related to drug poisoning in England and
Wales, 2014 registrations. Statistical Bulletin, 3 September (http://
bit.ly/1PACm3i).
54. DoH. 2015. Department of Health spokeswoman quoted in ‘Drug
deaths in England and Wales reach record levels’. BBC News, 3 September (http://bbc.in/1PJRLTs).
55. A. Allegretti. 2015. David Cameron slams his own cuts in bitterly
ironic letter to Oxford Council. Huffington Post, 11 November (http://
huff.to/1Nt0ZOO).
56. J. Whitelegg and G. Haq. 2006. Vision zero: adopting a target of
zero for road traffic fatalities and serious injuries. Stockholm Environment Institute (http://bit.ly/1I81tdG).
57. D. C. Richard. 2010. Relationship between speed, risk and fatal
injury: pedestrians and car occupants. Report, Department for
Transport, p. 14 (http://bit.ly/1NzTvZG).
58. J. Whitelegg. 2015. What would Vision Zero Britain look like?
Vision Zero London (http://bit.ly/1RN1WbK).
59. D. Dorling. 2015. Creating a more equal society will require
understanding and generosity, hope, perseverance, but above all
156
This low-resolution PDF is licensed under a Creative Commons License and
may be passed on electronically for free. It must not be copied for sale.
175.
See View:Page Navigation to return to the last page you were readingEndnotes TO PAGES 34–39
kindness. Democratic Audit blog, LSE, 18 December (http://bit.
ly/1U9Im75).
60. I am a patron of the charity RoadPeace, so I am not a neutral
bystander on road deaths: http://www.roadpeace.org/.
61. D. Campbell. 2015. NHS workplace stress could push 80% of sen-
ior doctors to early retirement. The Guardian, 10 September (http://
bit.ly/1F0OfkB).
62. A. Gregory. 2015. Britain’s healthcare lagging behind the rest of
the world. The Mirror, 4 November (http://bit.ly/1VqD87H).
63. M. Silver. 2015. The increasing death toll due to the loss of bene-
fits. Vox Political, 13 September (http://bit.ly/1OYl94J).
64. R. Barr, D. Taylor-Robinson, D. Stuckler, R. Loopstra, A. Reeves
and M. Whitehead. 2015. ‘First, do no harm’: are disability assessments associated with adverse trends in mental health? A longitudinal ecological study. Journal of Epidemiology Community Health,
doi:10.1136/jech-2015-206209.
65. J. Kirby. 2015. ‘Fit to work’ policy linked to suicides. Western Daily
Press, 16 November (http://bit.ly/1UpH4FF).
66. Dr Lynne Friedli, who co-authored the paper making this assess-
ment (reference 67 below) had a few years earlier, in 2009, authored
the World Health Organisation report on mental health, resilience
and inequality. (See http://bit.ly/1NzTBAF.)
67. L. Friedli and R. Stearn. 2015. Positive affect as coercive strat-
egy: conditionality, activation and the role of psychology in UK
government workfare programmes. Critical Medical Humanities
41:40–47 (reference 86: doi:10.1136/medhum-2014-010622) (http://
bit.ly/1MB9KrD).
68. OECD. 2015. Focus on health spending: OECD health statistics
2015. Report, OECD. (Data extracted in December: http://bit.ly/
1qtVKpJ.)
69. A colleague who grew up in Eastern Europe told me recently
that it was shocking to see television documentaries on how the
administration ‘thinks’ and ‘works’ here in Britain. Our administration is designed in a way to have regulations, rules and norms
157
Both a paperback version and high-resolution and fully interactive ebook versions
of this book are available to buy direct from the publisher at http://bit.ly/1oGOx9m
176.
See View:Page Navigation to return to the last page you were readingEndnotes TO PAGES 39–43
that ‘distance’ (in a very polite manner) the administrator from
the person in his/her care, so they can send them away at the end
of a meeting/consultation and then turn to the camera and ask
the reporter: ‘Have you seen how unreasonably they behaved?’
One case my colleague had in mind was of a woman with three
children who all ended up on the streets and were not helped
in any way for months because they weren’t able to produce
some stupid piece of paper that, according to the rulebook, was
requested of them if they wanted to be housed. And then as the
film went on it became clearer and clearer that the council had
no resources to house these families, so they quickly invented a
set of new criteria and sorted people based on these formal criteria. They could then tell them (and the television documentary
viewer) that it was people’s fault they were not helped because
they did not want to ‘cooperate’. The aim of the documentary
was to try to show how ‘unreasonable’ and ‘uncivilized’ these
poor people were.
70. M. Adler. 2015. Benefit sanctions and the rule of law. Paper pre-
sented at the Annual Conference of the Law Society of Scotland,
Edinburgh International Conference Centre, 2 October. (See http://
bit.ly/1Tx6zGz.)
71. The Fawcett Society. 2015. Where’s the benefit? An independent
inquiry into women and Jobseeker’s Allowance. Report, Fawcett
Society, 6 February (http://bit.ly/1lRbSD6).
72. John retired in April 2014, but he continues to work in health as
an honorary professor of public health (http://bit.ly/1pylm1r).
73. J. Middleton. 2015. Why is there acute hunger in the UK and what
is to be done about it? British Medical Journal blog, 19 November
(http://bit.ly/20s6JAY).
74. N. Stotesbury and D. Dorling. 2015. Understanding income
inequality and its implications: why better statistics are needed.
Statistics Views, 21 October. (See http://bit.ly/20BOEkd.)
75. J. Warner. 2015. Paying all UK citizens £155 a week may be an
idea whose time has come. The Telegraph, 8 December (http://bit.
ly/1R5pbgN).
158
This low-resolution PDF is licensed under a Creative Commons License and
may be passed on electronically for free. It must not be copied for sale.
177.
See View:Page Navigation to return to the last page you were readingEndnotes TO PAGES 47–57
76. R. Ramesh. 2012. Two-child benefits policy targets the strivers in
low-paid jobs. The Guardian, 25 October (http://bit.ly/1PDfPt9).
77. A. Chakelian. 2015. Budget 2015: what welfare changes did
George Osborne announce, and what do they mean? New States
man, 8 July (http://bit.ly/1QrCh5t).
78. D. Dorling. 2015 (2nd edn). All that Is Solid: How the Great Housing
Disaster Defines Our Times, and What We Can Do About It. London:
Allen Lane. (See http://bit.ly/1P0K6i5.)
79. D. Dorling and B. Thomas. 2016 (forthcoming). People and Places:
A Twenty-First Century Census Atlas. Bristol: Policy Press.
80. D. Ballas, D. Dorling and B. D. Hennig. 2014. The Social Atlas of
Europe, p.41. Bristol: Policy Press (the updated version of this atlas
detailing the fall in numbers will be published at the end of 2016).
81. R. Sanghani. 2015. Maternity discrimination forcing thousands of
new UK mums out of work. The Telegraph, 24 July (http://bit.ly/1OBtM6j).
82. D. Dorling. 2015. Income inequality in the UK: comparisons with
five large Western European countries and the USA. Applied Geogra
phy 61:24–34. (See http://bit.ly/1KlMEbv.)
83. J. Hall. 2012. Average first-time buyer is now 35. The Telegraph, 11
September (http://bit.ly/1kRXBDn).
84. Figure 1 is a simplification of a more complicated diagram in
which cells are coloured darkest in the figure if more than 70% of
people in that year and of that age owned or had a mortgage. Cells
are coloured lightest if less than 50% did. It appears that home
ownership is becoming a thing of the past. The original diagram is
shown here: D. Dorling. 2015. Only one lucky generation ever struck
housing gold. The Telegraph, 27 April (http://bit.ly/1QFcjvS).
85. D. Dorling. 2015. Data on income inequality in Germany, France,
Italy, Spain, the UK, and comparisons to other affluent nations. Data
in Brief 5:458–460. (See http://bit.ly/1okse95.)
86. S. Ashton, M. Francis and M. Jarvie. 2015. Too poor to pay: the
impact of the second year of localized council tax support in London. Report, Child Poverty Action Group/Zacchaeus 2000 Trust, July
(http://bit.ly/1ha4qRO).
159
Both a paperback version and high-resolution and fully interactive ebook versions
of this book are available to buy direct from the publisher at http://bit.ly/1oGOx9m
178.
See View:Page Navigation to return to the last page you were readingEndnotes TO PAGES 57–65
87. New Policy Institute. 2015. London’s poverty profile 2015. Re-
port, Trust for London (http://bit.ly/1PFZTnQ).
88. K. Barker. 2014. Housing: Where’s the Plan? London Publishing
Partnership (http://bit.ly/1PACHTC).
89. P. Moskowitz. 2015. San Francisco’s deepening rent crisis pushes
out vulnerable teachers. The Guardian, 10 September (http://bit.
ly/1gcFxUt).
90. S. J. Smith. 2014. Japan shows the way to affordable megacities.
Next City, 22 January (http://bit.ly/1KEAPbh).
91. M. Fransham. 2015. Housing: rising prices, low sales, deteriorating affordability. Chart of the Month, Oxford City Council, 24 September (http://bit.ly/1QmyOT1).
92. S. Butler. 2015. Pace of rent rises quickens as average UK
rent reaches £937 a month. The Guardian, 24 August (http://bit.
ly/1NOSDTn).
93. H. Osborne. 2015. London house prices most overvalued in the
world, says UBS. The Guardian, 29 October (http://bit.ly/1M3u2Mb).
94. M. Taylor. 2015. ‘Vast social cleansing’ pushes tens of thousands
of families out of London. The Guardian, 28 August (http://bit.
ly/1PWQgiN).
95. T. Slater. 2015. Why we need rent controls. Living Rent Campaign
blog, 10 September (http://bit.ly/1RQSbtl).
96. ONS. 2015. Relationship between wealth, income and personal
well-being, July 2011 to June 2012. Report, Office for National Statistics (http://bit.ly/1lRcBEg).
97. P. Collinson. 2015. One in 65 UK adults now a millionaire. The
Guardian, 27 August (http://bit.ly/1MPz92u).
98. T. Carey. 2015. Why being an accidental millionaire doesn’t make
you feel rich: one in 65 people may now be millionaires, but as Tanith
Carey has discovered, the lifestyle’s not what it used to be... The
Telegraph, 27 August (http://bit.ly/1SJwcof).
99. J. Treanor. 2015. Half of world’s wealth now in hands of 1% of
population. The Guardian, 13 October (http://bit.ly/1MoQ0pb).
160
This low-resolution PDF is licensed under a Creative Commons License and
may be passed on electronically for free. It must not be copied for sale.
179.
See View:Page Navigation to return to the last page you were readingEndnotes TO PAGES 66 –75
100. Staff Reporter. 2015. If the world introduces a ‘Piketty tax’:
squeezing the rich. The Economist, 30 July (print edition; online at
http://bit.ly/1IPh3Mu).
101. C. Collins and J. Hoxie. 2015. Billionaire Bonanza: The Forbes
400 and the Rest of Us. Washington, DC: Institute for Policy Studies
(http://bit.ly/1O3EKoV).
102. E. N. Wolff. 2012. The asset price meltdown and the wealth of
the middle class. Occasional Paper, New York University, table 4,
p. 60 (http://bit.ly/204aL5K).
103. K. Allen. 2015. Evictions soar in England and Wales as benefit
cuts bite. Financial Times, 13 August (http://on.ft.com/1SaqZWK).
104. See Becky Tunstall’s graph (figure 13) at http://bit.ly/1QQbbVU.
105. N. Falk. 2014. Funding housing and local growth: how a British
investment bank can help. Report, Smith Institute, p. 13 (http://bit.
ly/1RN2qik).
106. Simon calls me a housing economist when he agrees with me
and a geographer when he does not, which I am not sure is a compliment. See S. Jenkins. 2015. Forget new homes, we aren’t making
use of what we already have. Evening Standard, 6 October (http://
bit.ly/1LyqwLn).
107. H. Haber. 2015. Regulation as social policy: home evictions and
repossessions in the UK and Sweden. Public Administration 93:806–821.
108. U. Huws. 2015. The road from Damascus. Blog post, 25 Septem-
ber (http://bit.ly/1VqE4c7).
109. D. Dorling. 2015 (2nd edn). Injustice: Why Social Inequality Still
Persists. Bristol: Policy Press. (See http://bit.ly/TF2Z1u.)
110. G. Wood. 2011. Secret fears of the super-rich. The Atlantic, April
(http://theatln.tc/1BXTHO2).
111. I. Graham. 2015. Countries compared by people: divorce rate.
International Statistics, Nation Master (http://bit.ly/1tf9Jlj; accessed
October).
112. K. Williams, V. Papadopoulou and N. Booth. 2012. Prisoners’
childhood and family backgrounds: results from the Surveying
161
Both a paperback version and high-resolution and fully interactive ebook versions
of this book are available to buy direct from the publisher at http://bit.ly/1oGOx9m
180.
See View:Page Navigation to return to the last page you were readingEndnotes TO PAGES 75–78
Prisoner Crime Reduction (SPCR) longitudinal cohort study of prisoners. Ministry of Justice Research Series 4/12 (http://bit.ly/1wKXPm9).
113. R. Garside. 2015. Better an ideologue than a barbarian: Michael
Gove is a refreshing change from his predecessor as Justice Secretary, but he should leave out the God-talk. Centre for Crime and
Justice Studies blog post, 9 October (http://bit.ly/1KaagQr).
114. Department for Education and Skills. 2003. Every child matters.
Stationery Office (most recently quoted in 2015: http://bit.ly/1QrCHbR).
115. People, including children, do tend to have more punitive and vin-
dictive attitudes in more unequal societies. This can result in odd and
highly publicized research findings with any international studies that
include the US in their sample, such as J. Decety, J. M. Cowell, K. Lee , R.
Mahasneh, S. Malcolm-Smith, B. Selcuk and X. Zhou. 2015. The negative
association between religiousness and children’s altruism across the
world. Current Biology 25(22):2951–2955 (http://bit.ly/1TnbF8n).
116. ‘Legislative and policy changes have contributed to more
stringent outcomes, making sentence lengths longer for certain offences and increasing the likelihood of imprisonment for breach of a
non-custodial sentence or failure to comply with licence conditions.’
Ministry of Justice. 2013. Story of the prison population: 1993–2012,
England and Wales, prison and probation statistics. Report, Ministry
of Justice, p. 21 (http://bit.ly/20s73zU).
117. Home Office. 2015. Hate crimes, England and Wales 2014 to 2015.
Government Statistical Service, 13 October (http://bit.ly/1MwzGHp).
118. On our fear of the poor see J. Unwin. 2013. Why Fight Poverty?
London Publishing Partnership (http://bit.ly/18EWxsT).
119. J. Bingham. 2015. Alan Yentob under fire for alarmist Kids Com-
pany claims. The Telegraph, 15 October (http://bit.ly/1G8fc6O).
120. D. Dorling and C. Lee. 2014. Inequality constitutes a particu-
lar place. In Riot, Unrest and Protest on the Global Stage, edited by
D. Pritchard and F. Pakes, chapter 7, pp. 115–131. Basingstoke: Palgrave Macmillan. (See http://bit.ly/1KSBPJ0.)
121. R. Garside. 2015. Prison building ‘short-sighted and contradic-
tory’. Report, Centre for Crime and ustice Studies, 9 November
(http://bit.ly/1nOB9Q1).
162
This low-resolution PDF is licensed under a Creative Commons License and
may be passed on electronically for free. It must not be copied for sale.
181.
See View:Page Navigation to return to the last page you were readingEndnotes TO PAGES 79–83
122. R. Roberts. 2015. Criminal justice ‘transformation’: a wolf in
sheep’s clothing? Report, Centre for Crime and ustice Studies, 15
October (http://bit.ly/1KAFP67).
123. Dorling (2015): see note 59.
124. M. Orton. 2015. Something’s not right: insecurity and an anx-
ious nation. Report, Compass (http://bit.ly/1UpHTOK).
125. Reducing our addiction to accountancy would be only a small
step towards becoming less anxious, but it could help. At any one
time we have 165,000 students registered for training to become
professional accountants, and a further 100,000 students studying
for a degree in accountancy – this is more than in medicine and many
other caring and healing subjects combined. It may appear strange
to jump from anxiety to accountancy, but it is an anxious country
that feels the need to employ so many people to check the books
over and over again.
126. P. Sikka. 2009. A nation of accountants. The Guardian, 13 June
(http://bit.ly/1KaasPK).
127. Just after the line: ‘They must feel the thrill of totting up a
balanced book, a thousand ciphers neatly in a row’. M. Poppins.
1964. A British Bank (The Life I Lead). Burbank, CA: Disney (http://bit.
ly/1KAFQXJ). ( he actual songwriters were R. M. Sherman and R. B.
Sherman.)
128. D. Madland. 2015. Hollowed Out: Why the Economy Doesn’t Work
without a Strong Middle Class, p. 47. Oakland, CA: University of California Press.
129. R. P. Formisano. 2015. Plutocracy in America. Baltimore, MD:
John Hopkins University Press.
130. Dorling and Thomas (2016): see note 79.
131. D. Ballas, D. Dorling and B. D. Hennig. 2016. The Human Atlas
of Europe: A Continent United in Diversity. Bristol: Policy Press
(forthcoming).
132. D. Dorling and C. Lee. 2016. Geography. London: Profile
(forthcoming).
133. Dorling (2015): see note 109.
163
Both a paperback version and high-resolution and fully interactive ebook versions
of this book are available to buy direct from the publisher at http://bit.ly/1oGOx9m
182.
See View:Page Navigation to return to the last page you were readingEndnotes TO PAGES 85–93
134. P. Mason. 2015. The end of capitalism has begun. The Guardian,
17 July (http://bit.ly/1GpQTKp).
135. From In Memoriam A. H. H., canto 27: ‘I envy not in any moods’
(http://bit.ly/1Q4TjJY). On the evidence, see: D. Dorling and M. Shaw.
2000. Life chances and lifestyles. In The Changing Geography of the
UK, edited by V. Gardiner and H. Matthews, chapter 12, pp. 230–260.
London: Routledge (http://bit.ly/1KlMQYs).
136. International Labour Organisation. 2015. Where is the unem-
ployment rate the highest. Global Employment Trends, provisional
data for 2015 (http://bit.ly/1wpVeMv).
137. M. Scott Cato. 2008. Green Economics: An Introduction to
Theory, Policy and Practice. London: Routledge.
138. M. Mazzucato. 2015. The Entrepreneurial State: Debunking Pub
lic vs. Private Sector Myths. New York: Public Affairs.
139. K. Raworth. 2012. A safe and just space for humanity. Oxfam
Discussion Paper, February (http://bit.ly/204beFb).
140. D. Dorling. 2013. Fairness and the changing fortunes of people
in Britain. Journal of the Royal Statistical Society A176(1):97–128
(http://bit.ly/1Q7B1l8).
141. D. Dorling. 2015 (2nd edn). Inequality and the 1%. London:
Verso. (See http://bit.ly/1KuXCtx.)
142. J. Hutchinson and T. Thornhill. 2015. Around 1,700 private jets
flying in to Davos … for World Economic Forum meeting to discuss
climate change and global warming. Daily Mail, 19 January (http://
dailym.ai/1CNbcl2).
143. A. Wooldridge. 2015. The sad, sick life of the business traveller.
The Economist, 17 August (http://econ.st/1JdF7o4).
144. Some are referenced in these endnotes, but a quick Internet
search will find you many more references to problems in the personal and professional lives of those at the top. The Internet makes
it harder to control the media and harder to hide.
145. R. Steiner. 2015. WPP faces shareholder anger as it awards boss
Sir Martin Sorrell with £43m pay package. Daily Mail, 30 April (http://
bit.ly/1QC0Kqu).
164
This low-resolution PDF is licensed under a Creative Commons License and
may be passed on electronically for free. It must not be copied for sale.
183.
See View:Page Navigation to return to the last page you were readingEndnotes TO PAGES 93–104
146. P. Sellers. 2015. Britain now most unequal EU country, says
official report. TUC Touchstone blog, 18 May (http://bit.ly/1FtI8Fg).
147. G. Hiscott. 2015. Morrisons may be hiking wages above the
living wage but there’s a sting in the tail. The Mirror, 29 September
(http://bit.ly/1OOJAUa).
148. C. Tavris and E. Aronson. 2013 (updated edn). Mistakes Were
Made (but Not by Me): Why We Justify Foolish Beliefs, Bad Decisions
and Hurtful Acts, p. 66. London: Pinter and Martin.
149. NAO. 2015. Short guides to government. National Audit Office,
(https://www.nao.org.uk/search/pi_area/short-guides/type/repo
rt/). (The reports for the year before are at https://www.nao.org.uk/
Collections/short-guides-to-departments/.)
150. NEF. 2015. Fairness commissions: understanding how local au-
thorities can have an impact on inequality and poverty. Report, New
Economics Foundation, p. 19 (http://bit.ly/1E3V195).
151. C. Pleasance. 2014. Sweden introduces a six-hour working day
in bid to reduce sick leave, boost efficiency and make staff happier.
Daily Mail, 9 April (http://dailym.ai/1qpQd0w).
152. A. Shaw. 2015. Fancy a six hour work day? New Zealand Herald,
8 October (http://bit.ly/1Tnc9vg).
153. S. Kumar. 2015. What the US could learn from Sweden’s 6-hour
work day. Fortune Magazine, 6 October (http://for.tn/1jNHxVA).
154. J. Ostroff. 2015. The Dutch city of Utrecht is doling out free
money for a ‘basic income’ experiment. Huffington Post, 7 October
(http://huff.to/1PS1XFB).
155. AFP. 2015. Finland to test unconditional basic income for Finns
in 2017. EurActiv (Agence France-Presse), 9 December(http://bit.
ly/1RB9wWM).
156. Mason (2015): see note 134.
157. P. Mason. 2015. PostCapitalism: A Guide to Our Future. London:
Allen Lane.
158. M. Allen. 2015. Hard Labour: Young People Moving into Work in
Difficult Times. London: Radicaled Books (http://bit.ly/1PS21Fc).
165
Both a paperback version and high-resolution and fully interactive ebook versions
of this book are available to buy direct from the publisher at http://bit.ly/1oGOx9m
184.
See View:Page Navigation to return to the last page you were readingEndnotes TO PAGES 104–111
159. R. Urie. 2015. Capitalism run amok: hungry kids, falling wages
and empty houses. Counterpunch, 18 September (http://bit.ly/
1LHXm6D).
160. In the US, ‘Conservative politics relies on the middle class mak-
ing a devil’s bargain, believing they have more in common with the
rich than the poor. It won’t be long before that facade crumbles.’
From S. McElwee. 2015. Welcome to feudalism, America: how the
1 percent is systematically destroying the middle class. Salon, 1 June
(http://bit.ly/1UpIjEH).
161. CPAG. 2015. Welfare reform and work bill 2015, issue 247, Au-
gust. Child Poverty Action Group (http://bit.ly/1SJwzza).
162. A. Garnham. 2015. When David Cameron became Tory leader,
he wanted to end child poverty. Now he just wants to stop measuring it. New Statesman, 7 December (http://bit.ly/20s7nOZ).
163. P. Johnson. 2015. Opening remarks, IFS post-spending review/
autumn statement analysis (26 November). Institute for Fiscal Studies (http://bit.ly/1XtfPdy).
164. C. Beatty and S. Fothergill. 2014. The impact of welfare reform
on communities and households in Sheffield. CRESR, Sheffield,
26 November (http://bit.ly/1RN30MX).
165. FRA. 2014. Violence against women: an EU-wide survey. FRA
– European Union Agency for Fundamental Rights, Luxembourg
(http://bit.ly/1BSvRbD).
166. S. Narotzky. 1997. New Directions in Economic Anthropology,
p. 114–157. London: Pluto.
167. Personal communications with Vivienne Hayes, Ila Chanda
varkar and Florence Rose Burton. 2015. Women’s Resource Centre
(http://thewomensresourcecentre.org.uk).
168. Some eleven women’s organizations came together in 2015 to
create a campaign asking politicians to do something about the gap
between men and women. Their details are on a resulting website
here: http://bit.ly/1JTJT1c.
169. C. Cohen. 2015. The government is planning to ‘drop feminism’
from the politics A-level. The Telegraph, 19 November (http://bit.ly/
1HZiWba).
166
This low-resolution PDF is licensed under a Creative Commons License and
may be passed on electronically for free. It must not be copied for sale.
185.
See View:Page Navigation to return to the last page you were readingEndnotes TO PAGES 111–119
170. The Fawcett Societ. 2015. Giving with one hand, taking away
with two – the 2015 Budget. Report, Fawcett Society, 8 July (http://
bit.ly/1MhgmLb).
171. On what is being asked for, see http://fairdealforwomen.com/.
172. D. Foster. 2016. Lean Out. London: Repeater Books (http://bit.
ly/1NzV21Z).
173. T. Eagleton. 2015. The slow death of the university. Chronicle of
Higher Education, 6 April (http://bit.ly/1NWu6wR).
174. Including those that suggest it would be good to know if it were
better to write ‘syllabi’ or ‘syllabuses’!
175. S. Tomlinson (personal correspondence, but drawing on De-
partment for Education 2015 figures). 2015. Permanent and fixed
period exclusions in England: 2013 to 2014. Department for Education, Statistical First Release, 30 July (http://bit.ly/1SbhO8g).
176. S. Scott, M. Knapp, J. Henderson and B. Maughan. 2001. Finan-
cial cost of social exclusion: follow up study of antisocial children into
adulthood. British Medical Journal 323:191–194 (http://bit.ly/1JE77IF).
177. T. Wrigley. 2015. A few anomalies? No, baseline is flawed from
start to finish. Reclaim Schools blog, 20 November (http://bit.ly/
1NkxR28).
178. The static is 4.4 times = (25/7) / (75/93). However, note that it
may be higher given extra private tutoring, pre-school fees and university attendance of this small group of students. The more recent
figures can be found on p. 93 of EU. 2012. Key data on education in
Europe 2012. Education, Audio-visual and Culture Executive Agency,
Brussels (http://bit.ly/1WNrK7e).
179. Stotesbury and Dorling (2015): see note 74.
180. K. Pickett and K. Vanderbloemen. 2015. Mind the gap: tackling
social and educational inequality. Cambridge Primary Review Trust
Report 4 (http://bit.ly/1PDhK0N).
181. Stotesbury and Dorling (2015): see note 74.
182. See N. Duffell. 2014. Wounded Leaders: British Elitism and the En
titlement Illusion – A Psychohistory. Lone Arrow Press. (Also see many
blog and other pieces on the web, including http://bit.ly/1nxuKZu.)
167
Both a paperback version and high-resolution and fully interactive ebook versions
of this book are available to buy direct from the publisher at http://bit.ly/1oGOx9m
186.
See View:Page Navigation to return to the last page you were readingEndnotes TO PAGES 120 –124
183. S. Tomlinson. 2015. Special education and minority ethnic
young people in England: continuing issues. Discourse: Studies in
the Cultural Politics of Education, p. 11 (http://bit.ly/1ZSkzdM) (summarizing the work of Roger Slee).
184. A. McSmith. 2015. How thousands fail the poshness test. Life
style Magazine, 15 June (http://bit.ly/1PDhPkU; sourced from The
Independent) .
185. L. Ashley, J. Duberley, H. Sommerlad and D. Scholarious. 2015.
A qualitative evaluation of non-educational barriers to the elite
professions. Report, Social Mobility and Child Poverty Commission,
London, June, final page of main report (http://bit.ly/1TnbgSD).
186. As reported by the Sutton Trust in a series of widely publicized
studies (www.suttontrust.com).
187. Team GB excels especially, but not exclusively, in ‘the sitting
down sports’ of riding and rowing.
188. M. Wayne and D. O’Neill. 2013. The gentrification of the left.
New Left Project, 19 August (http://bit.ly/1lReEs2).
189. S. Price. 2014. How my research into pop’s posh takeover was
hijacked. The Observer, 23 February (http://bit.ly/1jq24dI).
190. E. Gosden. 2015. The arts really are dominated by the middle class-
es, study shows. The Telegraph, 23 November (http://bit.ly/1kPDmcK).
191. O. Jones. 2013. Chavs: The Demonization of the Working Class.
London: Verso.
192. G. Cory and B. Davies. 2015. Following the tax credit row, the
welfare axe could fall on renters and disabled claimants. New States
man, 19 November (http://bit.ly/1LovkMK).
193. R. Brown. 2013. We build character as well. Oxford Times, 12
September (http://bit.ly/1nOBMcf).
194. HEFCE. 2015. Differences in degree outcomes: the effect of sub-
ject and student characteristics. Report, Higher Education Funding
Council for England (http://bit.ly/1UXhWEZ).
195. A. McKnight. 2015. Downward mobility, opportunity hoarding
and the ‘glass floor’. Research Report, Social Mobility and Child Poverty Commission, June (http://bit.ly/1KrinEI).
168
This low-resolution PDF is licensed under a Creative Commons License and
may be passed on electronically for free. It must not be copied for sale.
187.
See View:Page Navigation to return to the last page you were readingEndnotes TO PAGES 124–131
196. See the website of the Equality Trust: www.equalitytrust.org.uk/.
197. M. Savage, N. Cunningham, F. Devine, S. Friedman, D. Laurison,
L. McKenzie, A. Miles, H. Snee and P. Wakeling. 2015. Social Class in
the 21st Century. London: Pelican.
198. N. Hillman. 2015. Keeping up with the Germans? A comparison
of student funding, internationalisation and research in UK and
German universities. Higher Education Policy Institute Report 77,
Oxford (http://bit.ly/1PAE84F).
199. S. Coughlan. 2010. Majority of young women in university. BBC
News, 31 March (http://bbc.in/1QrDiui).
200. R. Brown. 2010. Higher Education and the Market, p. 12 of chap-
ter 13. London: Routledge.
201. A. Izaguirre. 2015. A tale of two chancellors: income inequality
between admins and adjuncts at CUNY. Kingsman Paper, 11 May.
202. A. Josuweit. 2015. Student debt is already a hallmark issue for
2016. Huffington Post, 4 November (http://huff.to/1WNrWTQ).
203. Climate change activists like to quote the thirteenth-century
Persian theologian and poet Rumi at this point: ‘Sit, be still, and listen / because you’re drunk / and we’re at / the edge of the roof.’
204. T. Macalister. 2015. Second solar firm in two days goes bust,
blaming UK government policy. The Guardian, 8 October (http://bit.
ly/1JUNyox).
205. Editorial. 2015. The Observer view on the Tory renewable
energy policy. The Observer, 11 October (http://bit.ly/1PAEcBe).
206. J. M. Keynes. 1931. Essays in Persuasion. London: Macmillan.
(‘Economic possibilities for our grandchildren’ (1930), section II:
http://bit.ly/1QQcYdw.)
207. Keynes: ‘Economic possibilities for our grandchildren’ (see im-
mediately above).
208. See the annual statistics produced in the ‘Household Below
Average Income’ statistical series on children living in families that
cannot afford a week’s holiday a year, not staying with relatives.
209. Foreword to M. Orton. 2015. Secure and free: 10 foundations for a
flourishing nation. Report, Compass, September (http://bit.ly/1JE7ByA).
169
Both a paperback version and high-resolution and fully interactive ebook versions
of this book are available to buy direct from the publisher at http://bit.ly/1oGOx9m
188.
See View:Page Navigation to return to the last page you were readingEndnotes TO PAGES 134–141
210. T. Veblen. 1899. The Theory of the Leisure Class: An Economic
Study of Institutions. New York: Macmillan (http://bit.ly/1Go9ADr).
211. D. MacShane. 2015. Are things really as bad as we think? Tribune,
9 October (http://bit.ly/1RN3uCI).
212. D. Bloom. 2015. Britain’s living wage blackspots revealed: find
pay packets in your area with our handy search tool. The Mirror,
12 October (http://bit.ly/1KECs8Z).
213. R. Murphy. 2015. The Joy of Tax. London: Bantam.
214. R. Gregory. 2011. Germany – Freiburg – Green City. Eco Tipping
Points blog, January (http://bit.ly/UbGe64).
215. Orton (2015): see note 209.
216. S. Brittan. 1995. Capitalism with a Human Face. Cheltenham:
Edward Elgar.
217. R. Scruton. 2014. How to Be a Conservative. London: A&C Black.
218. ‘We humans are the inconvenient gut-flora of the corporation.
They aren’t hostile to us. They aren’t sympathetic to us. Just as
every human carries a hundred times more non-human cells in her
gut than she has in the rest of her body, every corporation is made
up of many separate living creatures that it relies upon for its survival, but which are fundamentally interchangeable and disposable
for its purposes. Just as you view stray gut-flora that attacks you
as a pathogen and fight it off with antibiotics, corporations attack
their human adversaries with an impersonal viciousness that is all
the more terrifying for its lack of any emotional heat.’ This quote
comes from C. Doctorow. 2015. Skynet ascendant. Locus Magazine,
July (http://bit.ly/1R8mH1V).
219. OECD. 2015. Focus on health spending: OECD health statistics 2015.
Report, OECD, data extracted in December (http://bit.ly/1qtVKpJ).
220. D. Dorling. 2015. ‘Kinder politics’ is only possible if more of
those who’ll benefit can vote. The Independent, 1 October (http://
ind.pn/1R4NyMb).
221. R. Johnston, C. Pattie and D. Rossiter. 2015. Ensuring equal
representation in Parliament: who counts? LSE British Policy and
Politics blog, 20 July (http://bit.ly/1SJx2l0).
170
This low-resolution PDF is licensed under a Creative Commons License and
may be passed on electronically for free. It must not be copied for sale.
189.
See View:Page Navigation to return to the last page you were readingEndnotes TO PAGES 141–146
222. A. S. Gerber, G. A. Huber, M. Meredith, D. R. Biggers and D. J.
Hendry. 2015. Can incarcerated felons be (re)integrated into the
political system? Results from a field experiment. American Journal
of Political Science 59:912–926 (http://bit.ly/20jvZrd).
223. Sheila Ramsay, Chester Labour Party, personal communication,
October 2015.
224. D. Dorling and C. Mullin. 2015. Should parliament move out of
London? The Observer, 7 March (http://bit.ly/1Ew0f9D).
225. B. Headey, R. Muffels and G. G. Wagner. 2010. Long-running Ger-
man panel survey shows that personal and economic choices, not just
genes, matter for happiness. Proceedings of the National Academy of
Sciences of the USA 107(42):17922–17926 (http://bit.ly/1KabTh1).
226. R. Gillett. 2015. People weighed in on the most common regrets
in life, and some of their answers will make you cry. Business Insider,
29 November (http://bit.ly/1okvYYb).
227. It helps to look at a wide range of evidence. As Richard Easterlin
so succinctly explained almost twenty years ago: ‘it is good to be
an economist, it is better to be a social scientist’: R. A. Easterlin.
1997. The story of a reluctant economist. The American Economist.
(Revised draft, January 1997, p. 19, available at http://bit.ly/1SSX8BZ.)
Key papers authored by Danny Dorling
D. Dorling. 2010. All connected? Geographies of race, death, wealth,
votes and births. Geographical Journal 176(3):186–198 (http://bit.
ly/1mnfWLM).
D. Dorling. 2013. Crises and turning points: the turning points of
history. Renewal 21(4):11–20 (http://bit.ly/1T8hes4).
D. Dorling. 2014. How only some rich countries recently set out to
become more unequal. Sociologia, Problemas e Práticas 74:9–30
(http://bit.ly/1nXM8a6).
D. Dorling. 2015. The mother of underlying causes – economic
ranking and health inequality. Social Science & Medicine 128:327–330
(http://bit.ly/1PJUIDw).
171
Both a paperback version and high-resolution and fully interactive ebook versions
of this book are available to buy direct from the publisher at http://bit.ly/1oGOx9m
190.
PERSPECTIVESSeries editor: Diane Coyle
Jim O’Neill’s The BRIC Road to Growth (published 2013) calls for
an urgent overhaul of global economic governance to reflect
the reality of the economic power of the BRIC countries and
others, especially Korea. Even though their growth rates will
slow compared with recent decades, they are key players in
the global economy. Jim argues that while the BRIC countries
all have stabilizing adjustments to make, there is much for
the developed nations in the West to learn from them.
ISBN: 978-1-907994-13-5
Bridget Rosewell’s Reinventing London (published 2013) tells
the story of a city that has enjoyed an extraordinary period of
growth in the past generation, symbolized by the towers of
Canary Wharf built on the skeleton of the old docks. Finance
was at the heart of this, so how can London’s economy be
reinvented after the financial crisis? An early decision on airport investment to improve global links is a must, given that
the capital’s main airport is full to capacity.
ISBN: 978-1-907994-14-2
Andrew Sentance’s Rediscovering Growth: After the Crisis
(published 2013) discusses the difficult economic climate in
Europe and the US and predicts that it is set to continue
for many years, despite desperate efforts to stimulate
growth. The long phase of expansion in Western economies that lasted from the 1980s until 2008 was driven by
easy money, cheap imports and confidence – all gone.
ISBN: 978-1-907994-15-9
Julia Unwin’s Why Fight Poverty? (published 2013) looks
back at the struggle to end poverty and asks if it has been
worth it. What would a poverty-free country be like?
Julia concludes that we urgently need to resolve poverty,
because it is costly, wasteful and risky, but that we can only
create a strong, shared understanding of poverty and how
to end it when we recognize that ‘they’ are people like ‘us’.
ISBN: 978-1-907994-16-6
191.
David Birch’s Identity Is The New Money (published 2014)argues that identity is changing profoundly and that
money is changing equally profoundly. Because of technological change the two trends are converging so that all
that we need for transacting will be our identities captured
in the unique record of our online social contacts. Social
networks and mobile phones are the key technologies.
ISBN: 978-1-907994-12-8
Kate Barker’s Housing: Where’s the Plan? (published 2014)
argues that home ownership is out of reach of a growing
number of people. Government finds it easier to introduce
short-term policies that are not really effective, meaning that
the long-term issues are never really resolved. Reforms are
urgently needed. This book dispels some common myths, and
provides answers in the form of policy recommendations.
ISBN: 978-1-907994-11-1
David Fell’s Bad Habits, Hard Choices: Using the Tax System to
Make Us Healthier (published 2016) argues that the curious
mix of taxes and duties the British face are messy, opaque,
out of date – and unfair, with more of your income going
to pay these taxes the poorer you are. Drawing on insights
from behavioural economics, David concludes that there is
a fair, inclusive, adaptable, affordable and resilient way of
enabling us to eat healthily and to tackle the obesity crisis.
ISBN: 978-1-907994-50-0
Christian Wolmar’s Are Trams Socialist? (published spring 2016) argues that
it is not too far fetched to say that there has never been a transport policy
in the UK – and one is clearly needed. The book suggests elements that such
a policy could include.
ISBN: 978-1-907994-56-2
All titles in the Perspectives series are available to buy from London
Publishing Partnership’s website with free UK postage and packing:
http://londonpublishingpartnership.co.uk/perspectives-series/