


 mechanics
 advertising
Similar presentations:


PITSTOP_05 Project Summary
1.
12.
Table of Contents1.
Project Summary
03
2.
Explanation of the Brake Model
04
3.
Nissan’s Data Set
05
Summary of existing dataset
06
Applying Pitstop Brake Model & how it works
08
Success & Validation
10
Conclusion
11
4.
Next steps / Phase 2 to further prove out the model
11
2
3.
1.2.
Brake model is working
xxx
xxx
Comparison to mileage based shows a distinct advantage
xxx
xxx
3.
Clear next steps to Achieve…. _____
4.
Next steps / Phase 2 to further prove out the model
3
4. TL;DR the existing dataset can be used for a brake model
From the existing list of Pitstop prognostic models, it seems that the brakemodel would be the most applicable to the Nissan dataset as it stands.
How The Brake Model Works
Problem: If brakes wear out it is a safety and regulatory issue, but inspections
mean downtime and expense
Em = kinetic energy of motion, where m = vehicle mass and V = speed of vehicle
Brakes wear because vehicles must dissipate (convert to heat) their energy of motion Em
The vehicles dissipating the most energy are wearing out their brakes fastest and
should be targeted for inspection
Secret Sauce: Combining telematics, service records with big data and machine learning for example: (i)
reliably detect all braking events, (ii) manage cohorts to create correct statistical distributions for energy and
for brake maintenance records (iii) Validating the model against maintenance records and known replacements
4
5.
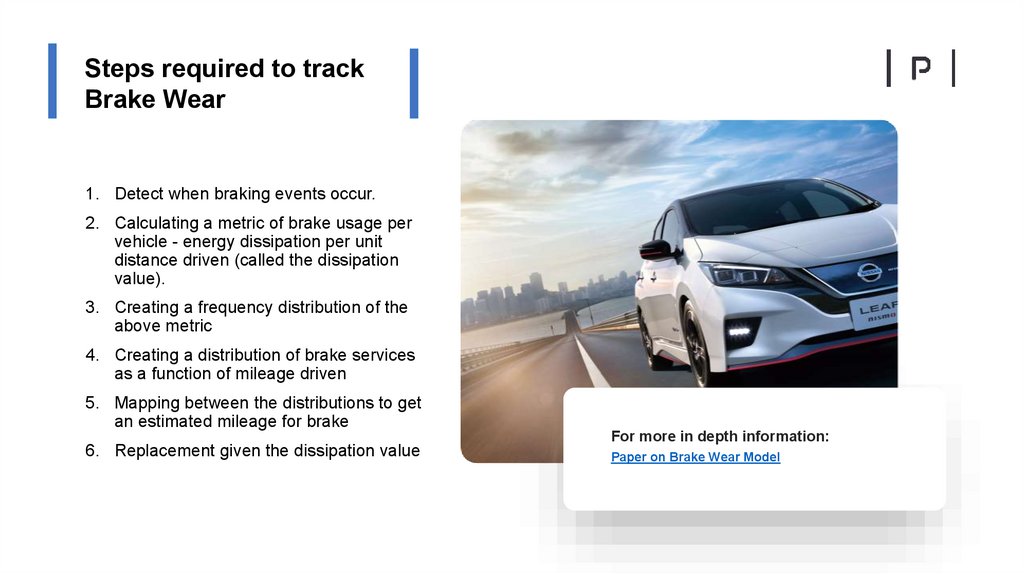
Steps required to trackBrake Wear
1. Detect when braking events occur.
2. Calculating a metric of brake usage per
vehicle - energy dissipation per unit
distance driven (called the dissipation
value).
3. Creating a frequency distribution of the
above metric
4. Creating a distribution of brake services
as a function of mileage driven
5. Mapping between the distributions to get
an estimated mileage for brake
6. Replacement given the dissipation value
For more in depth information:
Paper on Brake Wear Model
6. The data has good attributes for Brake Predictions
High resolution data from a smallvolume of vehicles (Engineering
test fleet)
Consistent datastreams from
large volumes of vehicles
(Customer vehicles)
• Measurements of physical components every
week/month (brakes, tires)
• GPS & Acceleration data at low frequencies
(~30s)
• CAN bus data including detailed attributes like
brake pressure
• Maintenance records includes brake
measurements
• GPS & Acceleration data at high
frequencies (~1s or faster)
• Big Data Volume! Thousands of vehicles with
more than 2 brake measurements.
• Speed, power terrain parameters; torque,
coolant, engine oil temp, temp throttle position
amongst others (~1s)
• High mileage in short periods of time
6
7.
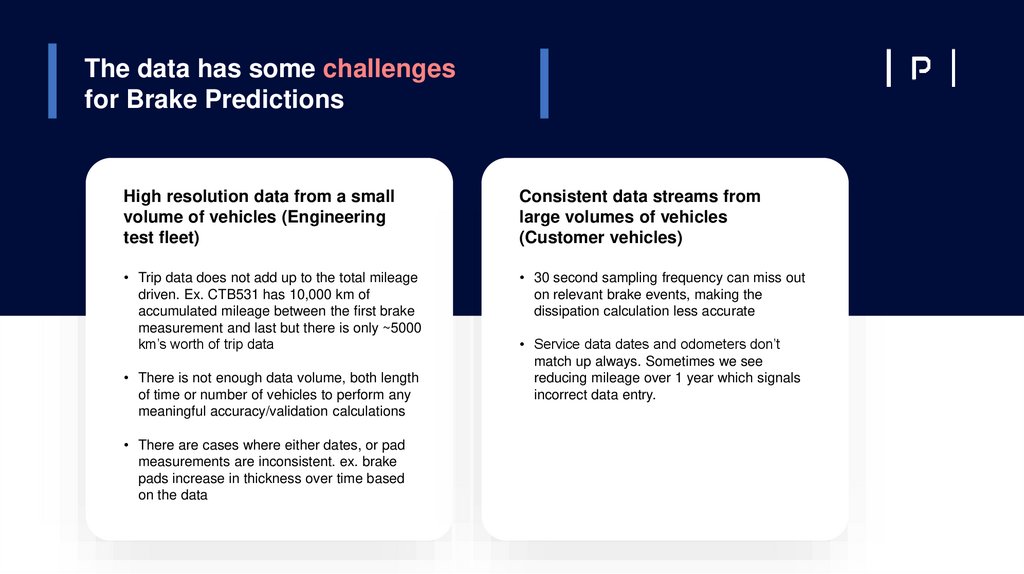
The data has some challengesfor Brake Predictions
High resolution data from a small
volume of vehicles (Engineering
test fleet)
Consistent data streams from
large volumes of vehicles
(Customer vehicles)
• Trip data does not add up to the total mileage
driven. Ex. CTB531 has 10,000 km of
accumulated mileage between the first brake
measurement and last but there is only ~5000
km’s worth of trip data
• 30 second sampling frequency can miss out
on relevant brake events, making the
dissipation calculation less accurate
• There is not enough data volume, both length
of time or number of vehicles to perform any
meaningful accuracy/validation calculations
• There are cases where either dates, or pad
measurements are inconsistent. ex. brake
pads increase in thickness over time based
on the data
• Service data dates and odometers don’t
match up always. Sometimes we see
reducing mileage over 1 year which signals
incorrect data entry.
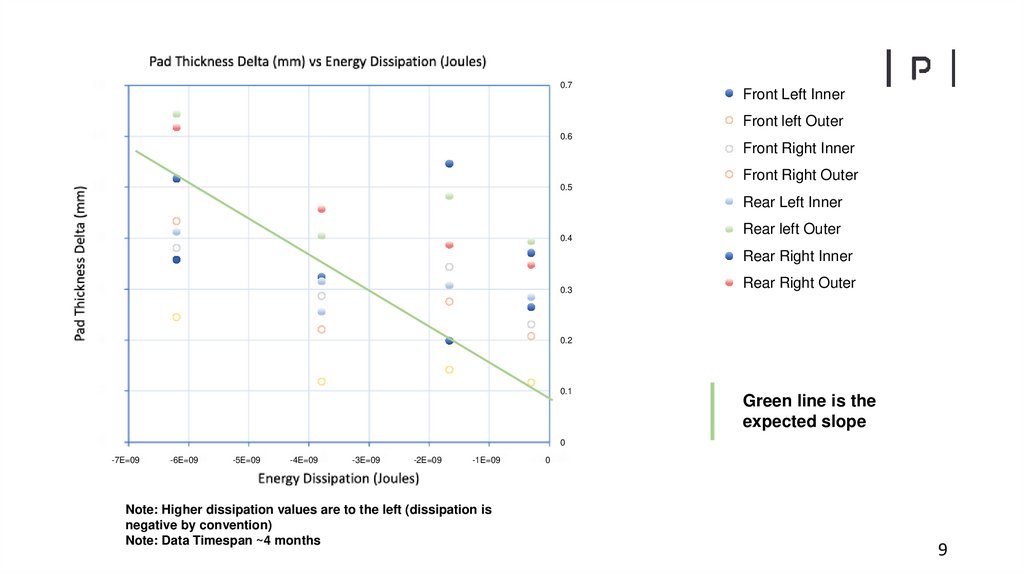
8. Applying the brake model - exploration on FET data
Applying the brake model exploration on FET dataExpectation is satisfied with engineering test fleet which
is that more energy dissipation in brakes => more wear
between measurements (seen in pad thickness
measurement) (CTB546)
8
9.
0.7Front Left Inner
Front left Outer
0.6
Front Right Inner
Front Right Outer
0.5
Rear Left Inner
0.4
Rear left Outer
Rear Right Inner
0.3
Rear Right Outer
0.2
0.1
Green line is the
expected slope
0
-7E=09
-6E=09
-5E=09
-4E=09
-3E=09
-2E=09
-1E=09
Note: Higher dissipation values are to the left (dissipation is
negative by convention)
Note: Data Timespan ~4 months
0
9
10. The brake model is showing Success & validation
The brake model is showingSuccess & validation
Showcase accuracies and strong signs of success with the available dataset
Improvements of the model are better described as reliability rather than accuracy,
since it means the model can be adjusted to avoid incorrect assumptions about
different vehicle cohorts. However, if we think of accuracy as an average measure of
agreement, such as R2, it will amount to the same thing.
Accuracy is not the same as precision. For example, it does not matter if
measurements are made to the nearest 100 μ if the standard deviation of the
measurement is 1.0 mm.
10
11. Next steps to further prove out the brake model
High resolution data helps create accurate dissipation models. However to takeadvantage of the cohorts via big data there is not enough cases (< 20). This serves as
a great start to show that energy dissipation directly correlates with brake wear (slide
7).
However to be statistically relevant a validation test needs to incorporate more cases.
The low resolution UIO data helps to put vehicles in cohorts and then plot them on a
distribution. An R^2 measure can be made between each vehicle and the “average”.
The average is defined as the mileage suggested brake replacement that is provided to
every customer.
The accuracy will be the error between the algorithms estimated brake replacement
and the average case.
11
12. Steps to validate the model
Step 1: calculate thedissipation for each vehicle
and assign it to a cohort
Step 2: Each cohort will have a wear pattern which can estimate when a
brake pad replacement will be needed. Note: vehicles can change
between cohorts as additional data is captured
Cohort distribution
Expected brake wear at mileage for =-1800
Epsilon(J/km)
n
-1000
3
-1200
5
-1300
7
Expected brake wear at mileage for =-1000
km
W (mm)
km
W (mm)
1000
-0.18
1000
-0.1
11000
-1.97
11000
-1.1
21000
-3.78
21000
-2.1
31000
-5.58
31000
-3.1
41000
-7.38
41000
-4.1
51000
-9.18
51000
-5.1
-1500
7
-1800
11
-1900
5
61000
-10.97
61000
-6.1
-2000
2
71000
-12.97
71000
-7.1
Table 1.
Table 2.
Table 3.
12
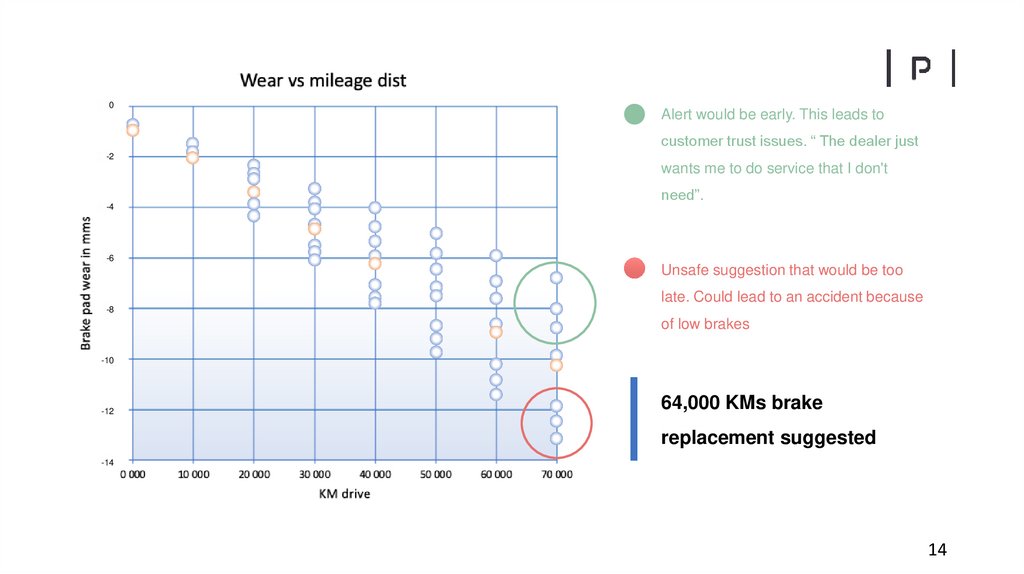
13. Validate the model
Step 3: Comparison between each cohort (blue dotted line) and theaverage (orange dotted line) will provide an accuracy measure. Cohorts
that experience more wear will benefit from safety whereas those that
experience less wear will benefit from receiving an accurate suggestion.
13
14.
0Alert would be early. This leads to
customer trust issues. “ The dealer just
-2
wants me to do service that I don't
need”.
-4
-6
Unsafe suggestion that would be too
late. Could lead to an accident because
-8
of low brakes
-10
-12
64,000 KMs brake
replacement suggested
-14
14
15. Summary: Expected conclusion of phase 2
We expect phase 2 will prove that the brake model works on the UIO data and be ableto showcase a percentage accuracy.
We will use the validation technique described in figure 9 (slide 9).
Based on Pitstops current brake model it seems the accuracy should be within this
range x-y% which would be the target.
15
16. Nissan Roadmap to Additional Predictions
Nissan Roadmapto Additional
Predictions
16
17.
Table of Contents1.
2.
Pitstop’s current Models
18
How the Pitstop data engine works
19
Current Pitstop Models / Data Requirements
20
Custom Models - to solve specific problems
21
What Data Nissan Has today:
22
Positive attributes and what can be done with it today
23
Challenges & Gaps
24
3.
Recommendations Priorities for how to fill the data gap
25
4.
Suggested Road Map
26
17
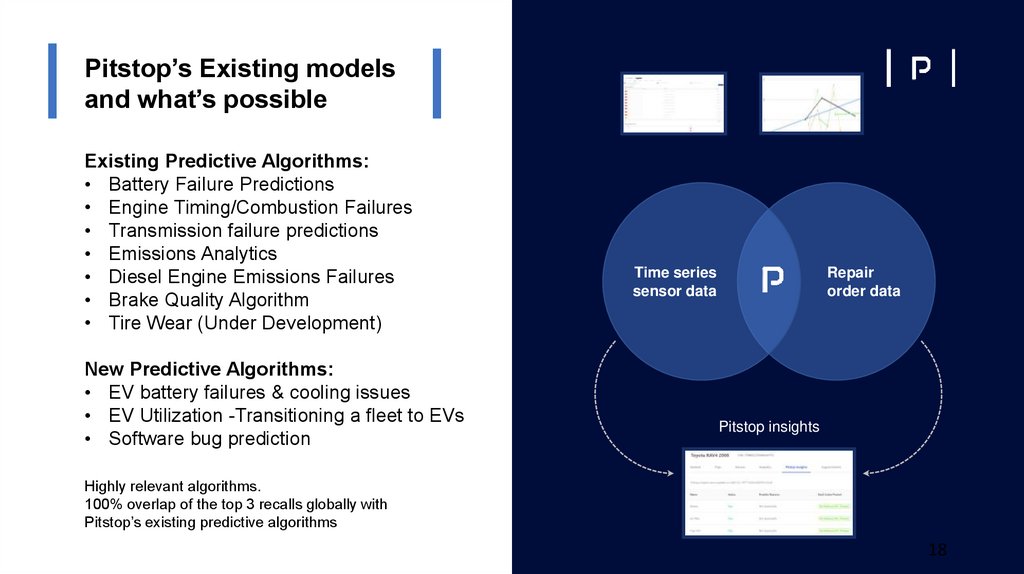
18.
Pitstop’s Existing modelsand what’s possible
Existing Predictive Algorithms:
• Battery Failure Predictions
• Engine Timing/Combustion Failures
• Transmission failure predictions
• Emissions Analytics
• Diesel Engine Emissions Failures
• Brake Quality Algorithm
• Tire Wear (Under Development)
New Predictive Algorithms:
• EV battery failures & cooling issues
• EV Utilization -Transitioning a fleet to EVs
• Software bug prediction
Time series
sensor data
Repair
order data
Pitstop insights
Highly relevant algorithms.
100% overlap of the top 3 recalls globally with
Pitstop’s existing predictive algorithms
18
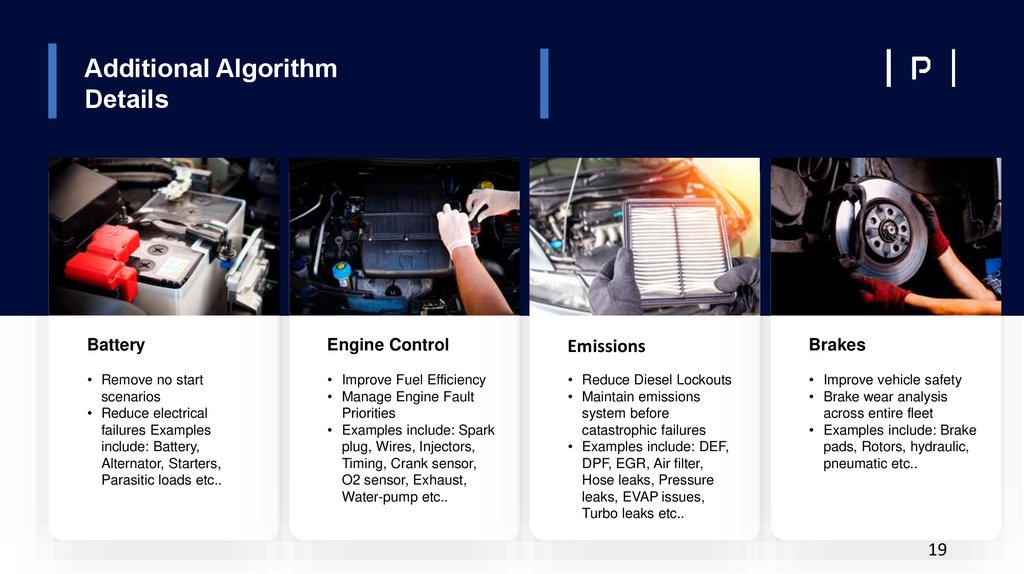
19.
Additional AlgorithmDetails
Battery
Engine Control
Emissions
Brakes
• Remove no start
scenarios
• Reduce electrical
failures Examples
include: Battery,
Alternator, Starters,
Parasitic loads etc..
• Improve Fuel Efficiency
• Manage Engine Fault
Priorities
• Examples include: Spark
plug, Wires, Injectors,
Timing, Crank sensor,
O2 sensor, Exhaust,
Water-pump etc..
• Reduce Diesel Lockouts
• Maintain emissions
system before
catastrophic failures
• Examples include: DEF,
DPF, EGR, Air filter,
Hose leaks, Pressure
leaks, EVAP issues,
Turbo leaks etc..
• Improve vehicle safety
• Brake wear analysis
across entire fleet
• Examples include: Brake
pads, Rotors, hydraulic,
pneumatic etc..
19
20. Recommendation to extract further value
Sensata Technologies (NYS; ST) became a strategic investor (September 2020) is a leaderin sensing solutions and the global market share leader in TPMS
Strategic initiatives include a brake and tire prediction solution for the transportation industry.
Underinflation &
Leakage
Load & Utilization
Monitoring
Pad Wear
Insights
Tread Wear
insight
Tire
Tracking
Alignment
Monitoring
20
21. Additional Algorithm Details
Additional Algorithm DetailsProblem
Delivery Van Sliding Door was not intended to open and close 100’s of times per day causing bracket failure and eventually body panel damage
Solution:
Utilizing a couple readily available telematics PIDs and repair order information, Pitstop
can create a custom algorithm to predict when this failure will occur -avoiding a
significant body panel repair cost
21
22. The Nissan data has good attributes for models
High resolution data from a small volume of vehicles (Engineering test fleet• Measurements of physical components every week/month (brakes, tires)
• CAN bus data including detailed attributes like brake pressure, Speed, power terrain
parameters;torque, coolant, engine oil temp, temp throttle position amongst others
• GPS & Acceleration data at high frequencies (~1s or faster)
• High mileage in short periods of time
Consistent datastreams from large volumes of vehicles (Customer vehicles)
• GPS & Acceleration data at low frequencies (~30s)
• Maintenance records as long as the customer arrives at the dealer
• Big Data Volume! 10’s of thousands of vehicles
22
23. The dataset overall does have challenges & gaps
The dataset overall does havechallenges & gaps
The dataset consists of telematics generated and service data
acceleration, gps at 30 second intervals and odometer
Service records from 30K or so vehicles.
With the current state of telematics data alone solutions related to route optimization and driver
risk can be implemented.
With service data alone can assist with getting ahead of defects or looking at inventory and
service lane statistics. You can build mileage based prediction models as well.
A value item to be extracted from both data sets is a brake model!
Additional models that maybe extracted include brake and tire wear. These will require extensive
analysis and research before being certain that the reliability and accuracy of the models are
suitable.
23
24. Recommendation to extract further value
Start by asking what types of value propositions are most important to the market.For example if it’s clear that Nissan wants to have models for as many components as possible,
then the strategy requires deep edge to cloud implementation. This is capability Pitstop has in
the market.
If Nissan decides they want to focus on brakes, batteries and tires then the roadmap will just
require specific time-series sensors to be enabled in the data stream.
Pitstop suggests taking a fully integrated approach in order to take advantage of rapid software
and data science iteration cycles. New problems will emerge that you cannot currently predict,
and hence you need a flexible infrastructure to quickly build new models. This will payback
returns as customer satisfaction will improve as well as reduction of recall and warranty costs.
24
25.
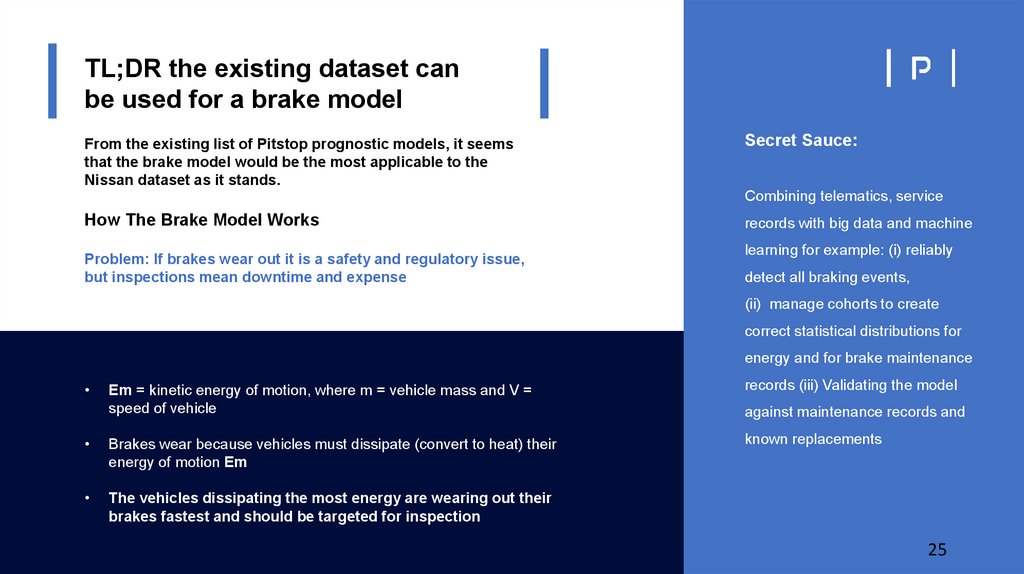
TL;DR the existing dataset canbe used for a brake model
From the existing list of Pitstop prognostic models, it seems
that the brake model would be the most applicable to the
Nissan dataset as it stands.
Secret Sauce:
Combining telematics, service
How The Brake Model Works
Problem: If brakes wear out it is a safety and regulatory issue,
but inspections mean downtime and expense
records with big data and machine
learning for example: (i) reliably
detect all braking events,
(ii) manage cohorts to create
correct statistical distributions for
energy and for brake maintenance
Em = kinetic energy of motion, where m = vehicle mass and V =
speed of vehicle
records (iii) Validating the model
Brakes wear because vehicles must dissipate (convert to heat) their
energy of motion Em
known replacements
The vehicles dissipating the most energy are wearing out their
brakes fastest and should be targeted for inspection
against maintenance records and
25
26.
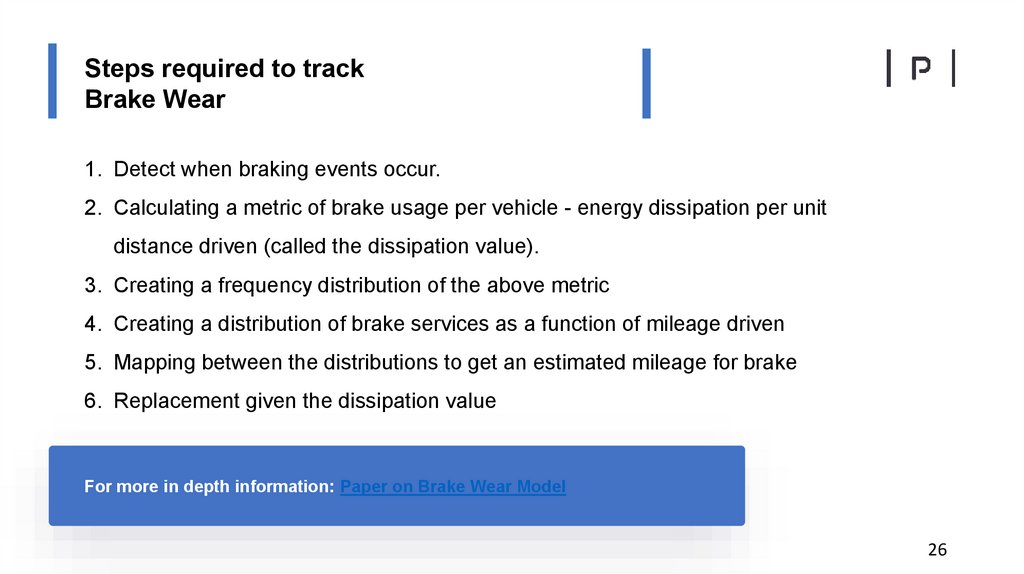
Steps required to trackBrake Wear
1. Detect when braking events occur.
2. Calculating a metric of brake usage per vehicle - energy dissipation per unit
distance driven (called the dissipation value).
3. Creating a frequency distribution of the above metric
4. Creating a distribution of brake services as a function of mileage driven
5. Mapping between the distributions to get an estimated mileage for brake
6. Replacement given the dissipation value
For more in depth information: Paper on Brake Wear Model
26
27.
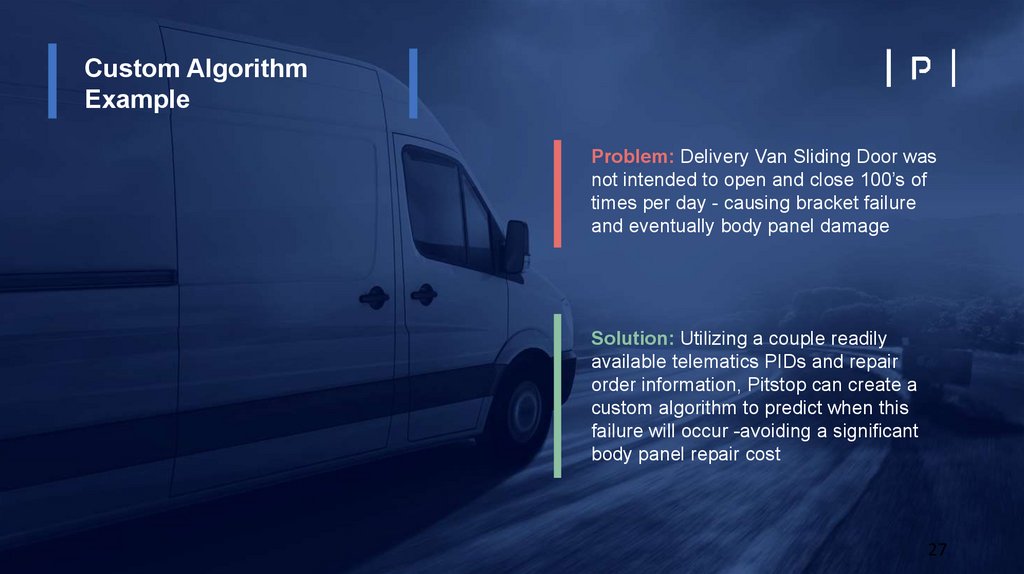
Custom AlgorithmExample
Problem: Delivery Van Sliding Door was
not intended to open and close 100’s of
times per day - causing bracket failure
and eventually body panel damage
Solution: Utilizing a couple readily
available telematics PIDs and repair
order information, Pitstop can create a
custom algorithm to predict when this
failure will occur -avoiding a significant
body panel repair cost
27
28.
Recommendation to extractfurther value
Start by asking what types of value propositions
are most important to the market.
For example if it’s clear that Nissan wants to
have models for as many components as
possible, then the strategy requires deep edge to
cloud implementation. This is capability Pitstop
has in the market.
Pitstop suggests taking a fully integrated approach
in order to take advantage of rapid software and
data science iteration cycles. New problems will
emerge that you cannot currently predict, and
hence you need a flexible infrastructure to quickly
build new models. This will payback returns as
customer satisfaction will improve as well as
reduction of recall and warranty costs.
If Nissan decides they want to focus on brakes,
batteries and tires then the roadmap will just
require specific time-series sensors to be
enabled in the data stream.
28
29.
Recommendation toextract further value
Start by asking what types of value propositions
are most important to the market.
For example if it’s clear that Nissan wants to
have models for as many components as
possible, then the strategy requires deep edge to
cloud implementation. This is capability Pitstop
has in the market.
If Nissan decides they want to focus on brakes,
batteries and tires then the roadmap will just
require specific time-series sensors to be
enabled in the data stream.
29
30.
Recommendation toextract further value
Threats texts
Threats texts
A wonderful serenity has taken
A wonderful serenity has taken
possession of my entire soul,
possession of my entire soul,
Threats texts
Threats texts
A wonderful serenity has taken
possession of my entire soul,
Threats texts
A wonderful serenity has taken
possession of my entire soul,
A wonderful serenity has taken
67%
possession of my entire soul,
Threats texts
A wonderful serenity has taken
possession of my entire soul,
30
31.
Recommendation toextract further value
12+
Start by asking what types of value
propositions are most important to the market.
For example if it’s clear that Nissan wants to
have models for as many components as
possible, then the strategy requires deep edge
to cloud implementation. This is capability
Pitstop has in the market.
If Nissan decides they want to focus on brakes,
batteries and tires then the roadmap will just
require specific time-series sensors to be
enabled in the data stream.
22%
text
290+
text
32.
Recommendation toextract further value
A wonderful serenity
A wonderful serenity has taken
possession of my entire soul, like
these sweet
A wonderful serenity
A wonderful serenity has taken
possession of my entire soul, like
these sweet
A wonderful serenity
A wonderful serenity has taken
possession of my entire soul, like
these sweet
A wonderful serenity
A wonderful serenity has taken
possession of my entire soul, like
these sweet