


 informatics
Similar presentations:


Line graph essay
1.
Line Graph Essay2.
5 steps:• 1)
• 2)
• 3)
• 4)
• 5)
Analyse the question
Identify the main features
Write an introduction
Write an overview
Write the details paragraphs
3.
Your essay should have 4 paragraphs:• Paragraph 1 – Introduction
• Paragraph 2 – Overview
• Paragraph 3 – 1st main feature
• Paragraph 4 – 2nd main feature
4.
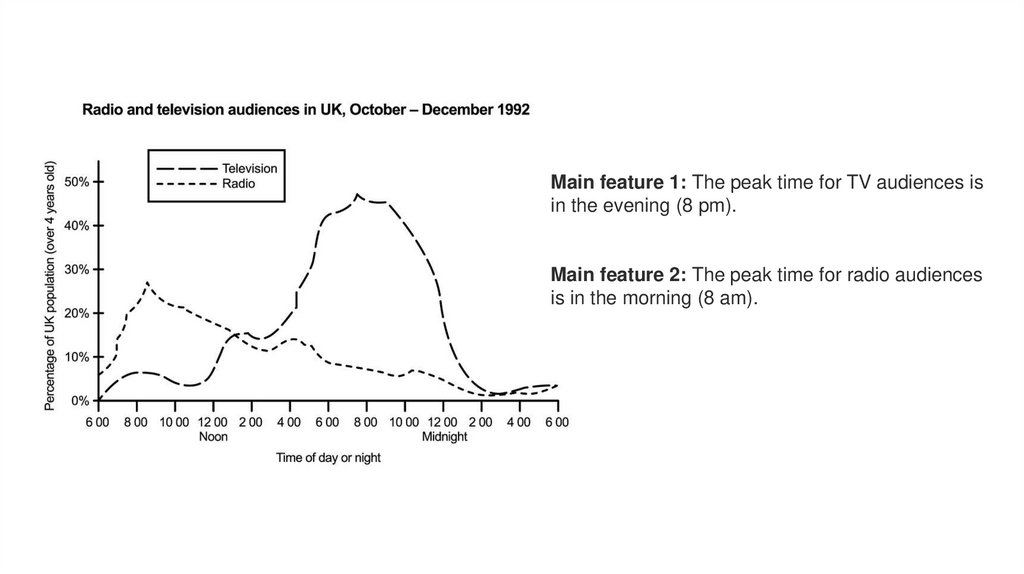
The graph below shows radio and television audiences throughout the day in1992.
Summarise the information by selecting and reporting the main features, and
make comparisons where relevant.
Write at least 150 words.
5.
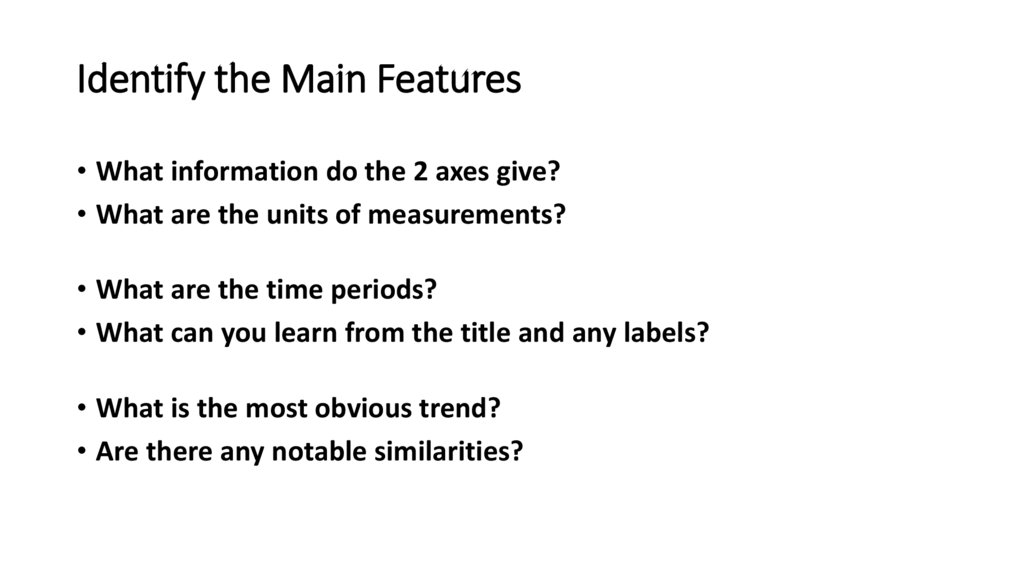
Identify the Main Features• What information do the 2 axes give?
• What are the units of measurements?
• What are the time periods?
• What can you learn from the title and any labels?
• What is the most obvious trend?
• Are there any notable similarities?
6.
Main feature 1: The peak time for TV audiences isin the evening (8 pm).
Main feature 2: The peak time for radio audiences
is in the morning (8 am).
7.
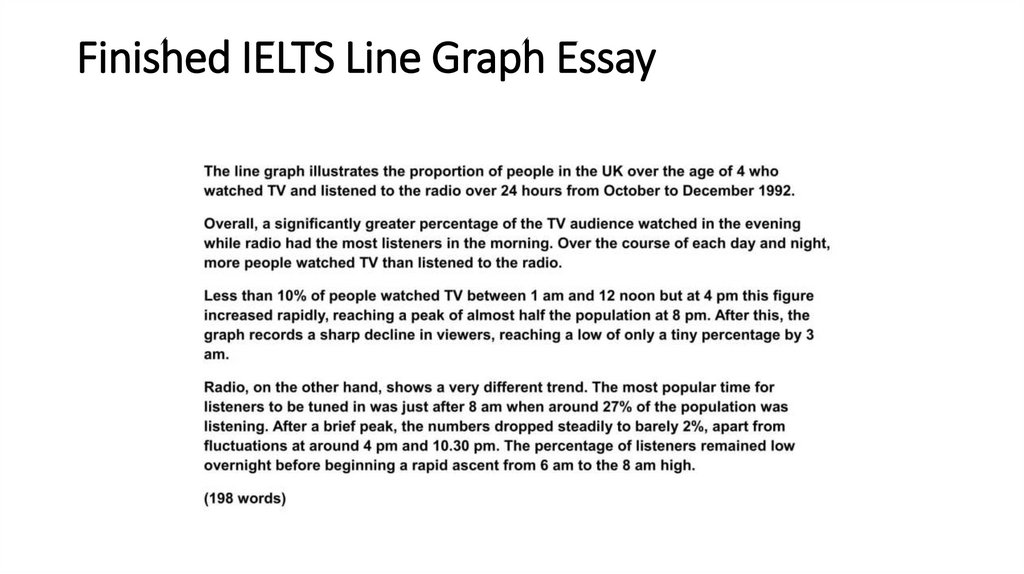
Write an IntroductionQuestion:
The graph below shows radio and television audiences throughout
the day in 1992.
Introduction (Paragraph 1):
The line graph illustrates the proportion of people in the UK who
watched TV and listened to the radio over 24 hours from October to
December 1992.
8.
Write an Overview (Paragraph 2)Overview (Paragraph 2):
Overall, a significantly greater percentage of the TV audience watched
in the evening while radio had the most listeners in the morning.
Over the course of each day and night, more people watched TV than
listened to the radio.
9.
Write the 1st Detail ParagraphHere is our first main feature again:
Main feature 1: The peak time for TV audiences is in the evening (8 pm).
Paragraph 3:
Less than 10% of people watched TV between 1 am and 12 noon but at 4
pm this figure increased rapidly, reaching a peak of almost half the
population at 8 pm. After this, the graph records a sharp decline in
viewers, reaching a low of only a tiny percentage by 3 am.
10.
Write the 2nd Detail ParagraphFor the fourth and final paragraph, you do the same thing for your second key
feature.
Main feature 2: The peak time for radio audiences is in the morning (8 am).
Paragraph 4:
Radio, on the other hand, shows a very different trend. The most popular time
for listeners to be tuned in was just after 8 am when around 27% of the
population was listening. After a brief peak, the numbers dropped steadily to
barely 2%, apart from fluctuations at around 4 pm and 10.30 pm. The percentage
of listeners remained low overnight before beginning a rapid ascent from 6 am to
the 8 am high.