
 education
Similar presentations:


Nazarbayev University Admissions Statistics On Undergraduate Programs (direct And Transfer Admissions)
1.
NAZARBAYEV UNIVERSITYADMISSIONS STATISTICS ON
UNDERGRADUATE PROGRAMS
(Direct and Transfer Admissions)
2014-2019
2.
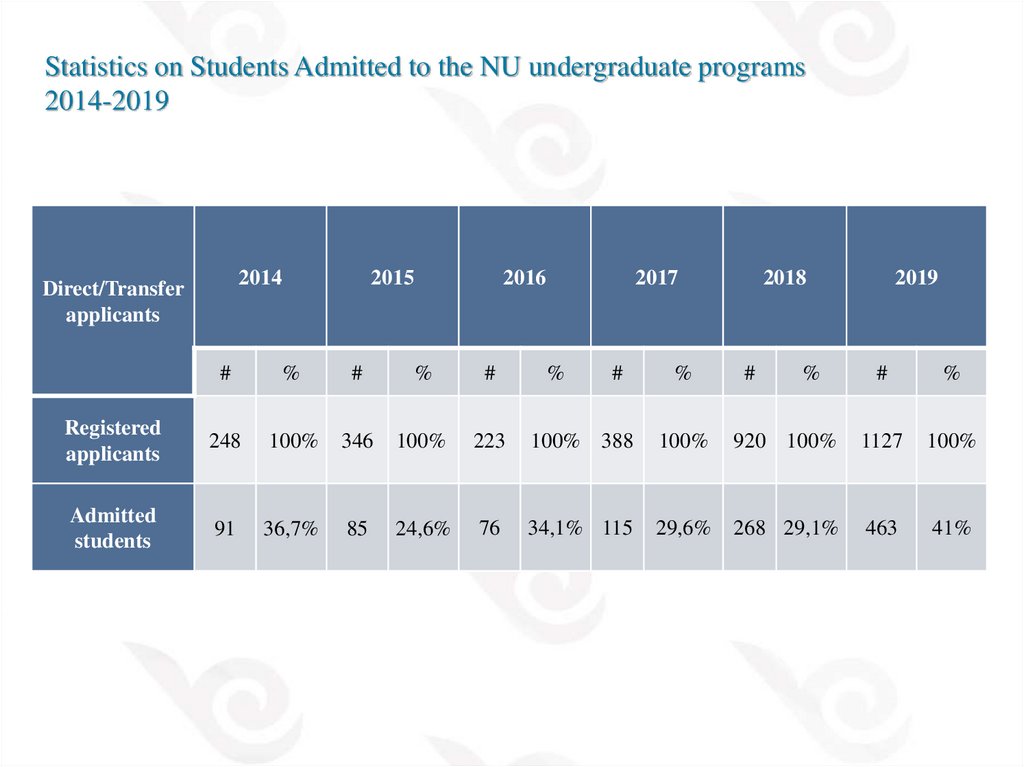
Statistics on Students Admitted to the NU undergraduate programs2014-2019
2014
Direct/Transfer
applicants
2016
2015
2017
#
%
#
%
#
Registered
applicants
248
100%
346
100%
223
100% 388
100%
Admitted
students
91
36,7%
85
24,6%
76
34,1% 115
29,6%
%
#
%
2018
#
%
2019
#
%
920 100%
1127
100%
268 29,1%
463
41%
3.
Statistics on Students Admitted by NU Schools 2014-20192014
2015
2016
NU Schools
#
%
#
%
#
School of
Engineering
20
22%
23
27%
39
School of Science
and Technology
43
47%
37
44%
School of
Humanities and
Social Sciences
28
31%
25
29%
2017
%
100%
85
100%
#
51%
34
30%
78
29% 128 28% 322
29%
12
16%
31
27%
110
41% 178 38% 411
38%
25
33%
50
43%
72
27% 109 24% 309
28%
8
3%
* With students who were enrolled to BApn program
76
100
%
115 100%
%
#
%
Total
%
Nursing
91
2019
#
School of Mining
and Geosciences
Total
2018
#
%
24
5%
32
3%
24*
5%
24*
2%
268 100% 463 100% 1098 100%
4.
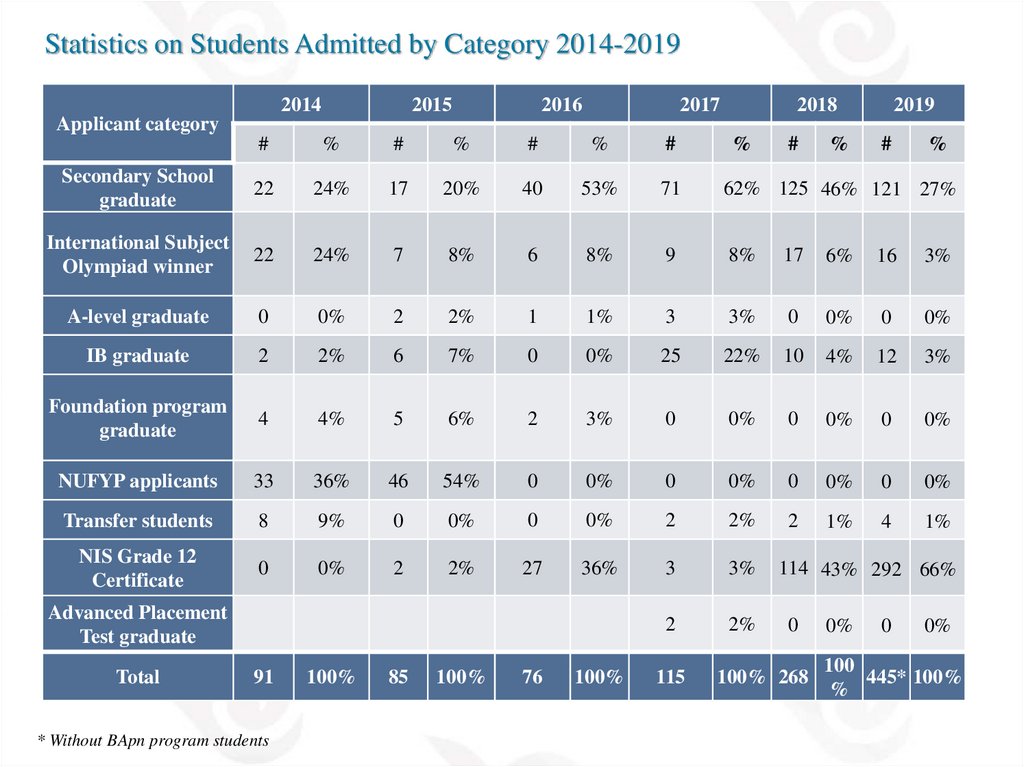
Statistics on Students Admitted by Category 2014-20192014
2016
2015
2017
2018
2019
Applicant category
#
%
#
%
#
%
#
Secondary School
graduate
22
24%
17
20%
40
53%
71
62% 125 46% 121 27%
International Subject
Olympiad winner
22
24%
7
8%
6
8%
9
8%
17
6%
16
3%
A-level graduate
0
0%
2
2%
1
1%
3
3%
0
0%
0
0%
IB graduate
2
2%
6
7%
0
0%
25
22%
10
4%
12
3%
Foundation program
graduate
4
4%
5
6%
2
3%
0
0%
0
0%
0
0%
NUFYP applicants
33
36%
46
54%
0
0%
0
0%
0
0%
0
0%
Transfer students
8
9%
0
0%
0
0%
2
2%
2
1%
4
1%
NIS Grade 12
Certificate
0
0%
2
2%
27
36%
3
3%
2
2%
Advanced Placement
Test graduate
Total
91
* Without BApn program students
100%
85
100%
76
100%
115
%
#
%
#
%
114 43% 292 66%
0
100% 268
0%
0
0%
100
445* 100%
%
5.
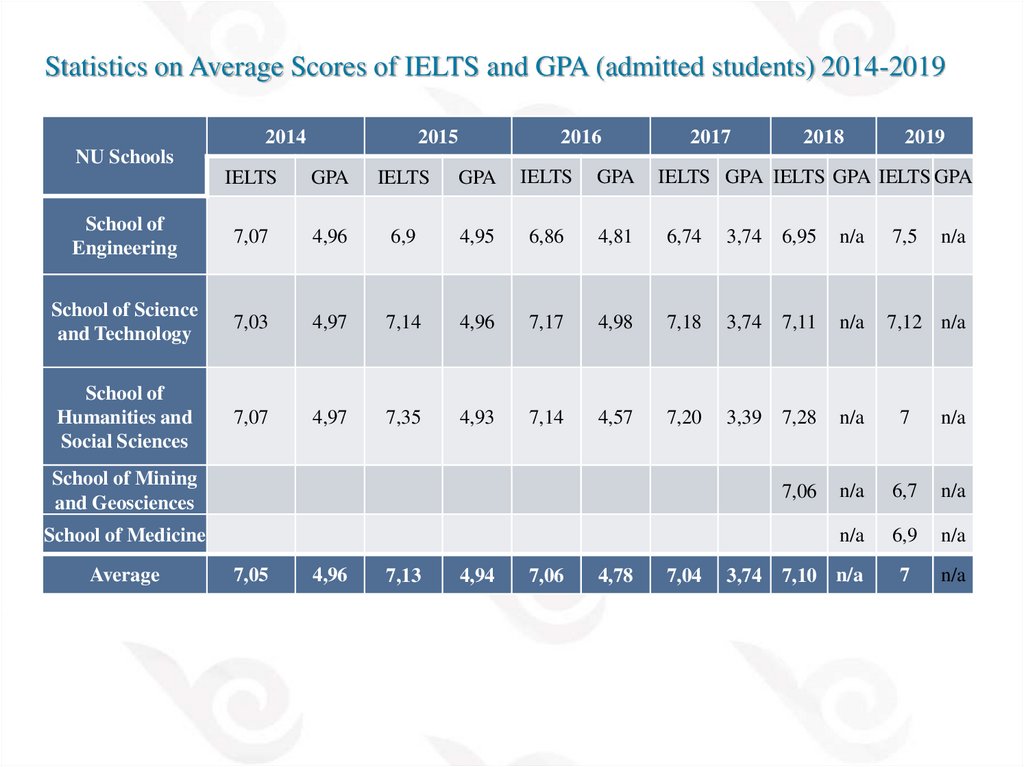
Statistics on Average Scores of IELTS and GPA (admitted students) 2014-20192014
2016
2015
2017
2018
2019
NU Schools
IELTS
GPA
IELTS
GPA
IELTS
GPA
IELTS GPA IELTS GPA IELTS GPA
School of
Engineering
7,07
4,96
6,9
4,95
6,86
4,81
6,74
3,74 6,95
n/a
7,5
School of Science
and Technology
7,03
4,97
7,14
4,96
7,17
4,98
7,18
3,74
7,11
n/a
7,12 n/a
School of
Humanities and
Social Sciences
7,07
4,97
7,35
4,93
7,14
4,57
7,20
3,39 7,28
n/a
7
n/a
7,06
n/a
6,7
n/a
n/a
6,9
n/a
7
n/a
School of Mining
and Geosciences
School of Medicine
Average
7,05
4,96
7,13
4,94
7,06
4,78
7,04
3,74 7,10 n/a
n/a
6.
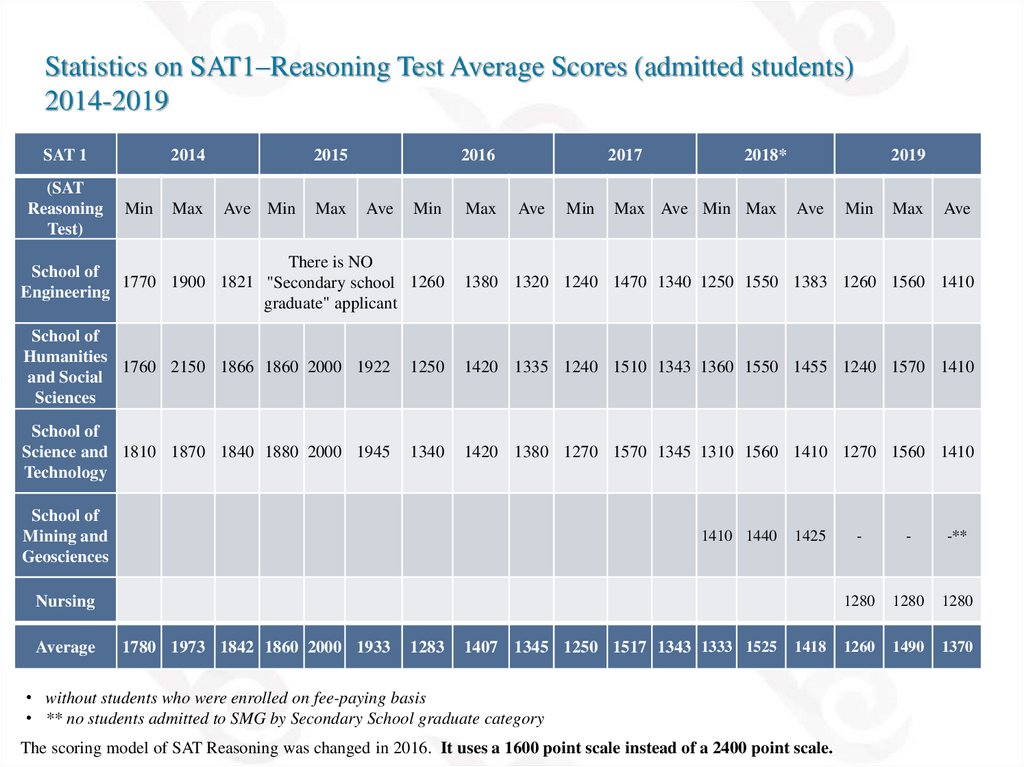
Statistics on SAT1–Reasoning Test Average Scores (admitted students)2014-2019
SAT 1
(SAT
Reasoning
Test)
2014
Min
Max
2015
Ave Min
Max
2016
Ave
Min
Max
2017
Ave
Min
2018*
Max Ave Min Max
2019
Ave
Min
Max
Ave
There is NO
School of
1770 1900 1821 "Secondary school 1260
Engineering
graduate" applicant
1380 1320 1240 1470 1340 1250 1550 1383 1260 1560 1410
School of
Humanities
1760 2150 1866 1860 2000 1922
and Social
Sciences
1250
1420 1335 1240 1510 1343 1360 1550 1455 1240 1570 1410
School of
Science and 1810 1870 1840 1880 2000 1945
Technology
1340
1420 1380 1270 1570 1345 1310 1560 1410 1270 1560 1410
School of
Mining and
Geosciences
1410 1440
1425
Nursing
Average
1780 1973 1842 1860 2000 1933
1283
1407 1345 1250 1517 1343 1333 1525
1418
• without students who were enrolled on fee-paying basis
• ** no students admitted to SMG by Secondary School graduate category
The scoring model of SAT Reasoning was changed in 2016. It uses a 1600 point scale instead of a 2400 point scale.
-
-
-**
1280
1280
1280
1260
1490
1370
7.
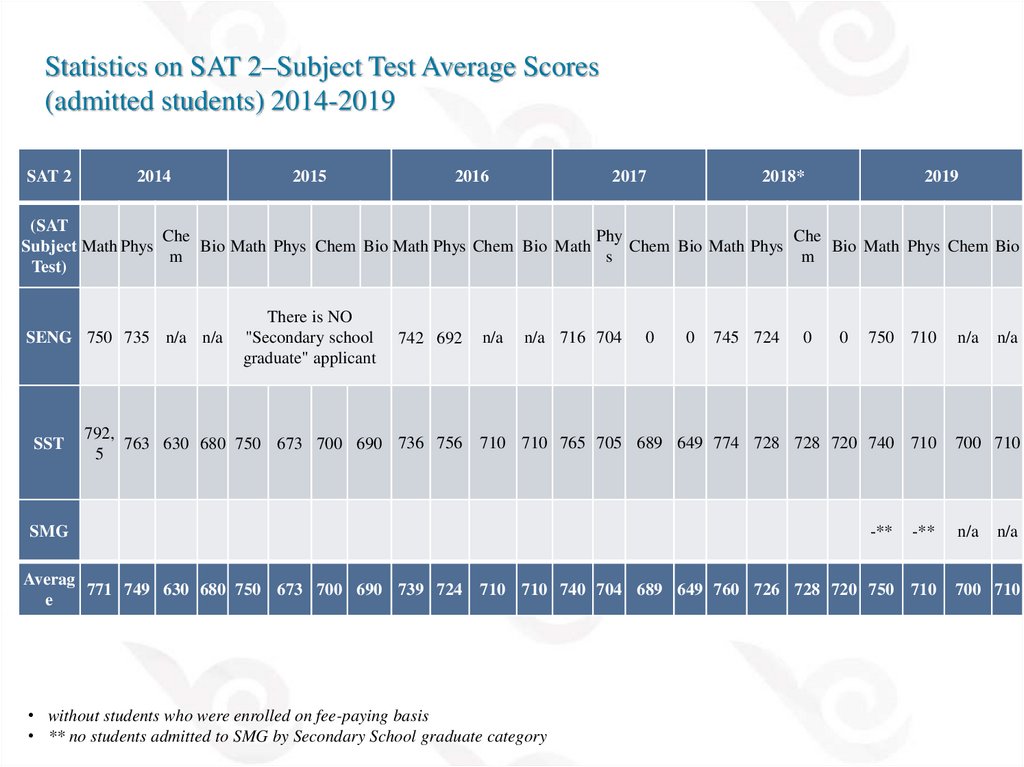
Statistics on SAT 2–Subject Test Average Scores(admitted students) 2014-2019
SAT 2
2014
2015
2016
2017
2018*
2019
(SAT
Che
Phy
Che
Subject Math Phys
Bio Math Phys Chem Bio Math Phys Chem Bio Math
Chem Bio Math Phys
Bio Math Phys Chem Bio
m
s
m
Test)
SENG 750 735 n/a n/a
SST
There is NO
"Secondary school
graduate" applicant
742 692
792,
763 630 680 750 673 700 690 736 756
5
n/a
n/a 716 704
0
745 724
0
0
750 710
710 710 765 705 689 649 774 728 728 720 740 710
-**
SMG
Averag
771 749 630 680 750 673 700 690 739 724
e
0
-**
710 710 740 704 689 649 760 726 728 720 750 710
• without students who were enrolled on fee-paying basis
• ** no students admitted to SMG by Secondary School graduate category
n/a
n/a
700 710
n/a
n/a
700 710
8.
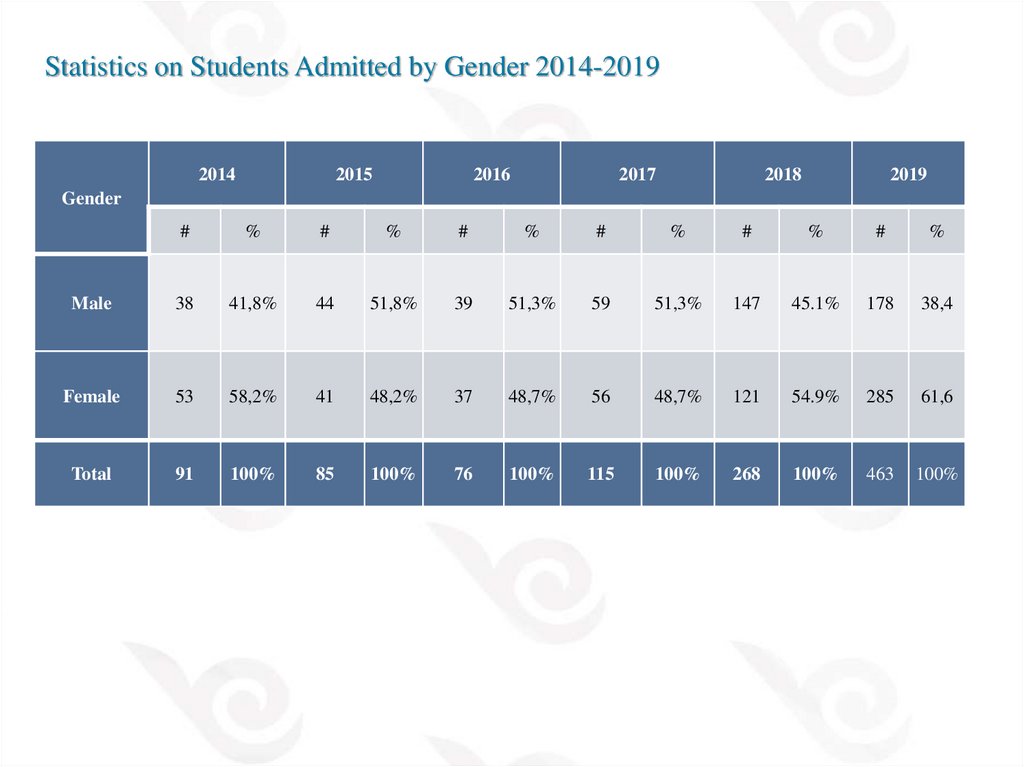
Statistics on Students Admitted by Gender 2014-20192014
2015
2016
2017
2018
2019
Gender
#
%
#
%
#
%
#
%
#
%
#
%
Male
38
41,8%
44
51,8%
39
51,3%
59
51,3%
147
45.1%
178
38,4
Female
53
58,2%
41
48,2%
37
48,7%
56
48,7%
121
54.9%
285
61,6
Total
91
100%
85
100%
76
100%
115
100%
268
100%
463
100%