Similar presentations:
Primary care strategic plan and implementation blueprint
1.
Primary Care Strategic Plan andImplementation Blueprint
Deliverable – Strategic plan
2. The strategic plan deliverable covers the content specified in the project milestone plan
Overview of deliverable content (1/6)Page in
document
p. 9-17
p. 114
Deliverable
content
Details
Outline of Primary Care strategy approach (embedded in Dubai Health Strategy,
Dubai Plan and UAE Vision 2021, considering Dubai 50-year Charter)
Primary Care mission statement
Five holistic themes outlining gaps identified in baselining and benchmarking
Five strategic objectives derived from themes
26 strategic initiatives for implementation cascaded from the strategic objectives
#
Strategy Plan
Governance for implementation of Primary Care strategy
Including roles (initiative owner, taskforce, Program 4, other functions and PHC and • Governance
DHA leadership) and their responsibilities
1
2
Aspects which need to be in place to operationalize the strategy • Enablers
p. 30-38
2
Expanded service offering to include postnatal care & adolescent health; increase
mental health
‘Task-shifting’ from specialized to family physicians and allied staff
Value-adding services for a fee
Consultations when administering child vaccinations
Clinical Services
3
3. The strategic plan deliverable covers the content specified in the project milestone plan
Overview of deliverable content (2/6)Page in
document
Deliverable
content
Details
#
Aspects which need to be in place to operationalize the strategy • Enablers (continued)
p. 30-38
3
Formalized registration policy and process with designated Family Physician
Standards and KPIs for patient-centric patient-physician interactions
Patient-centered medical home (PHCMH) standards
Enhanced telehealth service regulation and introduction of ‘regulatory sandboxes
Policies, guidelines
& standards
Formalized registration policy and process with designated Family Physician
Adapted/ extended opening hours of PHCs
Multi-phase triage system with use of ‘light triage’ pre-visit and on-site
Appointment scheduling system
Optimized operating procedures of Dubai Future Accelerator
‘Task-shifting’ from specialized to family physicians and allied staff
Consultations when administering child vaccinations
Operating
procedures
Employee performance management framework
Shifted funding from block budget funding to activity-/ claims-based funding
Implementation of value-based reimbursement mechanisms
Value-adding services for a fee
Consultations when administering child vaccinations
Finance
3
4. The strategic plan deliverable covers the content specified in the project milestone plan
Overview of deliverable content (3/6)Page in
document
Deliverable
content
Details
#
Aspects which need to be in place to operationalize the strategy • Enablers (continued)
p. 30-38
Enhanced telehealth service regulation and introduction of ‘regulatory sandboxes
Appointment scheduling system
Strengthened adoption of technology for diagnosis and treatment
Optimized operating procedures of Dubai Future Accelerator
Telemedicine service offering within PHCs
Technology to increase convenience and speed in PHC processes
Patient-centered medical home (PHCMH) standards
Expanded service offering to include postnatal care & adolescent health; increase
mental health
Adapted/ extended opening hours of PHCs
Multi-phase triage system with use of ‘light triage’ pre-visit and on-site
Optimize utilization of staff (incl. specialists, family physicians and nurses
‘Task-shifting’ from specialized to family physicians and allied staff
Employee performance management framework
Technology
3
Human Resource
Promote PHCs by signaling high quality of services and staff to patients • Procurement (for &
Multi-phase triage system with use of ‘light triage’ pre-visit and on-site
Asset Mgmt.
4
5. The strategic plan deliverable covers the content specified in the project milestone plan
Overview of deliverable content (4/6)Page in
document
Deliverable
content
Details
#
Aspects which need to be in place to operationalize the strategy • Enablers (continued)
p. 30-38
p. 105-111
p. 112-113
5
Telemedicine service offering within PHCs • Procurement (for &
Strengthened adoption of technology for diagnosis and treatment
Asset Mgmt.
Technology to increase convenience and speed in PHC processes
(continued)
Expanded service offering to include postnatal care & adolescent health; increase
mental health
Additional PHCs in relevant locations to close capacity gap
Adapted/ extended opening hours of PHCs
Multi-phase triage system with use of ‘light triage’ pre-visit and on-site
3
Facility Design
Overview of internal and external stakeholders/ partners required for
implementation of the strategy, including level of interaction and role of
stakeholder/ partner
Potential
partnerships and
stakeholder mgmt
Recommended approach for change management, including principles of change
Change Management
management and template for identification of right engagement measures to
and Program
ensure awareness, willingness and ability to change
Management
Program management template for tracking progress of initiative implementation
4
6. The strategic plan deliverable covers the content specified in the project milestone plan
Overview of deliverable content (5/6)Page in
document
Deliverable
content
Details
#
Financial implications of Primary Care strategy including analyses of spending,
revenues and funded mandate in three scenarios ('As-it-is', conservative and
aggressive) and detailed budget plan for each initiative
Note: The strategy recommends an improved/ maximized utilization of existing
resources before considering build-up of additional capacity
Business Plan/
Financial Impact
5
p. 80-104
21 Key Performance Indicators (KPIs) along strategic themes
KPIs include outcome and clinical KPIs and are outlined in individual charters with
details on KPI intent, calculation methodology, frequency etc.
Performance
monitoring
framework
6
p. 126-127
Overview of key prerequisites for the success of the strategy
Overview of strategic enablers including regulatory requirements
Success factors &
strategic enablers
7
p. 116 – 124
Outline of recommended risk management approach and identified key risks
Outline of potential mitigating measures for each identified risk
Risk analysis
8
Overview of forecasted Primary Care spending (from private/ OOP and
Funding & resource
government sources and outline of budget ask from the government in order to
reqs., incl. sourcing,
finance the implementation of the strategy
resource mobilization
Outline of partnership plans for implementation (e.g., telehealth service provider) • & partnership plans
9
p. 39-79
p. 55, 58, 60,
66-79
p. 128-130
6
Overview of technologies to improve processes at PHCs as well as technologies for
diagnosis and treatment
• Innovation strategies
for service delivery
10
7. In addition to the requirements in the milestone plan, the strategy provides further value-adding content & analysis
In addition to the requirements in the milestone plan, the strategyprovides further value-adding content & analysis
Additional deliverables
Page in
document
See
situational
analysis
deliverable
See benchmarking
deliverable
p. 18-29
7
Details
Deliverable
content
#
Survey with representative sample from Dubai population, incl. 30 questions on
community preferences
Vast insights into Dubai population preferences with regards to choice of provider,
choice of physician, willingness to adopt technology etc.
Population survey
1
Comprehensive benchmarks of 16 countries, including system-wide country
benchmarks (Canada, UK, Bahrain, Singapore) and topic-specific case studies (e.g.,
innovation in Estonia)
Best practice
benchmarks
2
5 patient journeys illustrating the target state of PHCs
Including Primary Care as entry point, innovative delivery models, maternal and
child health, urgent care and adolescents care
Patient journeys
3
8. Table of Contents
Strategy PlanPatient Journeys
Initiatives for Implementation
Business Case/ Financial Impact
Performance monitoring framework
Stakeholder map, change mgmt. and program mgmt.
Risk Analysis
Appendix
8
9. The Primary Care strategy is based on a mission and cascades to themes, strategic objectives, and initiatives
PrimaryCare strategy approach
UAE Vision 2021
Primary Care Strategic Program is embedded in the Dubai Health Strategy, Dubai
Plan and UAE Vision 2021 and considers the Dubai 50-year Charter (article #5, A
Doctor for Every Citizen)
Dubai Health Strategy
Mission
Themes
Primary Care Mission
“Provide accessible, integrated, value-driven, and innovative care centered
around the needs of the people and the community”
5 Primary Care Themes
Key consideration areas derived from the gaps identified in the
baselining and benchmarking assessment
5 Strategic Objectives
Strategic Objectives
Target state goals derived from identified themes
26 Initiatives
Initiatives
9
Concrete strategic initiatives for implementation
cascaded from the strategic objectives
10. A mission statement was selected for the Primary Care strategy from various potential options
Mission statement options“Ensure access to high quality primary care in an equitable fashion and focus on promoting
primary care as an entry point” (Dubai Health Strategy)
1
“Promote and provide Primary Care which is centered around the patient’s needs, integrated
across all levels of care, driven by value and delivered in an innovative manner”
2
“Ensure access to patient-centered, integrated and value-driven care,
delivered through the latest innovation”
3
“Provide accessible, integrated, value-driven, and innovative care centered around the needs of the
4
people and the community”
Selected statement
10
11. Five themes holistically outline the gaps identified in the baselining and benchmarking assessment
Primary Care themesCurrent state assessment
Accessibility and
Availability
Awareness and
Coordination
Population survey
Benchmarks
Innovation
NTP Alignment
Value and
Efficiency
11
Integration
Key consideration areas derived from the
gaps identified in the baselining and
benchmarking assessment
12. To remedy the limited and undirected use of PHC services, PHC should focus on fostering awareness and coordination
Details of awareness and coordination themeLimited Primary Care use: 7% of the Dubai population
visit DHA PHCs (lower than benchmarks, e.g., 20% in
Singapore); 75% of patients prefer hospitals and ER
Awareness initiatives do not signal high quality of
services & staff (>50% of patients choose care provider
based on perceived quality) as much as benchmarks
Awareness and
Coordination
(e.g., Bahrain)
Patient continuity of care is limited, with rare
referrals back to Primary Care (e.g., 38% of cases in ER
rooms are non-urgent, yet not referred to PHCs)
No designated family physician for patients (v/s best
practices in Canada, UK and Bahrain)
Source: Current state analysis, Survey, Benchmarks; PHC: Primary Health Center, Primary Care: Primary Care, EP: Entry Point, ER: Emergency Room
12
13. Limited incentives, partial coverage, and a supply gap require increasing PHC access and availability
Details of accessibility and availability themePatients are not incentivized to use Primary Care as
point of entry (v/s best practices in Singapore and
Bahrain)
Insurance coverage is restricted, with ~3 Mn privately
insured patients out-of-network
Accessibility and
Availability
Patient demand-supply gap will widen to ~300 FP
by 2025 (capacity masterplan data)
PHCs can increase service offering: 45% of patients
indicate a preference for larger services scope
As per best practice there is a lack of light PHC triage
system in place and potential to reduce 24/7 opening
hours
Source: Current state analysis, Survey, Benchmarks; PHC: Primary Health Center, Primary Care: Primary Care, EP: Entry Point, ER: Emergency Room
13
14. To evolve in terms of process and technology, PHC should increase its focus on innovation
Details of innovation themeInnovation targets narrow patient groups, e.g., smart
devices only used during nurse-led home visits
PHC processes can be improved to e.g., through activation
of features in MyChart which are not used today
Innovation
65% of patients would use technology for diagnosis and
treatment (72% phone and 44% video consultation)
As per benchmarks, technology is key in Primary
Care (e.g., 99% of all Primary Care prescriptions are
digital in Estonia)
Source: Current state analysis, Survey, Benchmarks
14
15. Block funding is leading to poor productivity and service, making the case for better value and efficiency
Details of value and efficiency themePrimary Care is funded through government block
budget rather than activity-based revenues
Productivity in PHCs is below benchmarks (e.g., 17
patients/FP/day v/s 25-32 in benchmarks)
Value and
Efficiency
High waiting times of ~40 mins are suboptimal as
'convenience' is a strong driver for use of Primary
Care
Compared to benchmarks PHCs over-rely on
specialists (e.g., in maternal and child health)
Source: Current state analysis, Survey, Benchmarks; PHC: Primary Health Center, Primary Care: Primary Care, EP: Entry Point, ER: Emergency Room
15
16. Primary Care integration into the community should be promoted to address limited involvement today
Details of integration themeToday, integration of Primary Care into the community is
limited to community representatives
Integration
Community integration can be improved compared to
benchmarks (e.g., very strong collaboration with
schools in Norway, with 3rd sector in UK and
Singapore)
Source: Current state analysis, Survey, Benchmarks; PHC: Primary Health Center, Primary Care: Primary Care, EP: Entry Point, ER: Emergency Room
16
17. Thus, the target state of PHC is coordinated, accessible, innovative, value-driven, and integrated
Characteristics of target stateIntegration
Value and
Optimal
utilization of
Efficiency
Primary Care staff
Strong integration
between Primary Care
and other levels of care
Optimal split of
responsibilities,
empowering allied staff
Consistent involvement
of family physicians in
patient’s care
High level of training
and strong privileging of
family physicians
Strong links to schools
& other community
settings
Established employee
perf. management
framework
Strong public health
management
Funding through value-
based reimbursement
17
Innovation
Use of technology to
enable and accelerate
administrative
processes
Telemedicine as major
treatment delivery
channel
Accessibility and
Availability
Incentives for Primary
Care as entry point
Equitable access to PHC
for all
Adequate supply of
PHCs in PHC
Use of latest innovation
in treatment of patients
Access to Urgent Care
when needed and use of
‘light triage’
Supporting regulation
as a basis for technology
use
Full-service range that
includes PHC services for
the whole family
Awareness and
Coordination
High awareness and
trust in Primary Care
Formal designation of
Family Physician acting
as patient case manager
Physician patient-
centricity
Well-established
coordination with other
levels of care
Strong involvement of
patients in their own care
18. Table of Contents
Strategy PlanPatient Journeys
Initiatives for Implementation
Business Case/ Financial Impact
Performance monitoring framework
Stakeholder map, change mgmt. and program mgmt.
Risk Analysis
Appendix
18
19. Five patient journeys were developed to illustrate the target state
Target state patient journey personasMariam
15 years old
Student
Suffers from mild
anorexia
“Ever since my parents got
divorced I have been
feeling sad but I do not
know with whom to talk
about this. I do not want
to burden my parents with
my trouble”
19
Omar
Samira
20 years old
Sports enthusiast
Needs urgent care
28 years old
Married
Pregnant with first
child
“I have to see a doctor
urgently but I do not want
to spend the whole day at
the emergency
department”
“As it is my first
pregnancy, I have many
questions and concerns. I
want my pregnancy care to
be provided by someone I
know and trust”
Mohamad
27 years old
Digital-savvy
Needs a doctor
consultation
“Getting care should be as
easy as possible for me. I
expect my care provider to
use the latest technology
to deliver care in a
convenient way”
John
55 years old
English expat
Suffers from diabetes
“I’m feeling tired and I am
too busy with work. I wish
there was an easy and
convenient way to receive
care from a qualified
doctor”
20. In his patient journey, John became aware of Primary Care as an entry point and had a positive experience
Differences to current stateJohn’s patient journey
4
Dr. Ahmad engages John in the examination,
and tactfully communicates his diagnosis of
diabetes. Dr. Ahmad and John design the initial
plan of care together
John schedules an
appointment, and
meets Dr. Ahmad
3
On TV, John sees an
advertisement for
Nadd al Hamar
Close
> 15mn consultation time
5
Dr. Ahmad schedules a follow-up
appointment engaging John’s family and
activates an inter-disciplinary team
20mn
wait
5mn
drive
Coverage
John registers Dr. Ahmad as his designated FP,
who acts as a case manager and coordinates
John’s chronic diabetes care
Priority booking
with specialists
Foot care
Nutrition
Eye Care
20
Family and
Patient Education
Replacement doctors
available in case
of absence
2
John feels tired, eats
excessively, and
sleeps poorly
John
Qualified
English expat
in Dubai
55 years old
Priority
Booking
6 John rates his experience
7
as five stars across
dimensions (e.g., physician
competence, comfort)
1
John visits Dr. Ahmad regularly, as
his designated FP, to manage his
chronic diabetes and maintain
continuity of care across his
treatment
Ratings are aggregated and feed
into a KPI dashboard
8
21. In the current state, John’s journey was not as patient-centric and his relationship to his doctor not as strong
John’s patient journey – differences to current stateFP is encouraged to be
caring and engages the
patient in the care plan
Waiting times are decreased
from ~40mn to ~20mn
Marketing for Primary Care
is increased
Close
20mn
wait
Patient-centricity along PHCMH
principles is insured.
FP proactively engages patient’s
family
FP is designated as case
manager for patient
Podiatrist
Nutritionist
PHCMH: Patient-centered medical home FP: Family Physician
21
5mn
drive
Qualified
Fast
Patient satisfaction is
measured and reflects the
FP’s performance
Replacement doctors
available in case
of absence
John
English expat
in Dubai
55 years old
Patient chronic disease is
managed by designated
family physician
22. Mohamad’s journey is fully enabled by innovative technology
Differences to current stateMohamad’s patient journey
Via his DHA app Mohamad books an
Careem to the PHC – in the car
Mohamad answers his medical
assessment questionnaire through his
DHA application
3
With his DHA app Mohamad has
a telehealth consultation with
Dr. Khaled who asks him to come
to the PHC for a lab test
2
Mohamad spots a rash on his arm. He
uses his home assistant to schedule a
telehealth appointment with Dr. Khaled,
his Family Physician
1
Mohamad
tech-savvy
27 years old
At the PHC Mohamad uses the selfservice vital checker to read his vitals. He
enters the PHC smart gates with a QR
code on his DHA app which also guides
him to his treatment room
22
4
A nurse takes a sample of
Mohamad’s blood and sends it
to the lab – afterwards
Mohamad can leave the PHC
5
Mohamad receives a telehealth call from Dr. Khaled to 6
update him on the lab results – he is allergic to cotton
and gets prescribed an antihistamine via the
ePrescription platform that is directly delivered to his
house
23. In the current state, Mohamad’s patient journey is not supported by innovation
Mohamad’s patient journey – differences to current stateNo possibility to conduct/
update health status prior
to the PHC visit
3
No dedicated DHA
telehealth facility
2
No appointment system and
online/ mobile appointment
booking tool
1
Mohamad
tech-savvy
27 years old
Check-in an rooming is only
partially automated (e.g., checkin kiosk)
23
4
5
Patient has to come to the PHC
to receive sensitive lab test
results
6
24. Samira receives care by her family doctor throughout her whole pregnancy
Differences to current stateSamira’s patient journey
7 months later
Samira receives her entire ANC from
Dr. Zainab. At the end of her pregnancy,
Dr. Zainab refers her to the hospital for birth
3
2 weeks later
Dr. Zainab conducts a risk-assessment.
Samira’s pregnancy is low risk. Dr. Zainab
encourages her to continue to receive ANC
in the PHC
Samira sees her Family Physician
Dr. Zainab to
1
confirm her pregnancy
2
Samira
pregnant with her
first child
28 years old
3 weeks later
Shortly after birth, Samira returns to Dr. Zainab.
Dr. Zainab examines her rehabilitation progress and provides
counselling and advice on how to take care of the baby. She
offers home care services to support her.
24
Over the next 6 years
4
Samira routinely comes to the PHC, where Dr. Zainab provides care for her
son and checks his development. Samira keeps close track of her son ‘s
development & vaccinations through myChart and Tifli
5
25. Currently, maternity and child services are only partially provided by the family physician; continuity is limited
Samira’s patient journey – differences to current state3
In the current state, Samira would receive antenatal care in
the ANC clinic by an OB specialist
2
Currently, Samira would be
referred to a ANC specialist after
confirmation of pregnancy
1
Samira
pregnant with her
first child
28 years old
Currently, postnatal
care is not provided in
the PHC (or at home)
25
4
Currently, review of
child growth is done
by pediatricians
5
26. The use of a multi-stage triage facilitates Omar’s journey during an urgent medical need
Differences to current stateOmar’s patient journey
Omar arrives at the nearest PHC. The
staff was informed about Omar’s
arrival by the helpline
3
Omar calls the helpline and is
immediately connected to an advisor.
He is advised to go
to the PHC
2
Omar hurts his foot on the soccer
field. He has trouble getting
up/walking
1
Omar
In need of
urgent care
20 years old
A nurse assesses Omar’s condition
via visual inspection and registers
him. His condition is prioritized as
mildly critical
4
Omar waits for 20 minutes in the
waiting room before seeing
a physician
* In severe cases, direct communication between Family Physicians and hospitals ensured
26
5
Omar is treated by a Family Physician, who conducts an X-Ray.
As his leg is partially fractured he puts it in a cast and advises
Omar on how to take care of his injury. Omar schedules a followup visit with the same doctor
6
27. Lack of formal triage would lead to suboptimal care for Omar in the current state
Omar’s patient journey – differences to current state3
Currently, no helpline
is available to direct
patients to the right
care setting
2
1
Omar
In need of
urgent care
20 years old
In the current state,
there is no triage to
prioritize walk-in
patients
27
4
Currently, waiting
times are ~40mn
5
Currently, Family Physicians
are not always comfortable
with providing urgent care
6
28. Mariam’s specific adolescent health needs are met in the PHC by offering low-threshold services for adolescents
Differences to current stateMariam’s patient journey
Mariam goes to the PHC youth clinic. The
atmosphere is really comforting and she
feels welcomed by the staff.*
2
Mariam’s school nurse approaches her as Mariam has lost a lot of
weight. The school nurse educates Mariam about the school
wellbeing program, tells her about the youth clinic at the PHC
and books an appointment for Mariam.
1
Mariam
Suffers from
anorexia
15 years old
In the youth clinic setting, Mariam opens up to a family physician about her
mental problems & anorexia. The doctor is understanding & provides
consultation. They schedule a follow-up visit.
* Access of adolescents to youth clinic to be ensured (without parental consent form)
28
3
After several visits, Mariam is getting better. She
comes back to her Family Physician with her mother
who is involved in her care plan.
4
29. Mariam’s specific adolescent health needs are met in the PHC by offering low-threshold services for adolescents
Mariam’s patient journey – differences to current stateCurrently, there is no dedicated setting for
adolescents in the PHCs
Currently, referrals between school health
services and Primary Care are not formalized;
coordination is limited
2
1
Mariam
Suffers from
anorexia
15 years old
Currently, there is no dedicated service offering for adolescents
in PHCs. Family Physicians are not particularly trained to
provide adolescent health services
29
3
In the current state, involvement of family in the
care plan as well as continuity of care with Family
Physician is limited
4
30. Table of Contents
Strategy PlanPatient Journeys
Initiatives for Implementation
Business Case/ Financial Impact
Performance monitoring framework
Stakeholder map, change mgmt. and program mgmt.
Risk Analysis
Appendix
30
31. The strategy is comprised of 5 strategic objectives
Primary Care strategic objectivesDubai Primary Care
Strategic Objectives
Expand access and availability of
Primary Care
6 initiatives
2
Empower Family Physicians to become
entry point
Accessibility
and Availability
Awareness and
Coordination
3
Increase adoption of latest
technologies and innovative delivery
models
4 initiatives
Increase integration of Primary Care
into the community
6 initiatives
3 initiatives
Innovation
Integration
NTP Alignment
Value and
Efficiency
Establish a value-driven Primary Care
model
31
1
7 initiatives
4
5
32. Objective Card #1: Empower Family Physicians to become entry point
1Empower Family Physicians to become entry point
Context
Description
High-Level KPIs
% of population
aware of Primary
Care services
% of patients who
responded
positively to the
overall experience
of their FP
consultation
Strong staff qualification and high quality of services are signalled to the market
(given patients choose which provider to go to based on their perceived quality of
staff and services, as per the population survey conducted)
To support the continuity of care, patients are offered to register with a
designated family physician; patients who have signed up with a designated family
physician primarily see their family physician for their health needs
Patient-centric performance KPIs and standards for patient-physician
relationships are introduced to build trust and adapt care to patients needs
Communication and coordination between Primary Care and other levels of care is
formalized, e.g., through joined protocols, clear responsibilities and efficient
communication channels
Initiatives
WS 2:
Innovative
delivery
WS 1:
Entry
point
WS 4:
Urgent
care
Overall
PHC
WS 3:
M&C
32
Benefits
Promote PHCs by signalling high quality of services and
staff to patients
1
Formalize registration policy and process with
designated Family Physician
2
Establish standards and KPIs for patient-centric patientphysician interactions
3
Establish patient-centered medical home standards
4
Source: Strategy& analysis
Increased willingness to use Primary Care as
entry point
Strengthened patient-physician relationship
Improved patient experience at the PHCs
Clear ways of working between care levels
Relevant workstream/dimension
WS: Workstream; FP: Family Physician
33. Objective Card #2: Expand access and availability of Primary Care
2Expand access and availability of Primary Care
Context
High-Level KPIs
Description
FP per 10,000
population
Waiting time for
receiving an
appointment for a
consultation
Service offering is expanded to provide additional services which are today
provided in specialized settings (postnatal care, adolescents health, mental health)
Primary Care capacity is increased through new PHCs (need to be assessed), access
to patients with insurance category C and D is provided
Triage system is introduced to prioritize cases according to their urgency
Incentives are used to channel patients to Primary Care, i.e. offering priority
booking for specialists with prior visit at PHC
Opening hours are extended (from 9pm to 2am) in selected PHCs to increase
availability of care
Initiatives
WS 2:
Innovative
delivery
WS 1:
Entry
point
WS 4:
Urgent
care
Overall
PHC
WS 3:
M&C
Benefits
1
Expand service offering to include postnatal care & adolescent
health; increase mental health
5
Offer access to patients from category C and D insurance
networks
6
Develop incentives to encourage PHC as entry point
7
Broader service offering reflecting patient
needs
Assess need to stablish additional PHCs in relevant locations to
close capacity gap
8
Widened access to PHCs
Offer extended opening hours
Implement multi-phase triage system with use of ‘light triage’
pre-visit and on-site
9
10
Increased adoption of Primary Care as entry
point
Effective prioritization of caseload
More efficient provision of urgent care
services
1) Also includes part of category B privately insured patients
Source: Strategy& analysis
Relevant workstream/dimension
33
WS: Workstream; FP: Family Physician
34. Objective Card #3: Increase adoption of latest technologies and innovative delivery models
3Increase adoption of latest technologies and innovative delivery models
Context
High-Level KPIs
% of patients
using digital precheck in to PHCs
% of tele-health
consultations out
of total
consultations
Description
To increase the use of telehealth, the current telehealth service regulation is updated;
for example new forms of telehealth are included in the regulation (e.g., patientmonitoring). Regulatory sandboxes are introduced to test the new regulations
As per the population survey, patients prefer to be able to schedule appointments –
hence an appointment scheduling system is implemented
Treatment innovations such as AI cancer screening or AR for mental health programs
are introduced
Future Accelerator's operating procedures are enhanced to ensure that the full
potential of the program can be harnessed and more solutions can be implemented
A DHA telemedicine solution is implemented
Administrative Primary Care processes are expedited and simplified through
technology (e.g., activation of available MyChart features)
Initiatives
WS 2:
Innovative
delivery
WS 1:
Entry
point
WS 4:
Urgent
care
Overall
PHC
WS 3:
M&C
Enhance telehealth service regulation and introduce
regulatory sandboxes
Establish appointment scheduling system
34
11
12
13
Optimize Future Accelerator operating procedures
14
Source: Strategy& analysis
Benefits
Strengthen adoption of technology in treatment
Implement telemedicine service offering
Leverage technology to increase convenience and speed
in PHC processes
Strengthened patient experience through
convenience and speed
Improved patient health through advanced
forms of treatment
15
Expanded and more integrated collection of
healthcare data for healthcare analytics
16
Reduced administrative burden
Relevant workstream/dimension
WS: Workstream; FP: Family Physician,
PHC: Primary Care
35. Objective Card #4: Establish a value-driven Primary Care model
4Establish a value-driven Primary Care model
High-Level KPIs
Context
Number of visits
per Family
Physician per day
% of Family
Physicians with
specialty
fellowships
Description
Utilization of PHC physicians is optimized, e.g., by balancing supply physicians
between PHCs and increasing overall productivity
Tasks are shifted between PHC staff to increase efficiency – Family Physicians are to
provide maternal and child health and urgent care services; this is achieved through
trainings and fellowships
PHC funding is shifted from current cost-based block budget to activity-based
An employee performance management framework is introduced
To reduce (almost full) reliance on government funding, value-adding services are
introduced (e.g., blood collection at home, alternative medicine)
Initiatives
Optimize utilization of PHC physicians
WS 2:
Innovative
delivery
WS 1:
Entry
point
WS 4:
Urgent
care
Conduct ‘task-shifting’ (from specialists to family physicians and
allied staff)
Overall
PHC
WS 3:
M&C
Introduce an employee performance management framework
19
Shift PHC funding from block budget funding to activity-/ claimsbased funding
20
Consider value-based reimbursement
21
Assess options to introduce value-adding services for a fee
22
Introduce consultation fees when administering free children
vaccinations (not at same time)
23
Source: Strategy& analysis
35
18
Benefits
1
17
Increased productivity of PHC staff, focus on
core tasks
Relevant work stream/ dimension
Joined standard for assessing employee
performance
Improved quality of care
Reduced reliance on government budget
WS: Workstream; FP: Family Physician
36. Objective Card #5: Increase integration of Primary Care into the community
5Increase integration of Primary Care into the community
High-Level KPIs
Context
Number of joint
public health
management
programs
Description
Social services are included in the design and delivery of Primary Care, meaning that
DHA engages with social services (such as the Community Development Authority) to
integrate social services into patient’s plan of care. Potential areas for integration of
social services are
liaison with Weleef program (government program that provides care and
improves the quality of life of senior UAE nationals who live alone in Dubai) to
improve rehabilitation and social care services for elderly,
cooperation with Child Protection service to improve early recognition of child
abuse/ vulnerable children
Cooperation with schools is strengthened (in terms of formalized referral processes) to
enable early detection of child and adolescent health problems
Cooperation with Public Health is strengthened (in terms of information exchange,
development and delivery of joint programs)
Initiatives
WS 2:
Innovative
delivery
WS 1:
Entry
point
WS 4:
Urgent
care
Overall
PHC
WS 3:
M&C
Collaborate with social services (e.g., CDA) in the
design and delivery of care
24
Strengthen collaboration with schools, e.g. by
formalizing referral process
25
Earlier detection and prevention of child
health problems
Collaborate with Public Health on population health
management
26
Higher patient autonomy
Source: Strategy& analysis
36
Benefits
Relevant workstream/dimension
Care provision closer to patient’s home
WS: Workstream; FP: Family Physician,
PHC: Primary Care
37. Overview of strategic objectives and their corresponding strategic initiatives
Strategic initiatives (1/2)Initiatives
Objectives
Promote PHCs by signalling high quality of services and staff to patients
1
Formalize registration policy and process with designated Family Physician
2
Establish standards and KPIs for patient-centric patient-physician interactions
3
Establish patient-centred medical home (PHCMH) standards
4
Expand service offering to include postnatal care & adolescent health; increase mental health
5
Enhance access to patients from category B (lower range), C and D insurance networks
6
Develop incentives to encourage PHC as entry point
7
Assess need to establish additional PHCs in relevant locations to close capacity gap
8
Adapt extended opening hours for urgent care services
Empower Family
1
Physicians to
become entry point
Expand
access and
availability of
Primary Care
2
Increase
adoption of latest
technologies and
innovative
delivery models
3
9
Implement multi-phase triage system with use of ‘light triage’ pre-visit and on-site 10
Enhance telehealth service regulation and introduce ‘regulatory sandboxes’ 11
Establish appointment scheduling system 12
Strengthen adoption of technology for diagnosis and treatment 13
37
38. Overview of strategic objectives and their corresponding strategic initiatives
Strategic initiatives (2/2)Initiatives
Optimize operating procedures of Dubai Future Accelerator to increase implementation success rate of 14
solutions
Implement telemedicine service offering within PHCs 15
Leverage technology to increase convenience and speed in PHC processes 16
Objectives
Increase
adoption of latest
technologies and
innovative
delivery models
3
Establish a valuedriven Primary Care
model
4
Optimize utilization of PHC physicians 17
Conduct ‘task-shifting’ from specialists to family physicians and family physicians to allied staff
18
Introduce an employee performance management framework 19
Shift PHC funding from block budget funding to activity-/ claims-based funding 20
Consider implementation of value-based reimbursement mechanisms (e.g., pay for performance) 21
Assess options to introduce value-adding services for a fee (e.g., fast track, blood collection at home)
Introduce consultation fees when administering free children vaccinations
Collaborate with social services (e.g., CDA) on design and delivery of care
Strengthen collaboration with schools, e.g. by formalizing referral process
Collaborate with Public Health on population health management
38
22
23
24
25
26
Integrate Primary
Care into the
community
5
39. Table of Contents
Strategy PlanPatient Journeys
Initiatives for Implementation
Business Case/ Financial Impact
Performance monitoring framework
Stakeholder map, change mgmt. and program mgmt.
Risk Analysis
Appendix
39
40. The financial model of the strategy used several sources of input, and the findings were validated across DHA
Data sources and stakeholder discussionsStakeholder met/ validated
Data category
Dr. Pervaz Mohammad, Ahmad Ezzat (PHC)
Annual health statistics report 2017, SALAMA
PHC visits
Dr. Zaher Aboueida, Randa Fares (RCM)
Revenue cycle management
PHC insurance tariffs
Dr. Pervaz Mohammad (PHC)
PHC business development & projects office
PHC spending & revenues
Dr. Ferial Salem Elsayed (Data Analysis and Research
Department)
Dubai healthcare investment guide,
Dubai annual health statistics report
Primary care market data
Dr. Zaher Aboueida (RCM)
Dr. Pervaz Mohammad (PHC)
C & D insurance business case proposal
Category C & D patients
Dr. Ashraf Swaydan (Health Centers Dept.)
US, Canada benchmarks
PHC training costs
Dr. Amel Buharoon (Health Centers Dept.)
Norway, Canada, UK, US, Switzerland
benchmarks
Target PHC physician productivity
Dr. Mohamad Farghaly (DHIC)
Health insurance-related assumptions
Health insurance
IT department
IT system integration costs
US, Canada benchmarks; quotes from babylon,
ada, health at hand
Innovation/ technology costs
Dubai population survey
Patient’s preferences
Mr. Waleed AlDhuhoori, Mr. Khaled, Mr. Shakir
Ms. Smita (IT)
Dr. Hamid Yahya Hussain (Data Analysis, Research &
Studies Dept.)
Dr. El Daw Ali Suliman (Strategy Dept.)
40
Source
41. The financial impact of the strategy is based on a forecast of revenues, costs and funded mandate, under 3 scenarios
Financial model methodology summaryFunded
mandate
‘True’ govt.
burden
=
Cost per FTE
Manpower
productivity
By staff type
By staff type
Forecast
based on
Forecast
historical
based on
inflation,
future visits
overtime
and future
incentives,
inflation
operational
efficiencies
Cost of
and use of
strategy
technology
2017 to 2025 – Strategy Scenario (Aggressive)
Forecast
based on
benchmark
productivity
targets +
changes in
manpower
mix
Other costs
Supplies,
overhead,
etc.
2017 to 2025 – Strategy Scenario (Conservative)
2017 to 2025 – Do Nothing/ 'as-it-is' Scenario
41
-
Costs
Revenues
Revenue per visit
Visits
By public v/s
private
By public v/s
private
By insurance
coverage/ cash
By insurance
coverage/ cash
Forecast based
on historical
inflation + new
sources of
revenue
Forecast based
on historical
growth + ‘new’
redirected
demand to DHA
PHCs
42. Financial impact explanation notes
Referring to slides 44, 45, 46, 62We based the financial impact analysis on 2017 data (latest year with all data available) and developed three scenarios (‘as-it-is’, conservative and aggressive)
Outreach
Today, DHA PHCs cater services to almost 1 Mn visits; historically the number of visits have been growing at 5% annually. If nothing changes ('as-it-is'
–
scenario), the number of visits will continue growing at 5% annually and reach 1.46 Mn by 2025.
Implementing the Primary Care strategy will make Primary Care more attractive for patients and therefore increase the number of visits to 1.8 Mn (in a
–
conservative scenario) and 2 Mn (in an aggressive scenario).
Today, there are few virtual visits (telemedicine consultation), mainly at Al Barsha headache clinic (making up less than 1% of total visits); implementing
–
the Primary Care strategy will increase the virtual visits to 10% of total visits (180k visits in the conservative scenario and 200k visits in the aggressive
scenario).
Waiting times
Today, the waiting time from ‘desk registration’ to ‘seeing a doctor’ is 42 minutes as per the SALAMA data. The Primary Care strategy will reduce the
–
waiting time to 30 minutes (in the conservative scenario) and 25 minutes (in the aggressive scenario), bringing it closer to international benchmarks of
20-30 minutes waiting time.
Today, the waiting time to schedule an appointment is 29 days – this is in line with the DHA PHC target of 28 days.
–
Manpower and productivity
In 2017, the total number of staff at DHA PHCs is ~1,400 FTE working at productivity of 17.6 visits per family physician per day, treating ~1.46 Mn visits
–
per year. Out of these, 209 are family physicians, 392 nurses and 799 other staff.
If nothing changes (‘as-is scenario’), the number of staff will grow proportionally to the number of visits, at the same productivity level of 17.6 visits per
–
family physician per day. This will result in 314 family physicians, 588 nurses and 1,199 other staff in 2025 (total ~2,100 FTE ) to treat ~1.46 Mn visits
per year.
Implementing the strategy will increase the productivity of family physicians to 25 visits per family physician per day (in a conservative scenario) and 28
–
visits per family physician per day (in an aggressive scenario). This will slow down the need for future hiring of family physicians and nurses resulting in
293 family physicians, 630 nurses and 1,489 other staff (total ~2,400 FTE) to treat ~1.8 Mn visits in 2025 in a conservative scenario
298 family physicians, 641 nurses and 1,656 other staff (total ~2,600 FTE) to treat ~2 Mn visits in 2025 in an aggressive scenario
42
43. Financial impact explanation notes
Referring to slides 44, 45, 46, 62 (continued)Financials
In 2017 DHA PHC revenues are recorded at AED 357 Mn (1% out of which come from privately insured patients, 99% come from the government), and
spending was recorded at AED 544 Mn. This leaves a gap of ~AED 188 Mn as funded mandate by the government (funded mandate is government
funding for services which serve the public good and typically do not generate financial returns, e.g., vaccinations, healthcare provision in remote areas).
If nothing changes ('as-it-is' scenario), the natural growth in PHC visits will drive a growth in both revenues and spending in PHCs. Additionally, financial
will be subject to an inflation rate of 2%. As a result, in the 'as-it-is' scenario, revenues will be at AED 752 Mn (1% out of which comes from privately
insured patients) and spending will be at AED 1,143 Mn. This leaves a gap of ~AED 392 Mn as funded mandate by the government.
Implementing the strategy will increase the share of private sector contribution and also decrease the costs in growth through more operational efficiency.
As a result, in the conservative scenario, revenues will be at AED 945 Mn (22% out of which come from privately insured patients, 78% come from the
government). Costs will be at AED 1,267 Mn and the funded mandate at AED 322 Mn to treat ~1.8 Mn visits in 2025.
In the aggressive scenario, revenues will be at AED 1,142 Mn (36% out of which come from privately insured patients, 64% come from the government).
Costs will be at AED 1,385 Mn and the funded mandate will be at AED 243 Mn to treat ~2 Mn visits in 2025.
43
–
–
–
–
44. In 2017, primary care at DHA caters to ~1 Mn visits using ~1,400 employees
PHC metrics (2017)Excel: Sheet ‘'As-it-is'’
Outreach
Manpower/ Productivity
967,000
1,400
209
392
799
17.6
Daily visits/ FP
All staff
Nurses
<1%
799
All staff
99%
Visits
Family Physician
Financials (AED Mn)
Virtual Visits (only headache clinics)
544
+188
Face to Face Visits
Waiting Time
357
42
17.6
44
99%
42
291)
1%
Spending
Govt funded
mandate
44
#
Private and OOP revenue
Revenues
Govt revenue
To appointment
(in days)
Entry to physician
(in mins)
Note: All numbers exclude dental as it is being covered under a separate strategy. 2018 financial data is not yet finalized, hence 2017 is the latest available year for all metrics
1) In line with DHADouble
PHC target
days
click of
on28
graphs
Sources: Dubai health statistics
to open report,
Excel SALAMA, PHC business development and projects; Strategy& analysis
45. Should nothing be done, the visits and manpower will grow, resulting in a higher government funded mandate
PHC metrics (2017 v/s 2025) – 'as-it-is‘ scenarioExcel: Sheet ‘Target State’ and ‘Levers’
Outreach
Manpower/ Productivity
1,400
+5%
2,100
1,400 314
588
392
1,199
209
17.6
799
Employees
Daily
visits/ FP
All staff
All staff 2025
Nurses
314
588
1,199
799
1,460,000
99%
2025 visits
Family Physician
Financials (AED Mn)
+10%
1,143
All staff 2017
<1%
209
+5%
Virtual Visits (only headache clinics)
544
99%
+188 99%
1%
Spending 2025
status-quo
Govt funded
mandate
45
Revenues 2025
status-quo
#
357
45
42
Spending 2017
Private and OOP revenue
967,000
2017 visits
Face to Face Visits
Waiting Time
752
+392
17.6
42
1%
Revenues 2017
Govt revenue
Entry to physician
(in mins)
Note: All numbers exclude dental as it is being covered under a separate strategy. 2018 financial data is not yet finalized, hence 2017 is the latest available year for all metrics
Sources: Dubai health
statistics
report,
SALAMA, PHC business development and projects; Strategy& analysis
Double
click on
graphs
to open Excel
46. The strategy will improve access to care and value for money, to lower the government funded mandate
PHC metrics (2025 'as-it-is' scenario v/s 2025 strategy scenario) - conservativeOutreach
Manpower/ Productivity
1,400
2,411
25.0
17.6
Daily visits/FP
Daily visits/FP
Employees
2025 strategy
2025 ’as-it-is’
All staff
Nurses
+11%
1,267
945
630
Conservative
Scenario 2025
Family Physician
Revenues
2025 strategy
#
31410%
293
As-it-is’ 2025
293
1,489
1,199
2025 strategy
Virtual Visits
Spending
2025 ’as-it-is’
30
Private and OOP revenue
46
99%
1%
Revenues
2025 ’as-is-it’
1,460,000
90%
2025 status-quo
Face to Face Visits
Waiting Time
752
+392
25.0
17.6
1,800,000
1,143
78%
42
Spending
2025 strategy
46
588
1,489
Financials (AED Mn)
22%
Govt funded
mandate
2,100
314
1,199
+322
+23%
+15%
+42%
-29%
42
30
2025 strategy
2025 ’as-it-is’
Govt revenue
Note: All numbers exclude dental as it is being covered under a separate strategy. 2018 financial data is not yet finalized, hence 2017 is the latest available year for all metrics
Sources: Dubai health statistics report, SALAMA, PHC business development and projects; Strategy& analysis
Excel: Sheet ‘Target State’ and ‘Levers’
Double click on graphs
to open Excel
47. In summary, the strategy aims to double the number of visits, yet achieve a 20% reduction in funded mandate
PHC metrics (2017 v/s 2025 strategy scenario)Excel: Sheet ‘Target State’ and ‘Levers’
Growth in manpower
nearly half of growth in
visits
Increase physician
productivity by 40%
200 fold increase
private insurance/ cash
revenue
Reduce share of govt
funded mandate by
>20%
47
Nearly double the
number of visits to
Manpower/
Productivity
Financials
DHA PHCs
Exponentially
increase the number of
telehealth
consultations
Outreach
Reduce waiting
times by 30% (from Waiting Time
entering the clinic to
seeing the doctor)
(entry to doctor)
48. The PHC strategy aims to increase outreach, making PHCs the cornerstone of the healthcare system
Patient conversion mapExcel: Sheet ‘Converted Patients’
Attraction of C and D category patients will be difficult given DHA’s value proposition
and cost structure
C and D inclusion proposal estimates 30k visits by 2020; financial impact analysis is
more conservative and estimates 40k by 2025
Attraction of B category will be difficult given PHC’s value proposition and cost
structure (hence same rate as C and D)
B category not included in inclusion proposal, yet do not have access today and represent
potential pool of new patients
Segments are more in line with PHC’s value proposition and can be attracted to PHCs
through improved patient experience & convenience
Nevertheless, conversion of 8% until 2025 is conservative compared to market share of
DHA PHCs in total market (33%)
Govt insured already represent largest share of PHC’s patient population
Patients can be attracted to PHCs through improved patient experience &
convenience and expanded service offering
Patients show strong willingness to receive care in PHCs (80% as per population
survey)
Gradual attraction of 25% by 2025 driven by PHC strategy implementation (e.g.,
signaling of high quality, increased access)
Patients show strong willingness to receive care in PHCs when faced with an urgent
medical problem (90% as per population survey)
Gradual attraction of 25% of L4 and L5 visits (38% of total ER visits) by 2025 through
strategy implementation
48
Sources
~40k
(4%)
C and D category visits in
1
private sector (~1 Mn)
~8k
(4%)
B (lower range) category
visits in private sector 2
(~200k)
~160k
(8%)
A, B and OOP visits in
3
private sector (~2 Mn)
~120k
(20%)
Govt insured visits in
4
private sector (~625k)
~30k
(25%)
DHA hospital OPD visits
5
(~125k, basic cases)
~ 10k
(25%)
DHA ER visits (~40k, L4/
6
L5 cases)
~370k
Sources: Dubai health statistics report, SALAMA, C and D inclusion proposal, Strategy& analysis
From the private sector
Converted visit # (%)
From DHA
Rationale
49. Financial impact explanation notes
Referring to slides 50, 63Expected spending of DHA PHCs on 2025 after implementation of the strategy
Conservative scenario:
In 2025, under the ‘as-it-is’ scenario, DHA PHCs would incur a spending of AED 1,402 Mn to treat 1.8 Mn visits
–
By implementing the strategy in the conservative scenario, DHA PHCs would save AED 106 Mn from increasing staff operational efficiencies and AED 80
–
Mn from implementing teleconsultations. As a trade-off, DHA PHCs would have to incur AED 50 Mn to implement the initiatives of the strategy. This
yields a true spend of AED 1,267 Mn.
However, by treating more privately insured patients, DHA PHCs will be able to collect AED 151 Mn from private patients. A further AED 734 Mn would
–
be yielded from government insured patients; and additionally, the introduction of value-add services for a few (e.g., blood collection at home, fast track
services) would contribute with AED 60 Mn to revenues.
Combining these additional revenues together and deducting them AED 1,267 Mn yields the funded mandate of AED 322 Mn to treat 1.8 Mn visits.
–
Note: Funded mandate is government funding for services which serve the public good and typically do not generate financial returns, e.g., vaccinations,
–
healthcare provision in remote areas.
Aggressive scenario:
In 2025, under the ‘as-it-is’ scenario, DHA PHCs would incur a spending of AED 1,562 Mn to treat 2 Mn visits.
–
By implementing the strategy in the aggressive scenario, DHA PHCs would save AED 149 Mn from increasing staff operational efficiencies and AED 84
–
Mn from implementing teleconsultations. As a trade-off, DHA PHCs would have to incur AED 55 Mn to implement the initiatives of the strategy. This
yields a true spend of AED 1,385 Mn.
However, by treating more privately insured patients, DHA PHCs will be able to collect AED 319 Mn from private patients. A further AED 734 Mn would
–
be yielded from government insured patients; and additionally, the introduction of value-add services for a few (e.g., blood collection at home, fast track
services) would contribute with AED 89 Mn to revenues.
Combining these additional revenues together and deducting them AED 1,562 Mn yields the funded mandate of AED 243 Mn to treat 2 Mn visits.
–
Note: Funded mandate is government funding for services which serve the public good and typically do not generate financial returns, e.g., vaccinations,
–
healthcare provision in remote areas.
49
50. The government funded mandate will be reduced to ~326 Mn through the levers of the strategy
Excel: Sheet ‘Target State’ and ‘Levers’Expected spending of DHA PHCs – 2025 strategy (conservative)
(in Million AED; 2025)
Revenues
Costs
1,267
151
502)
80
106
1,4021)
Cost savings
from increased
staff productivity
2025 PHC
spending
1,800k visits
734
322
Govt funded
mandate
60
Revenue
from valueadd services
Revenue from
govt insurance
Revenue from
private health
insurance/
OOP patients
Revised 2025
PHC spending
Additional
cost needed
for strategy
Cost savings
from teleconsultations
Double click on graphs
to open Excel
Sources: Dubai health statistics report, SALAMA, C and D inclusion proposal, Strategy& analysis
1) 1,402 Mn AED represents costs of 1,800k visits if the strategy is not yet implemented, i.e., if efficiencies are not yet realized and additional revenues are not yet generated
2) Cost of the strategy represents the total cost incurred to implement all initiatives, see slides 55 and 79 for break-down of costs
50
51. Improved staff productivity will lead to ~106 Mn annual savings in 2025 for the PHC spending
Excel: Sheet ‘Levers’Expected benefits for DHA PHCs – Target state
(in Million AED; 2025)
Comments
Cost savings from increased staff productivity
337
Current utilization of Family Physicians: 17 visits/ day (as per
SALAMA)
Target utilization of Family Physicians: 25 visits/ day
(benchmarks from Norway, Canada, UK, US, Switzerland)
-105
232
Productivity increased through increased adoption of
technology, performance management framework
Current nurse to FP ratio: 1.88 (as per SALAMA)
Target nurse to FP ratio: 2.15 (as per NHS benchmarks)
Nurse/ FP ratio improved through task shifting
Changes applied to manpower costs in 2025, resulting in saving
of AED 105 Mn
Manpower costs in 2025 as
per target utilization
Sources: Dubai health statistics report, SALAMA, Euromonitor, Dubai Health Investment Guide, Expert input, Strategy& analysis
51
Double click on graphs
to open Excel
Manpower costs in 2025 as
per current utilization
52. In addition, the adoption of telehealth generates a saving of 80 Mn in 2015
Excel: Sheet ‘Levers’Cost saving from adoption of telehealth – Target state
(in Million AED; 2025)
Comments
Cost savings from adoption of telehealth
Population survey indicated that ~40% of patients are
interested in using video consultation
Estimations assume gradual increase of telehealth
adoption to 10% over 6 years (equals 180k visits out of
total 1,8 Mn visits)
88
141
Revenues from
treating 180k
visits in PHCs
Cost of
treating 180k
visits in PHCs
80
Treating 180k patients in PHCs would cost 141 Mn (based
on avg. cost of 780 AED per visit)
27
Revenues from 180k visits in PHCs would equal 88 Mn
(based on avg. revenue of 490 AED per visit)
Difference in costs and foregone revenue (55 Mn) in
addition to 27 Mn revenue from 180k teleconsultations
(with avg. consultation bill of 150 AED) makes up total
benefit of 80 Mn
52
Savings
Revenue from
video
consultation1)
1) To be provided through subscription to external provider (who provides services through own DHA licensed doctors); revenue of 27 Mn AED is a result of estimated number
of telehealth visits (180k) multiplied by the average consultation bill (of 150 AED)
Sources: Strategy& analysis
Double click on graphs
to open Excel
53. Revenues from privately insured and out of pocket patients amount to AED 151 Mn, ~17% of total revenues
Revenues per insurance type – 2025 strategy (conservative)Excel: Sheet ‘Levers’
Total revenue, # of visits, revenue and cost per single visit per insurance type (excluding revenues from value-add
services and excluding telehealth consultations)
Cost per single
visit (AED)
Revenue per single
visit (AED)
# of visits
381
491
35,000
381
491
Total revenue (in Mn)
885
6,000
755
814
159,000
755
513
1,430,000
C and D patients
17
(2%)
B (lower range)
4
(<1%)
A, B (upper range) and OOP
130
(15%)
Govt insured
734
(83%)
2025
53
Sources: Dubai health statistics report, SALAMA, Euromonitor, Dubai Health Investment Guide, Expert input, Strategy& analysis
Note: Additional 180k visits are provided via tele-consultation
Double click on graphs
to open Excel
54. Revenues from value-add services will amount to an additional 60 Mn
Expected benefits for DHA PHCs – Target stateExcel: Sheet ‘Levers’
(in Million AED; 2025)
Comments
Revenue from providing additional services
60
The population survey indicated that 64% of the Dubai
population is willing to pay for ancillary services at home
(73% of the Emirati respondents)
Ancillary services at home are priced at AED 120, in line with
international benchmarks
18
Using a conservative approach, the adoption rate for ancillary
services is expected to reach 15% over the next 6 years,
yielding a revenue of ~40 Mn
42
Fast track consultation services are priced at AED 50 (in line
with international benchmarks of USD 10-20)
Fast track consultation is expected to reach an adoption rate
of 15% over 6 years, in line with international benchmarks of
15-20% adoption rates
2025
Fast-track consultation
Ancillary services at home
Sources: Dubai health statistics report, SALAMA, Euromonitor, Dubai Health Investment Guide, Expert input, Strategy& analysis
54
Double click on graphs
to open Excel
55. Identified initiatives are associated with a total cost of ~50 Mn and contribute to benefits of 394 Mn
Costs and benefits of initiativesExcel: Sheet ‘Initiative Costing’
4
0.8
3
2
1
5.3
0.7
Initiatives costs
8.1
2.7
17.2
8.4
Total spend
PCMH
standards
Patient-centric KPIs
Access to B,C,D
Optimized DFA
Collaboration with
other stakeholders
Cost: ~1 Mn
Qualitative
benefits
Valueadded
service
Cash
with
vaccinations
Extended
service
offerings
Cost: ~8 Mn
Benefit: ~60 Mn
(from value-added
services)
Task
shifting
Telehealth
Process
tech
Appointment scheduling system
Optimized utilization of staff
Employee performance management
Shift from block-funding to claims-based
funding
Cost: ~9 Mn
Benefit: ~106 Mn
(from operational
efficiency)
Cost: ~17 Mn
Benefit: ~80 Mn
(from telehealth)
2.4
Tech. for
treatment
Expanded
service
offering
4.9
Promotion
of PHCs
Designated Family Physician
Incentives to promote PHC as
entry point
Additional PHCs
No new
costs1)
5
50.4
Cost: ~16 Mn
Benefit: ~151 Mn
(from privately insured/
cash patients)
Total benefit: 394 Mn
55
1) Costs are already approved as on-going or planned initiatives
Sources: SALAMA, Dubai Statistic Report, RCM, DHA statistics team, Strategy& analysis
Double click on graphs
to open Excel
56. In addition to the increased access to care and value for money, the strategy will provide a range of non-financial benefits
Non-financial benefits of the primary care strategyCare will be more convenient given the appointment
system, lower waiting times, extended opening hours
and the use of technology
Convenience
Quality of care will further
improve given the training of
caregivers, KPIs, and new
standards/ regulations
Elevated quality
of care
Registration with a family physician and
the physician performance framework will
ensure a strong doctor-patient
relationship based on trust
56
Strong
relationship
(trust) with
caregiver
Empowerment
PATIENT
HAPPINESS
A positive
experience
Patients will be empowered to
pick their doctor, understand
their treatment options,
provide feedback
The digital patient journey and
integrated continuum of care will
create a positive experience for the
patients and families
57. Financial impact explanation notes
Referring to slides 58, 66Expected government funded mandate for DHA PHCs
Conservative scenario:
Under an ‘as it is’ scenario, DHA PHCs’ funded mandate will grow at rate of 10% annually. This results from compounding the normal growth in visits of
–
5% annually with the inflation of 2% annually (compounded rate of 10% annually). In 2025, DHA PHCs would treat 1.4 Mn visits and require a funded
mandate of AED 392 Mn.
By implementing the strategy, DHA PHCs will be able to close the gap between the costs and revenues and decrease the funded mandate growth rate to
–
7% annually (in comparison to 10% annually in the ‘as it is’ scenario) In 2025, DHA PHCs would treat 1.8 Mn visits and require a funded mandate of AED
322 Mn.
In order to achieve this decrease in funded mandate, DHA PHCs would have to invest to implement the strategy. This is represented by the “bump” on the
–
green curve in 2019 (AED 23 Mn).
Aggressive scenario:
Under an ‘as it is’ scenario, DHA PHCs’ funded mandate will grow at rate of 10% annually. This results from compounding the normal growth in visits of
–
5% annually with the inflation of 2% annually (compounded rate of 10% annually). In 2025, DHA PHCs would treat 1.4 Mn visits and require a funded
mandate of AED 392 Mn.
By implementing the strategy, DHA PHCs will be able to close the gap between the costs and revenues and decrease the funded mandate growth rate to
–
3.5% annually (in comparison to 10% annually in the ‘as it is’ scenario) In 2025, DHA PHCs would treat 2 Mn visits and require a funded mandate of AED
243 Mn.
In order to achieve this decrease in funded mandate, DHA PHCs would have to invest to implement the strategy. This is represented by a “bump” on the
–
green curve in 2019 (AED 22 Mn).
57
58. In summary, the strategy increases outreach and patient happiness, and achieves a reduction in the funded mandate
Government funded mandate evolution – 'as-it-is' v/s strategy (conservative)Expected government funded mandate for DHA PHCs
Number of
visits (‘k)
CAGR %
1,400
10%
(in Million AED; 2017 - 2025)
392
400
PHC govt. subsidy in status quo scenario
PHC govt. subsidy in strategy scenario
350
1,800
7%
322
298
Peak in funded mandate represents
required investment to implement the
Primary Care strategy
269
300
250
+23
200
150
2017
2018
2017
2019
2018
2020
2019
2021
2020
2022
2021
2023
2022
2024
2023
2025
2024
2025
Sources: SALAMA, Dubai Statistic Report, RCM, DHA statistics team, Strategy& analysis
58
Excel: Sheet ‘Target State’ and ‘Levers’
Double click on graphs
to open Excel
59. The strategy will increase revenue per visit and decrease cost per visit, thus pulling the govt. funded mandate down
Revenues and costs per visitExcel: Sheet ‘Target State’ and ‘Levers’
Summary of financial impact
(per patient, in AED; 2017 - 2025)
-268
-181
783
783
-121
# of visits
Revenues per visit
Govt funded
#
mandate
Costs per visit
-188
692
692
706
706
563
563
#
571
571
514
514
525
525
2025 - strategy
(aggressive)
2025 - Strategy
(conservative)
2025 - Status quo
2017 - Current State
2,000k
1,800k
1,460k
1,000k
374
374
59
Double click on graphs
to open Excel
60. Our ask is for an additional budget of AED 25 Mn for 2019, in order to deliver the strategy
Key asks and promisesOur ask for 2019 is to:
increase the primary care budget by 10% in line with historical years –
grant an additional ~23 Mn AED as an 'investment' to deliver the strategy –
We will use the investment to:
make staff more productive (no firing of staff) and introduce world class technology –
promote DHA PHCs to generate revenue from private insurance/ out of pocket patients –
Improve the patient journey and experience in our clinics –
In return our commitment is that:
The investment will be paid back in 2022 –
The annual growth in future government funded mandate will decrease from the historical 10%, to –
around 7% annually for the coming 5 years
The number of patients will almost double as we will serve ~1.8 Mn visits by 2025 instead of the –
current ~1 Mn
Patients will be happier –
60
61. In more aggressive scenario, we convert more A&B patients and double-down on manpower efficiency
In more aggressive scenario, we convert more A&B patients anddouble-down on manpower efficiency
Aggressive scenario assumptions
Excel: Sheet ‘Target State’ and ‘Levers’
Aggressive scenario
Conservative scenario
Patient conversion
Patient conversion
Optimistic conversion of privately insured A&B patients
(25% from the total addressable pool of patients in 2025)
Conservative conversion of privately insured A&B patients
(~8% from total addressable pool of patients in 2025)
15% adoption rate of value-add services
28 visits per family physician per day
10% adoption rate of value-add services
25 visits per family physician per day
75% reach of Dubai population for marketing campaigns
15 reaches per year per capita for marketing campaign
100% reach of Dubai population for marketing campaigns
20 reaches per year per capita for marketing campaign
9 calls per hour per operator in the helpline
6 calls per hour per operator in the helpline
Initiative levers:
Initiative costing:
61
Initiative levers:
Initiative costing:
62. The strategy will improve access to care and value for money, to lower the government funded mandate
PHC metrics (2025 'as-it-is' scenario v/s 2025 strategy scenario) - aggressiveOutreach
Manpower/ Productivity
1,400
2,595
2,100
641
Daily visits/FP
Daily visits/FP
Employees
2025 strategy
2025 ’as-it-is’
All staff
+11%
1,385
1,142
+243
1,199
2025 strategy
2025 ’as-it-is’
Nurses
62
Revenues
2025 strategy
#
298
1,656
1,199
2025 strategy
Virtual Visits (only headache clinics)
752
Spending
2025 ’as-it-is’
25
Private and OOP revenue
62
99%
1%
Revenues
2025 ’as-it-is’
1,460,000
2025 ’as-it-is’
Face to Face Visits
Waiting Time
1,143
+392
28.0
17.6
2,000,000
90%
Family Physician
Financials (AED Mn)
64%
42
Spending
2025 strategy
31410%
298
588
1,656
36%
Govt funded
mandate
314
28.0
17.6
+37%
+24%
+59%
-40%
42
2025 strategy
25
2025 ’as-it-is’
Govt revenue
Note: All numbers exclude dental as it is being covered under a separate strategy. 2018 financial data is not yet finalized, hence 2017 is the latest available year for all metrics
Sources: Dubai health statistics report, SALAMA, PHC business development and projects; Strategy& analysis
Excel: Sheet ‘Target State’ and ‘Levers’
Double click on graphs
to open Excel
63. The government funded mandate will be reduced to ~245 Mn through the levers of the strategy
Excel: Sheet ‘Target State’ and ‘Levers’Expected spending of DHA PHCs – 2025 strategy (aggressive)
(in Million AED; 2025)
Revenues
Costs
1,385
55
84
Revised 2025
target state
spending
Additional
cost needed
for strategy
Cost savings
from teleconsultations
149
1,562
319
734
243
Govt funded
mandate
89
Revenue
from valueadd services
Revenue from
govt insurance
Revenue from
private health
insurance/
OOP patients
Sources: Dubai health statistics report, SALAMA, Euromonitor, Dubai Health Investment Guide
63
Double click on graphs
to open Excel
Cost savings
2025 target
from increased state spending
staff productivity 2,000k visits
64. Revenues from privately insured and out of pocket patients amount to AED 319 Mn, ~30% of total revenues
Revenues per insurance type – 2025 strategy (aggressive)Excel: Sheet ‘Levers’
Total revenue, # of visits, revenue and cost per single visit per insurance type (excluding revenues from value-add
services and excluding telehealth consultations)
Cost per single
visit (AED)
Revenue per single
visit (AED)
# of visits
370
491
35,000
Total revenue (in Mn)
1,053
C and D
B (lower range)
370
491
6,000
732
868
343,000
732
513
1,430,000
17
(2%)
4
(<1%)
A, B (upper range) and OOP
298
(28%)
Govt insured
734
(70%)
2025
64
Sources: Dubai health statistics report, SALAMA, Euromonitor, Dubai Health Investment Guide, Expert input, Strategy& analysis
Note: Additional 180k visits are provided via tele-consultation
Double click on graphs
to open Excel
65. The strategy will increase revenue per visit and decrease cost per visit, thus pulling the govt. funded mandate down
Revenues and costs per visitExcel: Sheet ‘Target State’ and ‘Levers’
Summary of financial impact
(per patient, in AED; 2017 - 2025)
-268
-181
783
783
-121
# of visits
Revenues per visit
514
514
Govt funded
#
mandate
Costs per visit
-188
692
692
706
706
563
563
#
525
525
571
571
374
374
65
2025 - strategy
(aggressive)
2025 - Strategy
(conservative)
2025 - ’As-it-is’
2017 - Current State
2,000k
1,800k
1,460k
1,000k
Double click on graphs
to open Excel
66. In summary, the strategy increases outreach and patient happiness, and achieves a reduction in the funded mandate
Government funded mandate evolution – 'as-it-is' v/s strategy (aggressive)Expected government funded mandate for DHA PHCs
Number of
visits (‘k)
CAGR %
1,400
10%
(in Million AED; 2017 - 2025)
392
400
PHC govt. subsidy in ’as-it-is’ scenario
PHC govt. subsidy in strategy scenario
350
272
243
2,000
250
Peak in funded mandate represents
required investment to implement the
Primary Care strategy
300
246
254
3.5%
250
+22
224
207
188
200
150
Sources: SALAMA, Dubai Statistic Report, RCM, DHA statistics team, Strategy& analysis
66
Excel: Sheet ‘Target State’ and ‘Levers’
Double click on graphs
to open Excel
67. Yearly view on Primary Care key metrics
Key metrics 2019- 2025Excel: Sheet ‘Target State’ and ‘Levers’
2025
2024
2023
1,365
1,267
2021
1,184
2020
2019
1,813
1,626
181
111
293
272
258
248
241
235
209
630
586
555
533
518
506
392
25.0
23.8
22.6
21.5
20.5
19.5
17.6
1,267
1,106
980
894
820
748
674
945
802
691
626
564
505
429
322
304
289
269
256
243
67
1,481
2022
1,053
245
Unit
Initiative
Visits (in ‘000s)
Number of total visits
Visits (in ‘000s)
Number of teleconsultations
FTEs
Number of family
physicians
FTEs
Number of nurses
Visits per FP per day
Physicians utilization
AED ‘Mn
Total spending
AED ‘Mn
Total revenue
AED ‘Mn
Govt funded mandate
68. Methodology and assumptions used for initiative costing
Excel: Sheet ‘Initiative Costing’∑ Benefit:
151 Mn
∑Cost:
16 Mn
#13: Technology for
diagnosis & treatment
#5: Expanded service
offering
#1: Promotion of
PHCs
1
Initiatives
#1: Promote PHCs by signaling high quality of services and staff to patients
68
Assumptions
Number of campaigns: 1 in 2019; 2 in 2020, 1 per year from 2019 to 2025
Cost of designing campaign content: AED 500k (630k in 2025 due to inflation)
Cost of public campaign execution depends on population size (Dubai population 3.2 Mn in 2019 and 4.2 Mn forecasted in 2015)
We will target age categories from 20 years to 60+ years:
[21-30]: 30%
–
[31-40]: 38%
–
[41-50]: 21%
–
[51-60]: 8%
–
[60+]: 3%
–
Target frequency to play the campaigns: 20 times (this means that the audience is exposed to the campaign 20 times on average, e.g., through
consistently showing an ad on social media, publishing an article in a weekly magazine etc.)
Spend for every 1000 members in the population: AED 40 for frequency of 1, AED 800 for frequency of 20 in 2019; AED 51 for frequency of 1, AED
1,020 for frequency of 20 in 2025 due to inflation
Spend in 2025 is sum of AED 630k for campaign development and AED 4.2 Mn for campaign execution
Total cost: AED 4.9 Mn
69. Methodology and assumptions used for initiative costing
Excel: Sheet ‘Initiative Costing’∑ Benefit:
151 Mn
∑Cost:
16 Mn
#13: Technology for
diagnosis & treatment
#5: Expanded service
offering
#1: Promotion of PHCs
Initiatives
1
Postnatal Care
Number of pregnant women receiving treatment at the PHCs: 6,925 in 2018
Number of pregnant women to receive care assuming population growth: 11,000 in 2025
Number of postnatal home visits per hour: 1 assuming 20-30 minutes consultation time and travel time
Number of hours per shift: 7
Number of working days per year: 200
Number of visits per year: 1,400
Required number of FTE nurses in 2025: 8.0
Compensation of 1 FTE nurse: AED 148k in 2025
Overhead costs ratio to salaries spend: 25%
Spend on salaries: AED 1,200k in 2025
Yearly overhead costs: AED 300k in 2025
Total spend in 2025: AED 1,500k
Adolescents Health
Equipment cost to set up 1 adolescent clinic: AED 130,000k (based on ncbi benchmarks)
Number of adolescents clinics: 3 in 2019 assuming coverage of 25% within all centers
Share of population aged 10-18: 7.7%
Share of adolescents suffering from mental health problems: 20% (WHO benchmarks)
Diagnosis rate: 36% (regional benchmarks)
Share of cases which are treatable in Primary Care: 20%
69
Assumptions
#5: Expand service offering to include postnatal care & adolescent health; increase mental health
70. Methodology and assumptions used for initiative costing
Excel: Sheet ‘Initiative Costing’∑ Benefit:
151 Mn
∑Cost:
16 Mn
#13: Technology for
diagnosis & treatment
#5: Expanded service
offering
#1: Promotion of PHCs
1
Initiatives
Adolescents Health (cont’d)
Number of eligible patients in 2019: 300
Total annual visits assuming 4 visits per patient: 2,100 visits in 2025
Duration of adolescent health consultation: 30 minutes
Number of hours per shift: 7
Number of working days per year: 200
Number of consultations per year: 2,800
Number of required FP FTEs: 1.5 in 2025
Annual cost of FPs: 690k in 2025
Number of Nurses FTE required per FP: 0.3
Number of required Nurse FTEs: 0.46 in 2025
Average salary of a Nurse FTE: AED 85k
Annual cost of Nurses: AED 70k in 2025
Total salary cost: AED 760k in 2025
Overhead costs ratio to salaries: 25%
Total spend in 2025: AED 950k
Mental Health (costs already covered in Mental Health strategy – no additional costs)
Total cost of initiative: AED 2.4 Mn
70
Assumptions
#5: Expand service offering to include postnatal care & adolescent health; increase mental health
71. Methodology and assumptions used for initiative costing
Excel: Sheet ‘Initiative Costing’∑ Benefit:
151 Mn
∑Cost:
16 Mn
#13: Technology for
diag. & treatment
#5: Expanded service
offering
#1: Promotion of PHCs
Initiatives
1
#13: Strengthen adoption of technology for diagnosis and treatment
Technology 2: Cancer diagnostics
Cost of diagnostic/ analytics solution in benchmarks: 10,000,000 USD (Tri-health in the U.S)
Number of facilities served: 140 facilities (Tri-health in the U.S)
Calculated cost per facility: 70k USD
Number of PHCs to apply solutions: 6 (6 PHCs with breast cancer screening available)
Total cost for DHA PHCs: 430k USD
Exchange rate: 3.67 AED per USD (assuming constant exchange rate)
Total cost for diagnostic/ analytics solution in 2025: 2,000k AED
Technology 3: Remote patient monitoring
Average cost of telehealth per patient per year: 150 AED (190 AED in 2025)
Average number of consultations per patient per year: 2
Average cost per telehealth consultation per year: 75 AED
Number of consultations at home: 1 consultation every 2 weeks
Average number of yearly consultations per year: 26
71
Assumptions
Technology 1: Symptom checker
Cost of adjusting symptom checker apps to local markets: 150k – 200k EUR (as quoted from current service providers ada and babylon)
Exchange Rate: 4.14 – 4.81 AED per EUR
Cost of adjusting symptom checker apps to local markets 620k – 960k AED in 2019 as a one-off investment (involves cost of developers and
medical team for piloting)
72. Methodology and assumptions used for initiative costing
Excel: Sheet ‘Initiative Costing’∑ Benefit:
151 Mn
∑Cost:
16 Mn
#13: Technology for
diag. & treatment
#5: Expanded service
offering
#1: Promotion of PHCs
Initiatives
1
Technology 3: Remote patient monitoring (cont’d)
Discount rate on telehealth consultation: 40%
Total cost of home monitoring per patient per year: 3,000k in 2025
Number of people above the age of 65: 34,500 (statistical yearbook report)
Share of people above the age of 65: 1.1% (taking the Dubai population in year 2019 to be ~3.08 Mn)
Number of patients above the age 65: 10,500 patients in the year 2019
Share of patient s requiring home monitoring: 20% (expert input)
Share of other patients (chronically ill, disabled, etc.): 20%
Total number of patients requiring home monitoring : 2,000k patients in 2025
Cost to treat 2,000k patients: 6,400k AED in 2025
Total cost of technology: AED 8.4 Mn
72
Assumptions
13: Strengthen adoption of technology for diagnosis and treatment
73. Methodology and assumptions used for initiative costing
Excel: Sheet ‘Initiative Costing’∑ Benefit:
80 Mn
∑Cost:
17 Mn
#15: Telehealth
2
Initiatives
Average cost of telehealth per patient per year: 150 AED (provider input)
Average number of consultations per patient per year: 2
Average cost per telehealth consultation per year: 75 AED (95 AED in 2025)
Expected adoption rate of telehealth consultation: 10% of all visits by 2025 (as per benchmarks)
Expected number of telehealth visits: 180k in 2025
Total cost: AED 17 Mn
73
Assumptions
#15: Implement telehealth service offering within PHCs
74. Methodology and assumptions used for initiative costing
Excel: Sheet ‘Initiative Costing’∑ Benefit:
106 Mn
∑Cost:
12 Mn
#9: Extended opening
hours
#18: Task shifting
#10: Triage system
#16: Process
technology
3
Initiatives
Technology 1: Activation of MyChart features
Cost of subscribing one patient to MyChart app: 13.85 AED (as per DHA IT team)
Number of govt.-insured patients in 2025: 470k
Expected adoption rate of MyChart: Phased adoption at a rate of 1% in 2019 and 25% in 2025 (validated with expert input)
Cost of patient adoption: 2,000k (assuming there is no capped fee with EPIC)
Cost of activation: 500,000 AED in 2019
Total cost of MyChart features in 2025: 2,000k
Technology 2: Self-service vital checker
Yearly cost of operating a self-service vital checker: 8,800 USD
Number of PHCs: 12 centers in 2019 and grows to 16 centers in 2025 (approval to establish 4 new centers)
Total cost of self service vital checker for 16 centers in 2025: 178k USD
Exchange rate: 3.67 (assuming constant exchange rate)
Total cost of self service vital checker: 700k in 2025
Total cost of process technology: AED 2.7 Mn
74
Assumptions
#16: Leverage technology to increase convenience and speed in PHC processes
75. Methodology and assumptions used for initiative costing
Excel: Sheet ‘Initiative Costing’∑ Benefit:
106 Mn
∑Cost:
12 Mn
#9: Extended opening
hours
#18: Task shifting
#10: Triage system
#16: Process
technology
3
Initiatives
Share of eligible family physicians for task-shifting: 80% (share of female physicians)
Number of total available family physicians: 300 FPs (as calculated in the operational efficiencies requirements for visits forecast)
Share of eligible family physicians for task-shifting: 240 FPs
Cost of training per family physician: ~18,500 AED (as received from the training department and inflated to 2025)
Phase in of physicians training to train at most 100 physicians per year (~ 25 in each quarter)
Share of eligible family physicians for task-shifting: 100%
Number of total available nurses: 646 FPs (as calculated in the operational efficiencies requirements for visits forecast)
Cost of training per nurse: ~7,000 AED (as received from the training department and inflated to 2025)
Phase in of nurses training to train at most 100 nurses per year (~ 25 in each quarter)
Number of physicians to be trained in 2025: 19
Number of nurses to be trained in 2025: 25
Total cost: AED ~0.7 Mn
75
Assumptions
#18: Conduct “task-shifting” from specialists to family physicians and family physicians to allied staff
76. Methodology and assumptions used for initiative costing
Excel: Sheet ‘Initiative Costing’∑ Benefit:
106 Mn
∑Cost:
12 Mn
#9: Extended opening
hours
#18: Task shifting
#10: Triage system
#16: Process
technology
3
Initiatives
Number of FP FTEs working in NAH extended hours: 8 (DHA PHC statistics team, SALMA)
Number of FP FTEs working in Al Barsha extended hours: 12 (DHA PHC statistics team, SALMA)
Average number of nurses to FPs: 1.87 (Calculated from SALMA)
Number of nurses FTEs working in NAH extended hours: 15 (calculation: 8 x1.87)
Number of nurses FTEs working in Al Barsha extended hours: 22 (calculation: 12 x1.87)
Average compensation of a FP FTE: 450,000 AED (Al Qusais PHC HR costing proposal)
Average compensation of a nurse FTE: ~150,000 AED (Al Qusais PHC HR costing proposal)
Duration of current extended hours: 10 hours (calculation: 24 hours minus 2 shifts of 7 hours)
Duration of future extended hours: 5 hours (the center will be closed from 2:30am to 7:30 am)
Average number of FP FTEs required per center: (5 hours/ 10 hours) * (8 + 12)/2 = 5 FTEs
Average number of nurses FTEs required per center: 5 * 1.87 = 9 FTEs
Average bonus compensation for working extended hours: AED 30,000 (AED 2,000 per month today and inflation effect)
Salaries cost to run extended hours services for one center: ~2.05 Mn AED
Salaries cost to run extended hours services in the projected 2 centers: ~4.1 Mn AED
Overhead costs as % of salaries: 30% (estimated from current DHA PHC budget breakdown)
Total overhead costs for 2 centers: ~1.2 Mn
Total cost: ~ AED 5.3 Mn
76
Assumptions
#9: Adapt extended opening hours for urgent care services
77. Methodology and assumptions used for initiative costing
Excel: Sheet ‘Initiative Costing’∑ Benefit:
60 Mn
∑Cost: 8
Mn
#22: Value-adding
services
Initiatives
4
Fast track services
Cost of implementing fast-track services: 0 – patients who opt for fast track will be served with current resources and prioritized over other non
urgent cases
Blood collection at home
Total number of in-person visits: ~1,62 Mn (as forecasted in the strategy and excluding tele-consultation visits)
Adoption rate: 15% (phased in from 1% in 2020 – 60% of survey respondents were in favor of receiving such services at home)
Number of blood collection at home: ~250k
Number of visits per hour per nurse FTE: 4 visits
Working hours per day: 7 hours
Number of working days per year: 200 days
Number of visits per year: 5,600 visits
Required number of nurses: ~45 nurses
Average compensation per nurse: ~150k AED (as received from al Gusais HR manual and grown by inflation)
Total compensation for nurse: ~6.6 Mn
Overhead costs percentage: 25% (includes transportation cost)
Overhead costs: 1.5 Mn
Total cost: AED 8.1 Mn
77
Assumptions
#22: Assess options to introduce value-adding services for a fee
78. Methodology and assumptions used for initiative costing
Excel: Sheet ‘Initiative Costing’Qualitative
benefits
∑Cost:
<1 Mn
#4: PHCMH standards
5
Initiatives
Introductory course training cost: AED 4600 (USD 1250 as per NCQA)
Advanced course training cost: AED 4000
Number of Family Physicians to be trained: 209 in 2019
Number of Nurses to be trained: 392 in 2019
Total training cost (assuming Nurses only receive introductory courses, FPs receive introductory and advanced courses): AED 3,600k
Registration cost: AED 5505 multi-site one-off fee
Initial recognition fee - 1-12 FPs: AED 918
Initial recognition fee - 13+ FPs: 92
Recognition threshold: 12 FP
Total recognition cost based on number of FP per center: AED 125k
Total one-off spend in 2019 is sum of total training cost and total recognition cost: AED 3,700k
78
Assumptions
#4: Establish patient-centered medical home (PHCMH) standards
79. Yearly view on Primary Care initiative costs
Initiative costs 2019 - 2025 (AED Mn)Excel: Sheet ‘Initiative Costing’
2025
4.9
2024
4.5
2023
4.1
2022
3.8
2021
3.5
2020
3.7
2019
Promote PHCs by signalling high quality
of services and staff
3.0
2.4
2.1
1.9
1.7
1.6
1.5
1.6
8.4
7.5
6.7
6.3
5.9
5.4
5.6
17.2
14.1
11.7
5.8
2.2
0.9
0.5
2.7
1.8
1.2
0.9
0.7
0.6
0.9
0.7
0.5
0.3
0.6
1.5
2.4
2.3
5.3
5.1
4.9
4.8
4.6
4.4
4.2
8.1
4.5
2.5
1.5
0.9
0.5
0.3
0.8
0.6
0.5
0.4
0.3
1.0
3.8
Initiative
Expand service offering (postnatal. adolescents.
mental health)
Strengthen technology adoption for diagnosis &
treatment
Implement telehealth offering within PHCs
Leverage technology for PHC processes
Conduct ‘task-shifting’ (for physicians and nurses
50.5
79
40.7
33.8
25.8
21.2
20.4
Adapt extended opening hours for urgent care
services
Assess options to introduce value-adding services for
a fee
Establish patient-centred medical home (PHCMH)
standards
22.2
∑
80. Table of Contents
Strategy PlanPatient Journeys
Initiatives for Implementation
Business Case/ Financial Impact
Performance monitoring framework
Stakeholder map, change mgmt. and program mgmt.
Risk Analysis
Appendix
80
81. 21 Primary Care KPIs were shortlisted across identified strategic themes
Shortlisted KPIs (1/3)Data Source
Description
Population survey % of population aware of Primary Care services
EMR
% of patients who had their follow up visit at the PHC after
being referred to secondary care
KPI
#
Strategic Theme
Population
awareness
1
Awareness and
Coordination
Secondary care
continuity
2
Hospital specialist
reports
% of patients who access specialist care without referral
Non-referred
specialist patients
3
Patient survey,
Population survey
% of patients who responded positively to the overall
experience of their FP consultation
Satisfaction with
FP consultation
experience
4
% of patients who believed their FP was trusted, attentive, Patient-physician
caring, and inclusive in the plan of care
relationship
5
Patient survey,
Population survey
81
82. 21 Primary Care KPIs were shortlisted across identified strategic themes (Cont’d)
Shortlisted KPIs (2/3)Data Source
Description
HR system/ data
Appointment
sys. report
KPI
FP per 10,000 population
% of patients accessing FP through appointments
FP availability
Appointment
sys. adoption
#
Strategic Theme
6
Access and
Availability
7
EMR
Waiting time for receiving an appointment for a consultation
Appointment
waiting time
8
EMR
Waiting time from patient check-in to FP consultation start
Consultation
waiting time
9
EMR
% of patients who received a mental health screening (e.g.,
PHQ-9 screening)
Mental health
screening
10
EMR
% of patients between 13 and 19 years old who received care
at the adolescents clinic
Adolescent clinic
update
11
EMR
% of pregnant clients who received post-natal care
Post-natal care
uptake
12
Triage report
% of walk-in patients triaged in PHCs
Use of triage
13
Hospital ER
reports
82
% of level 4 and 5 patients being diagnosed in the emergency
room
Non-ER cases in
ER setting
14
83. 21 Primary Care KPIs were shortlisted across identified strategic themes (Cont’d)
Shortlisted KPIs (3/3)Data Source
Description
KPI
#
Strategic Theme
Innovation
EMR
% of patients using digital pre-check in to PHCs
Innovation
adoption rate
15
EMR
% of tele-health consultations out of total consultations
Tele-health
adoption
16
DFA report
% of initiatives from Dubai Future Accelerator piloted in
Primary Care
DHA piloting
17
EMR, HR system
report
Number of visits per Family Physician per day
Staff utilization
18
Specialization
rate
19
HR/ fellowship
reports
EMR, value added
services report
% of FP with specialty fellowships
Value added
% of adopted value added services out of value added service
services
catalogue
penetration
Internal reports Number of joint public health management programs
83
Public health
collaboration
Value and
Efficiency
20
21
Integration
84. KPI #1: % of population aware of Primary Care services
KPI explanation cardAwareness and
Coordination
Educated, cultured and healthy individuals
1
Dubai Plan theme
Direct resources to ensure healthy and safe environment
2
DHA strategic objective
Share of people who attend regular check-ups out of total population
M.1.0093
Dubai Plan KPIS
Share of patients who receive care at the ERs without needing it out of total ER patients
O.1.0543
Dubai Plan KPIS
Program 4
Themes
Health centers
department
Owner
suggested
The intent of this KPI is to measure the level of awareness of people
around Primary Care services


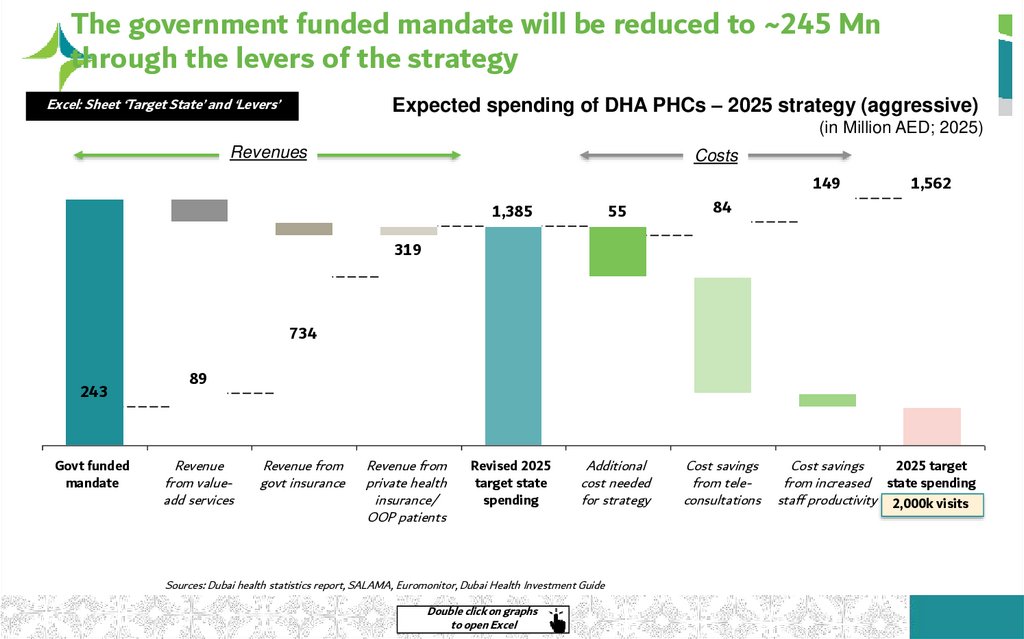
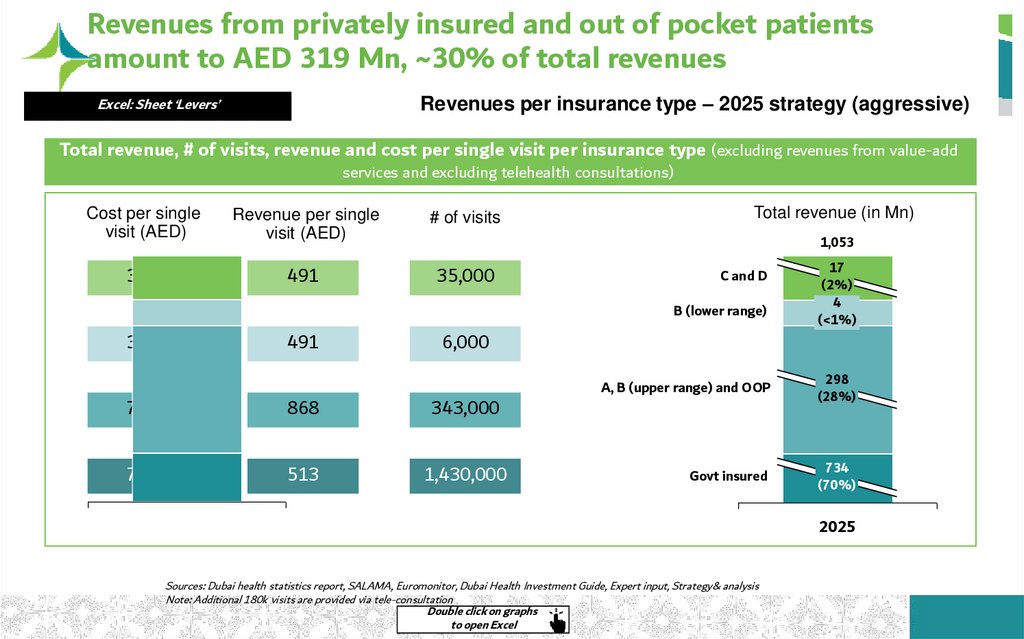
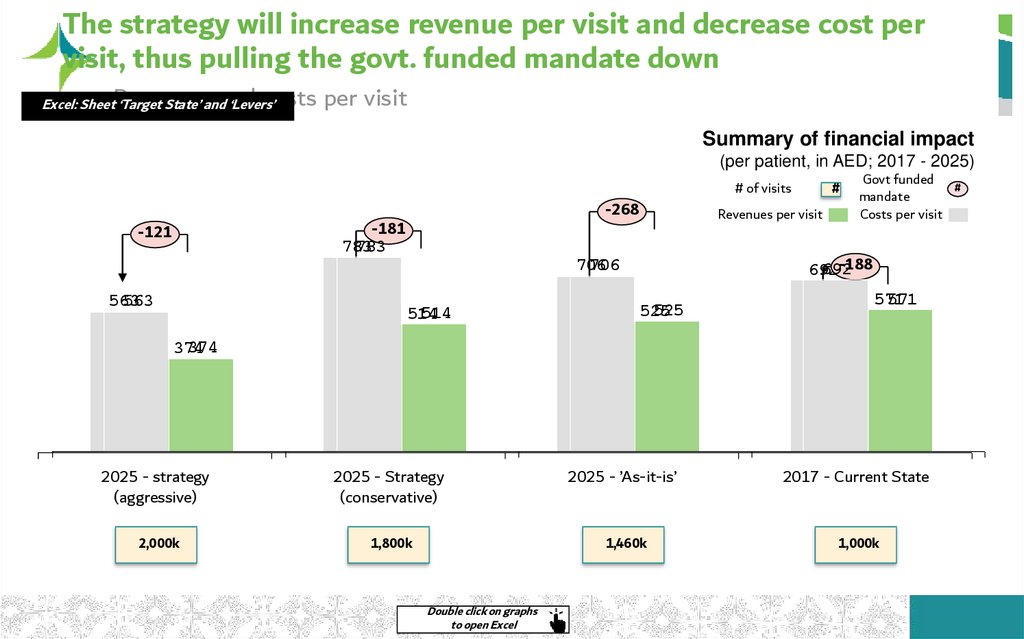

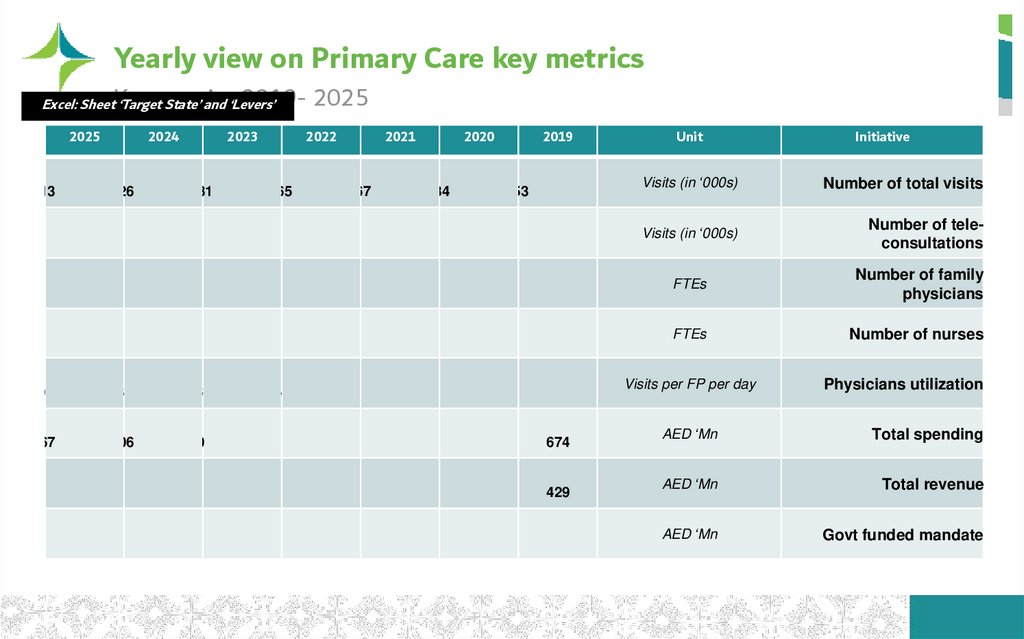
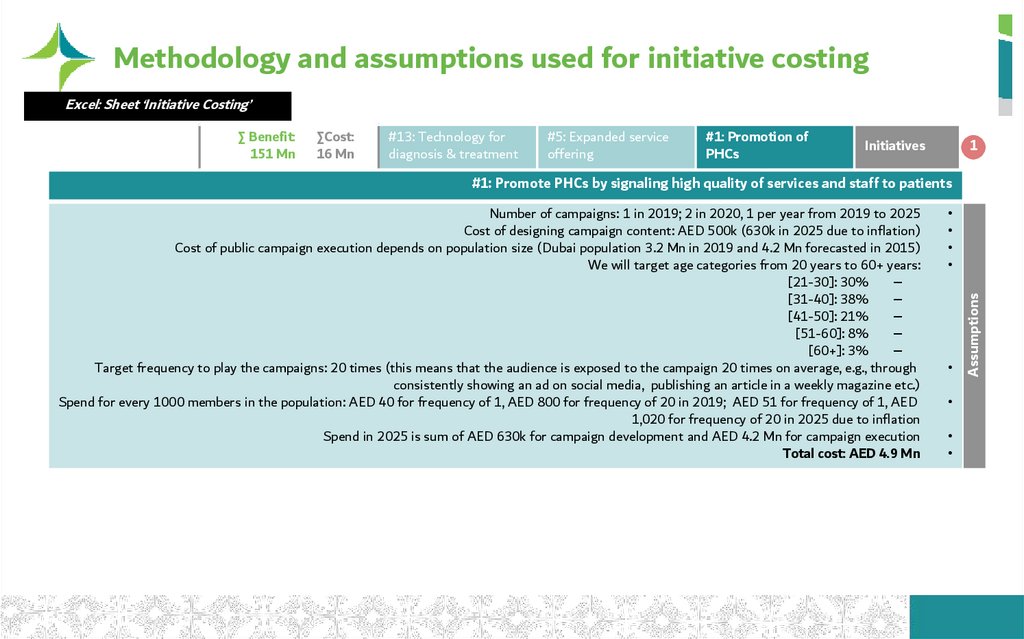
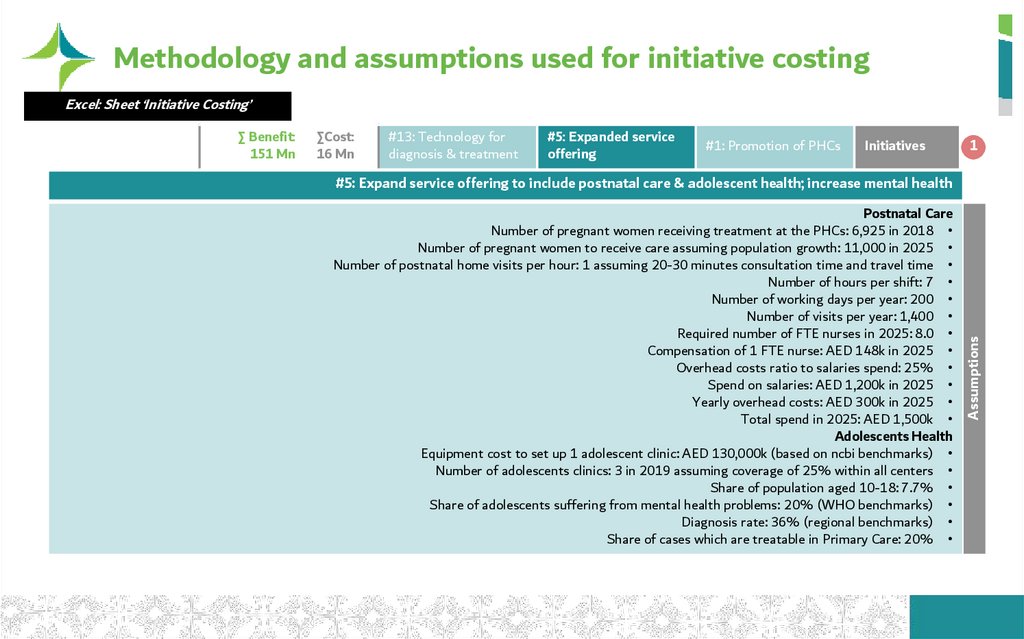
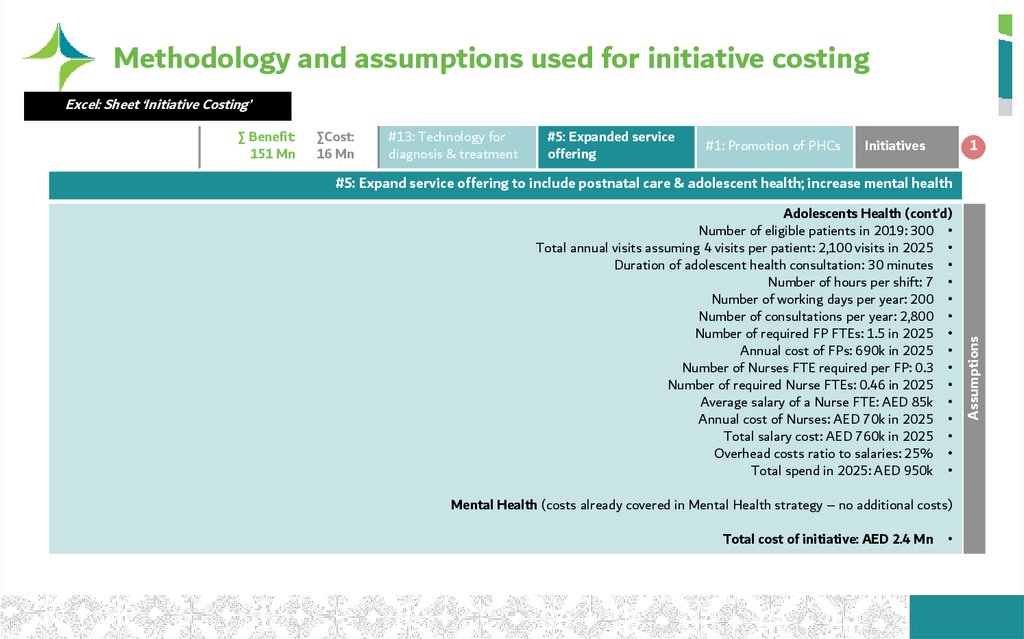
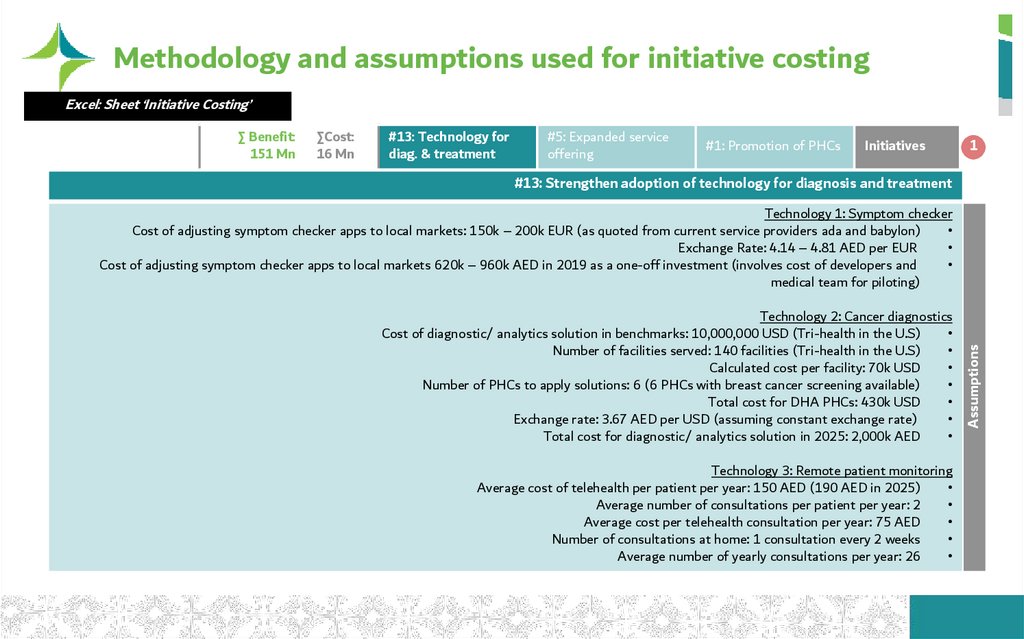
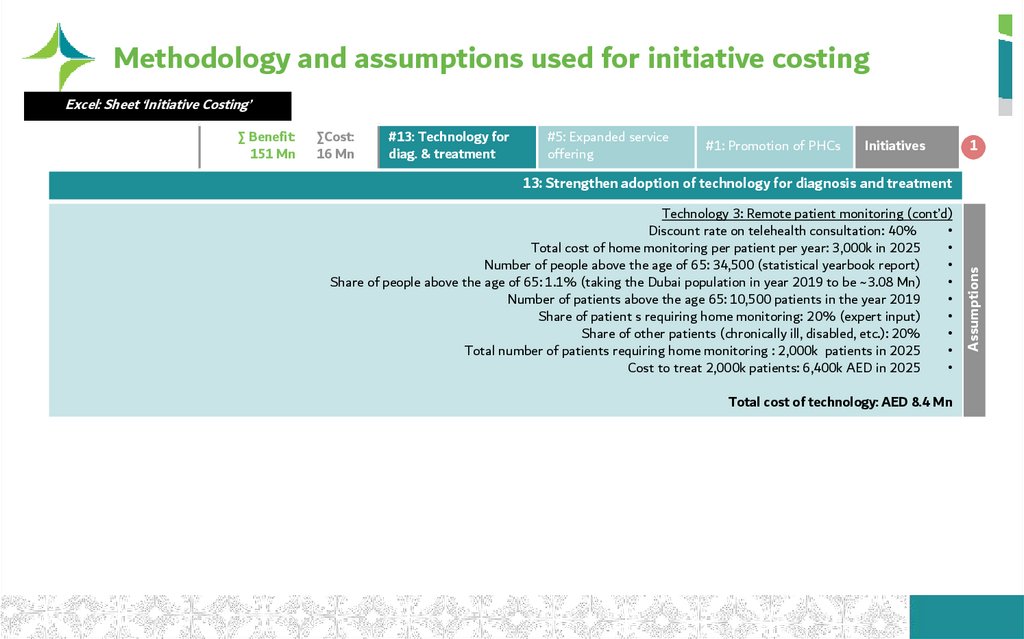
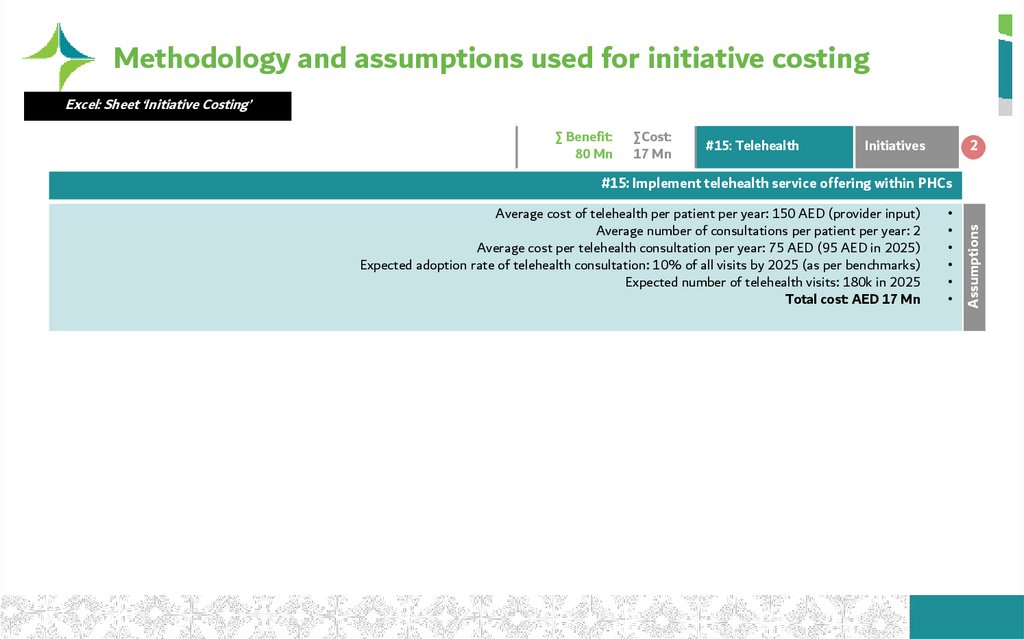
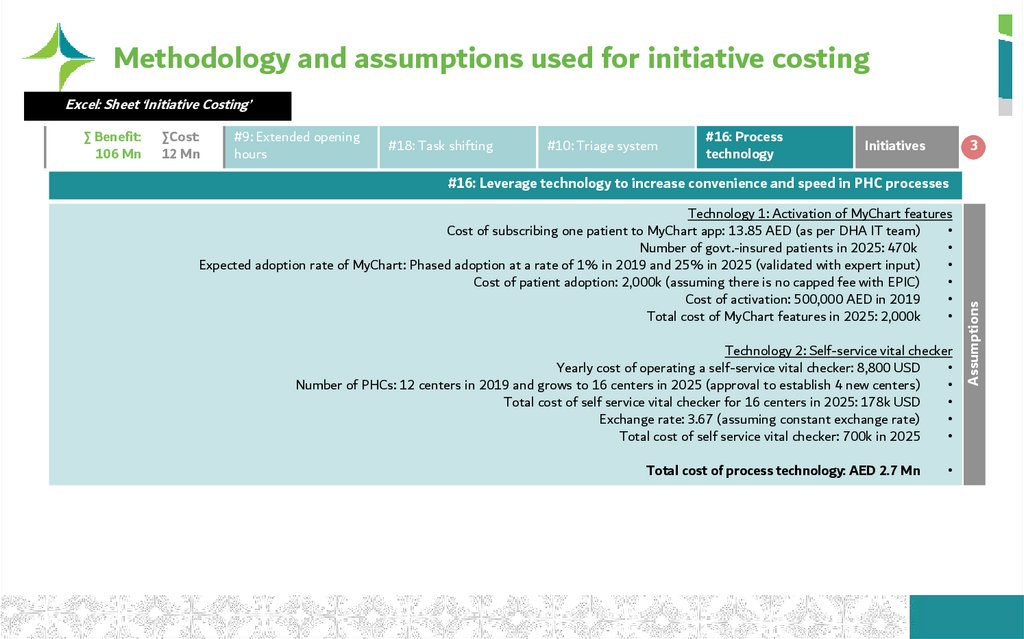
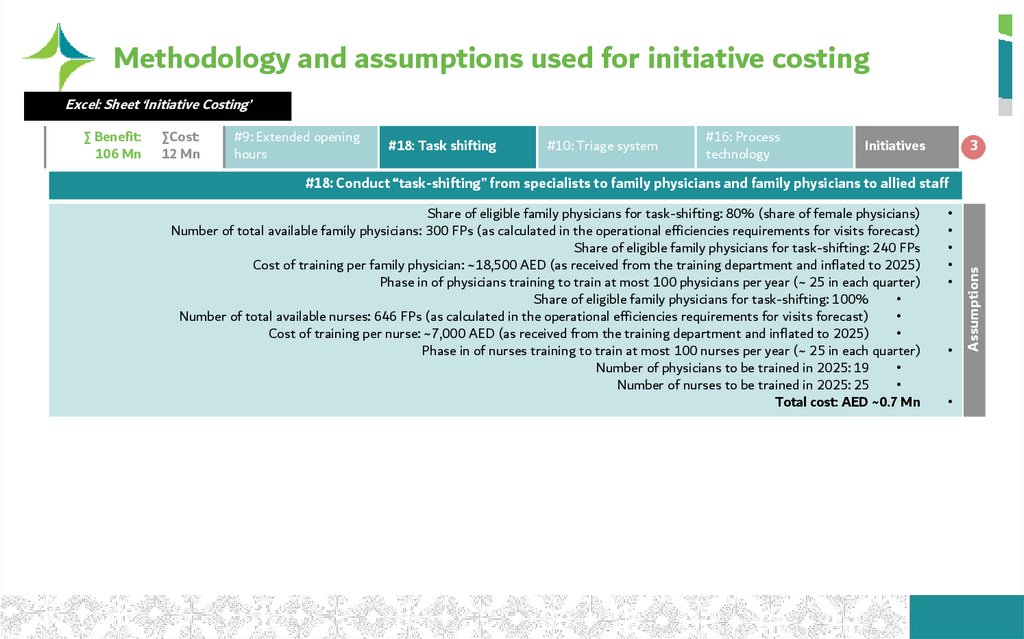
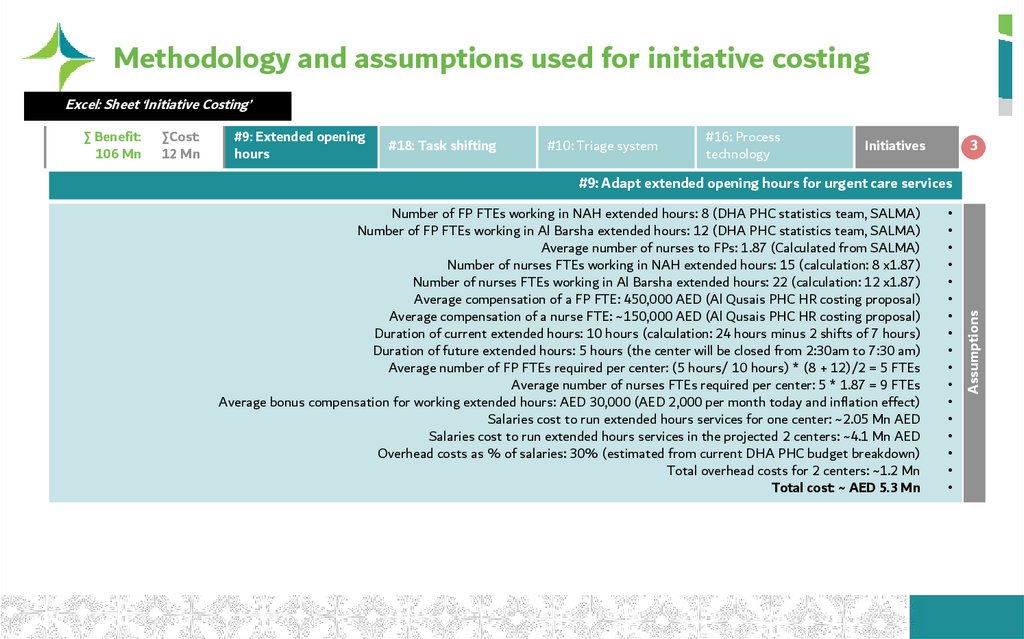
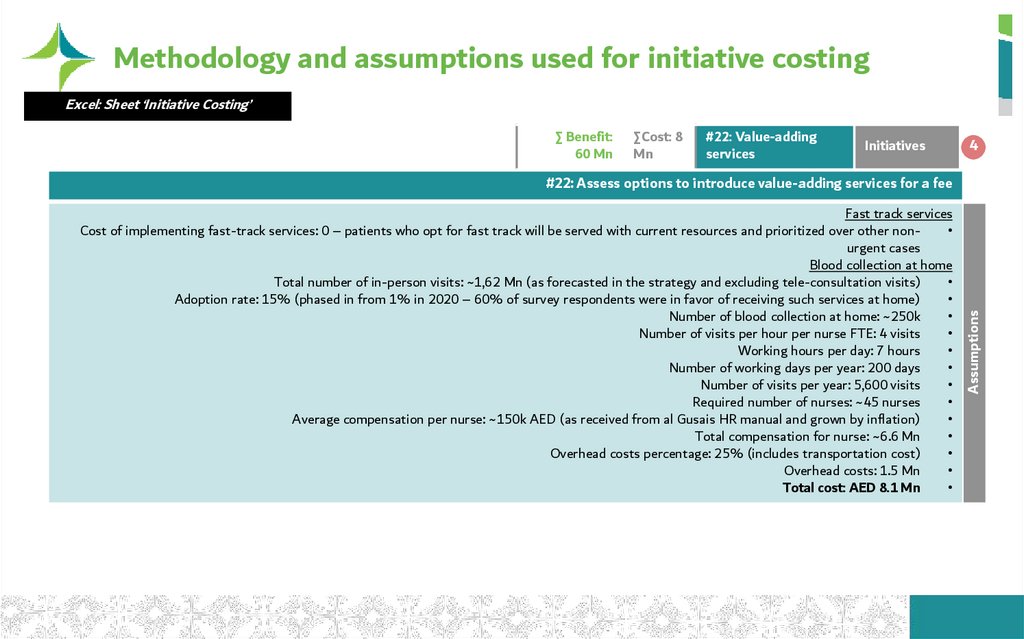
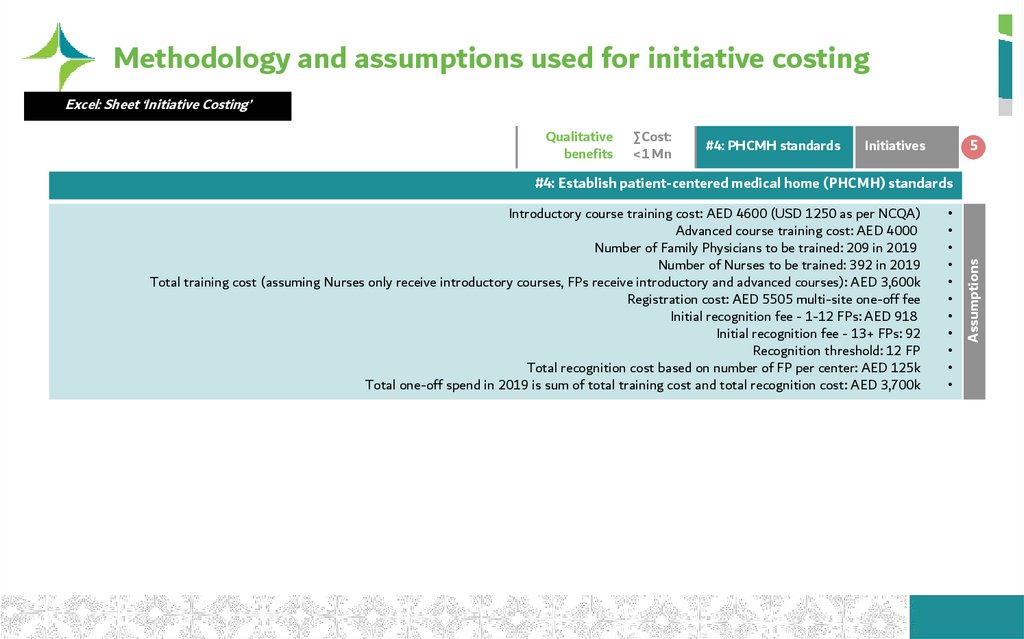
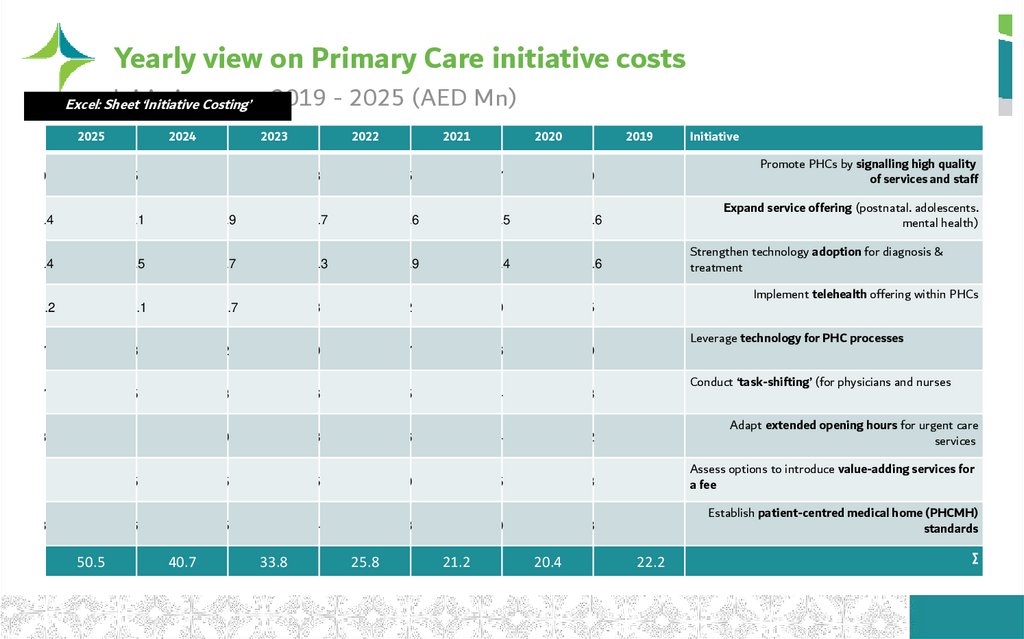
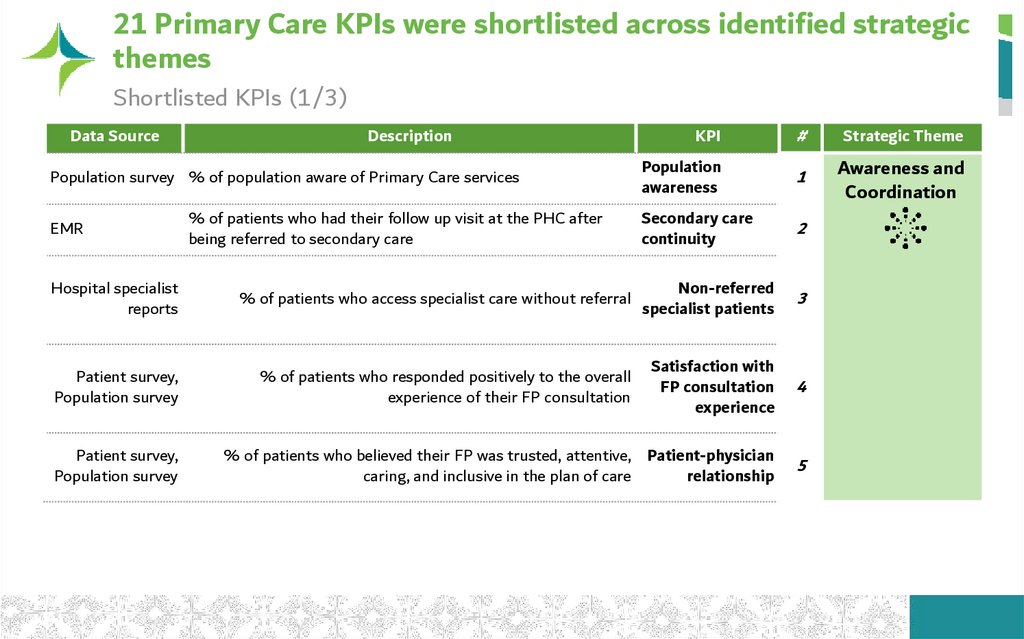
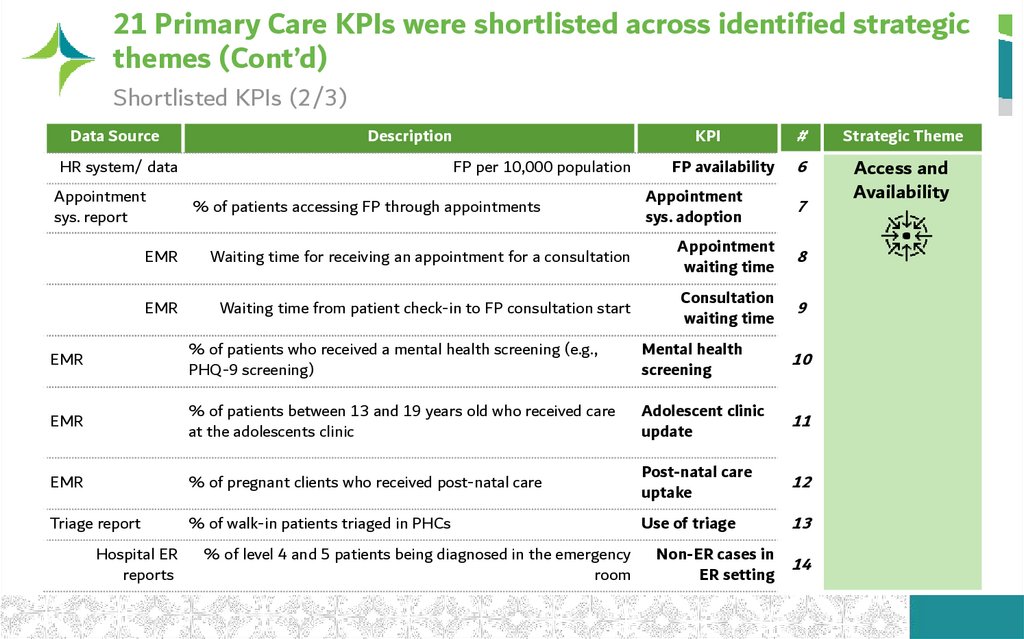
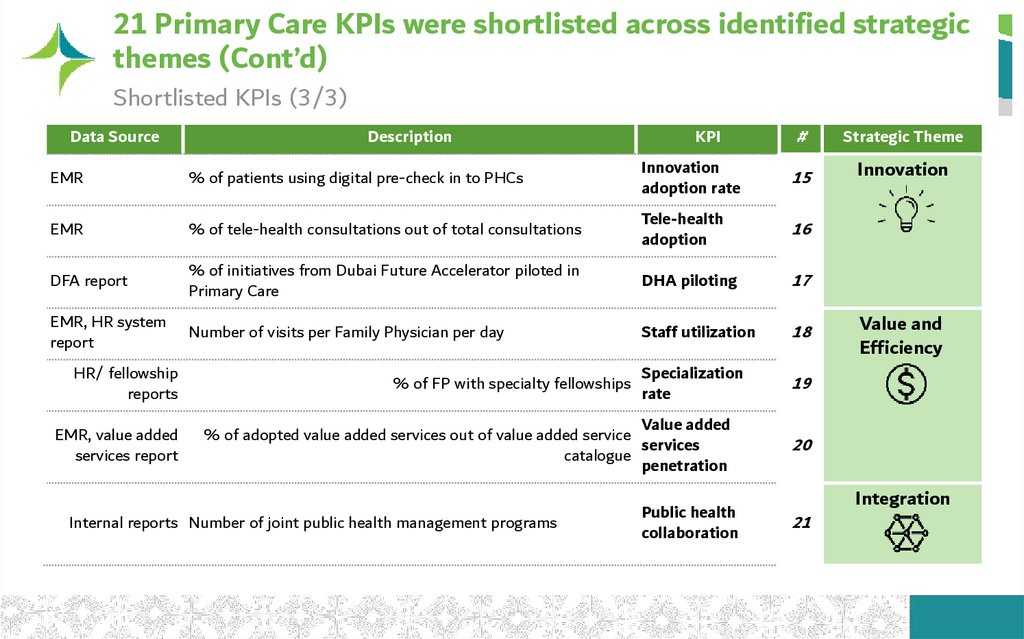
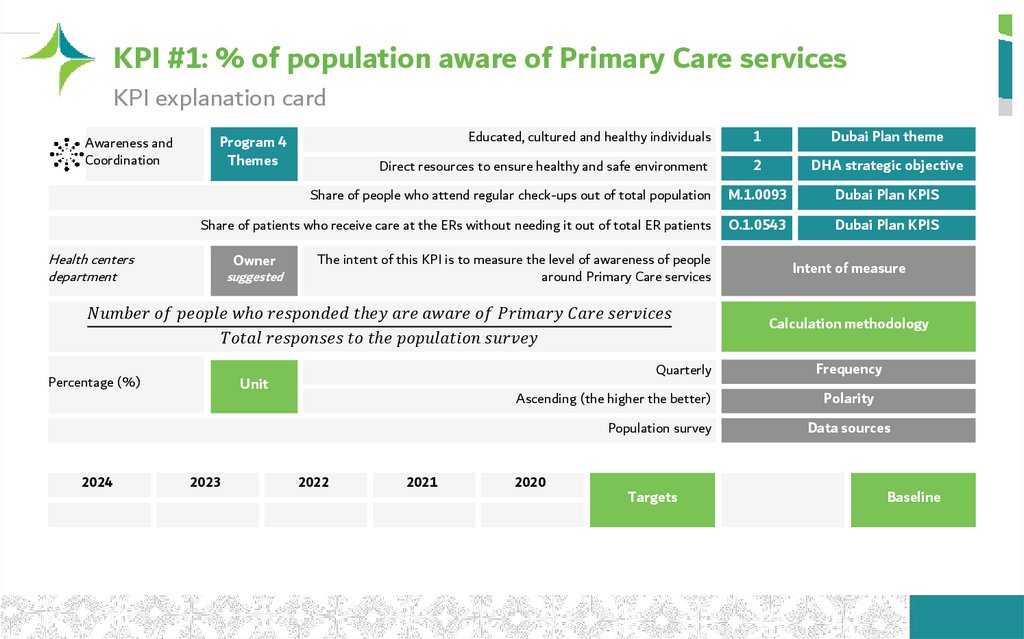
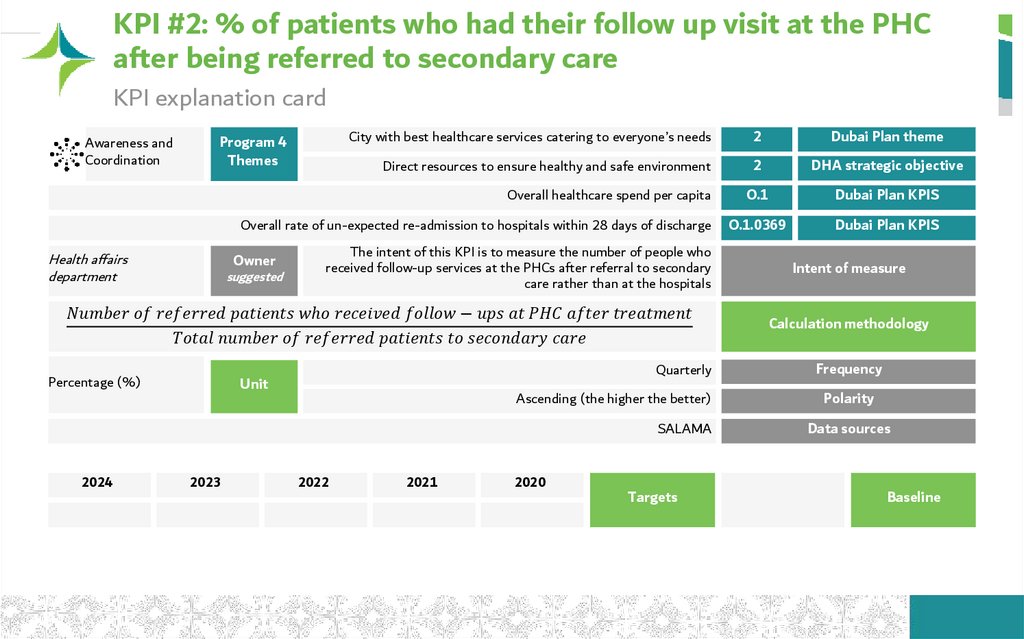
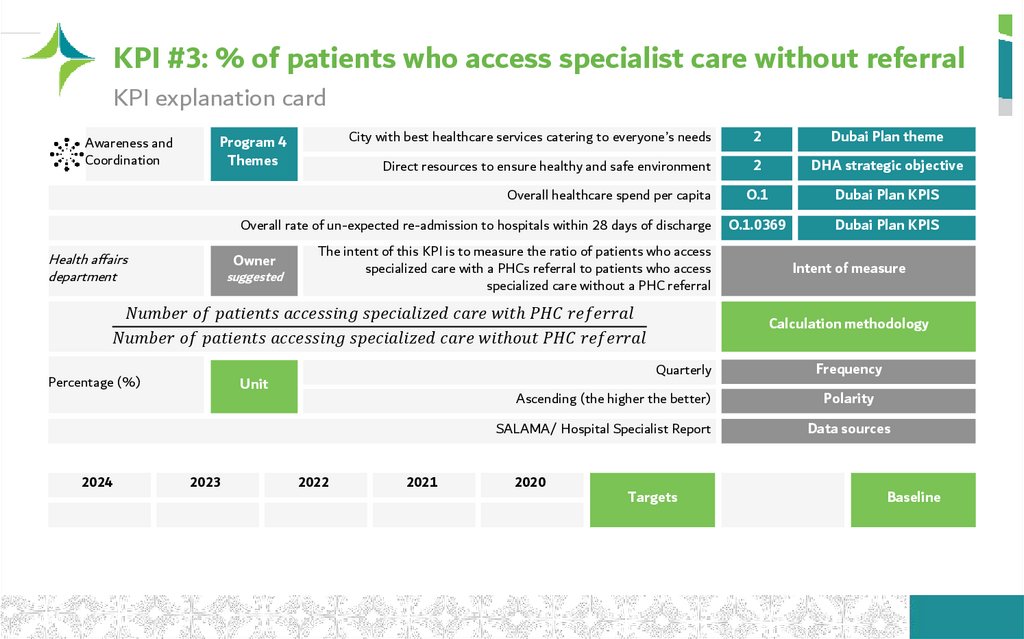
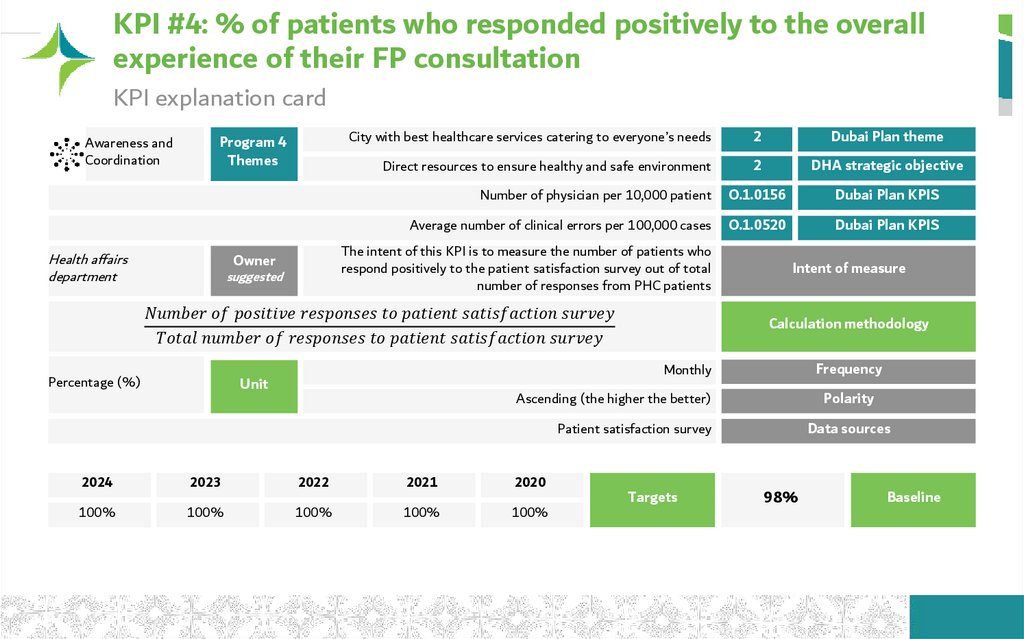

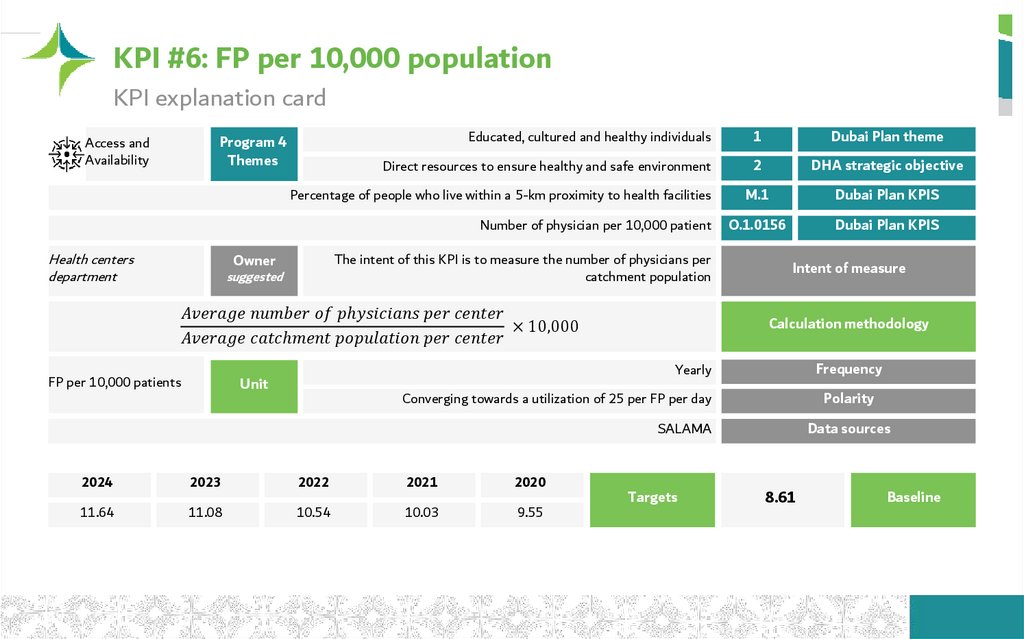
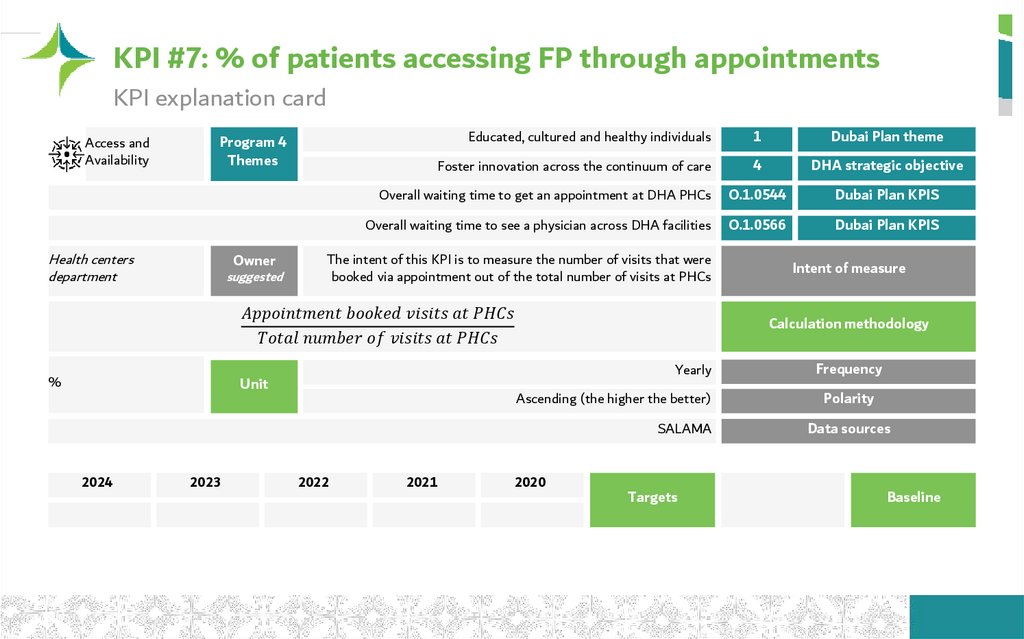

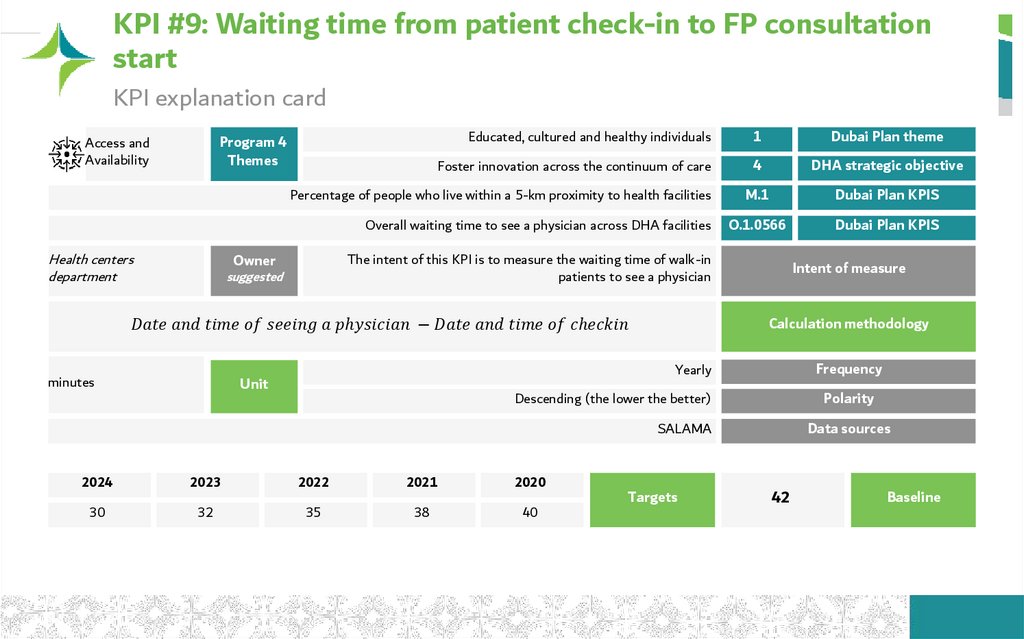
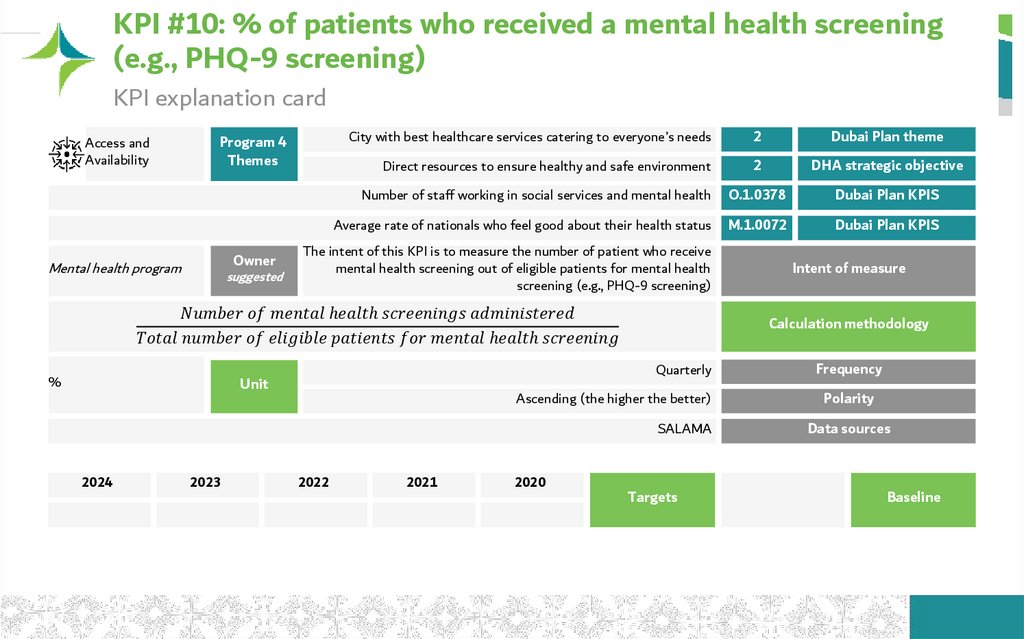
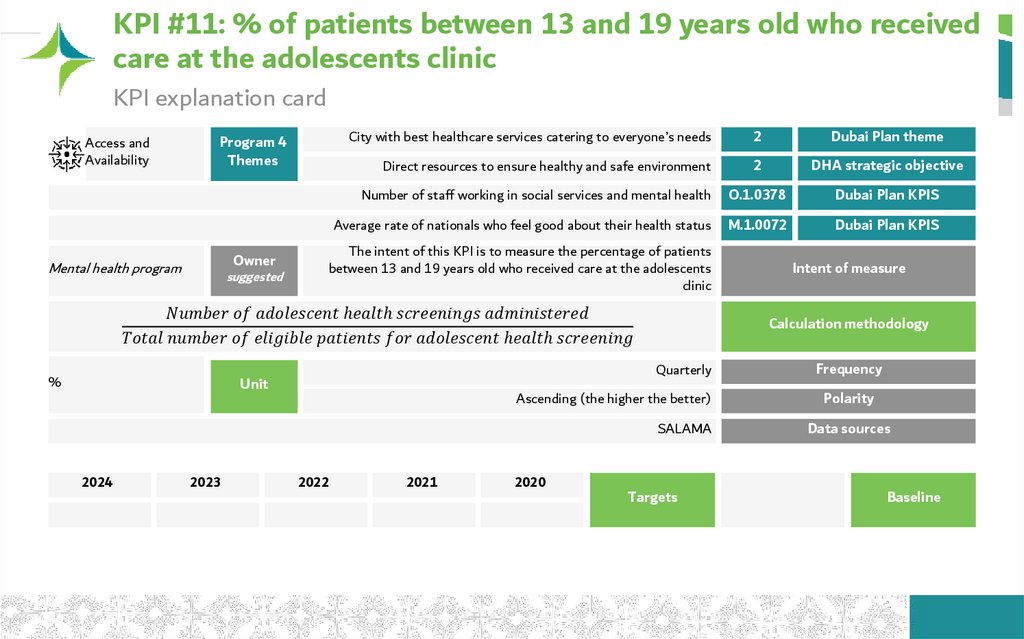
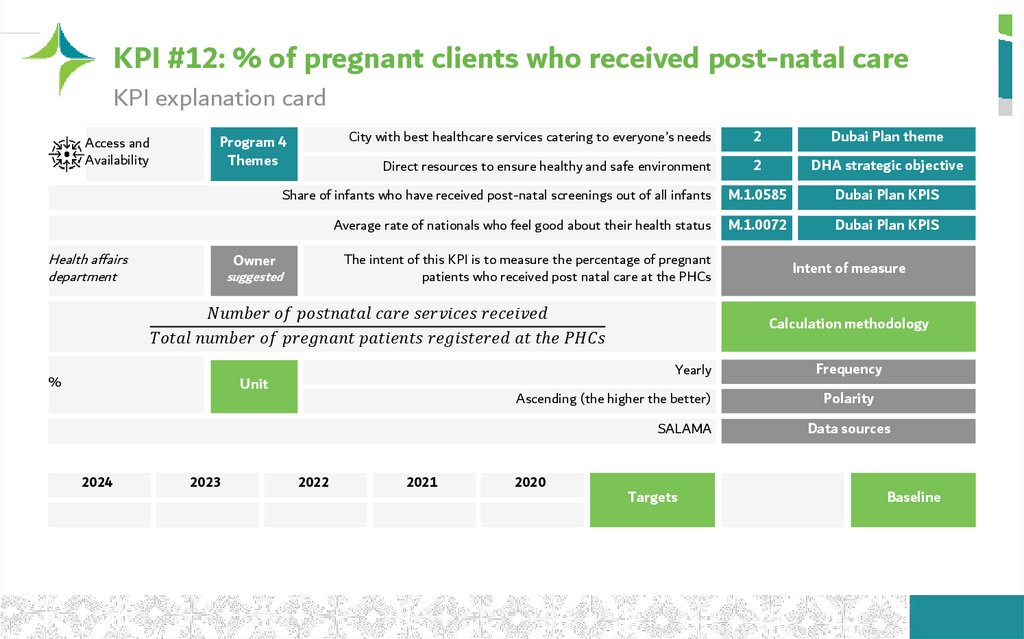
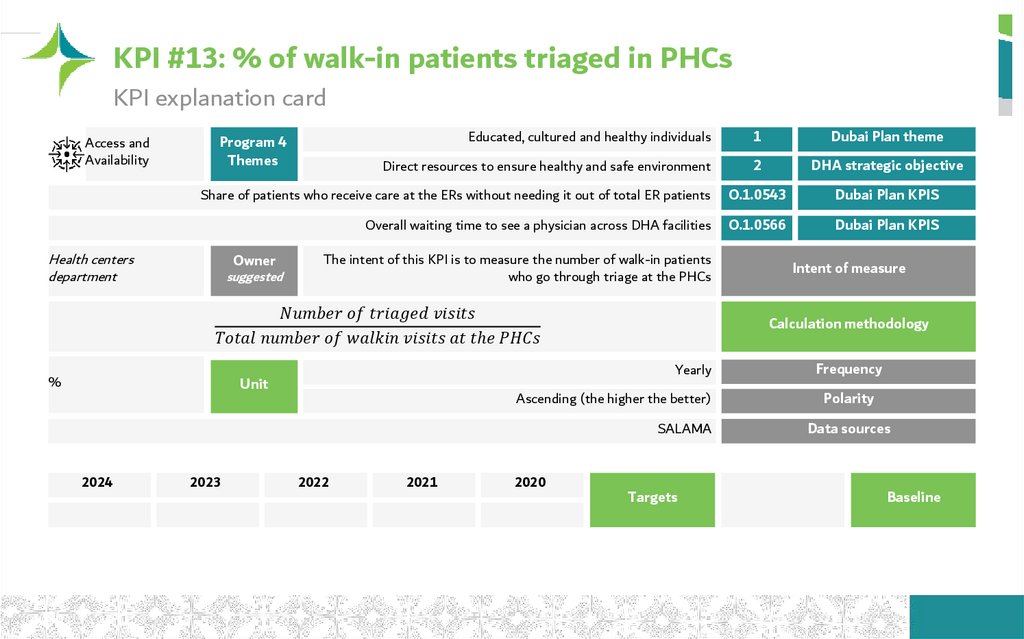
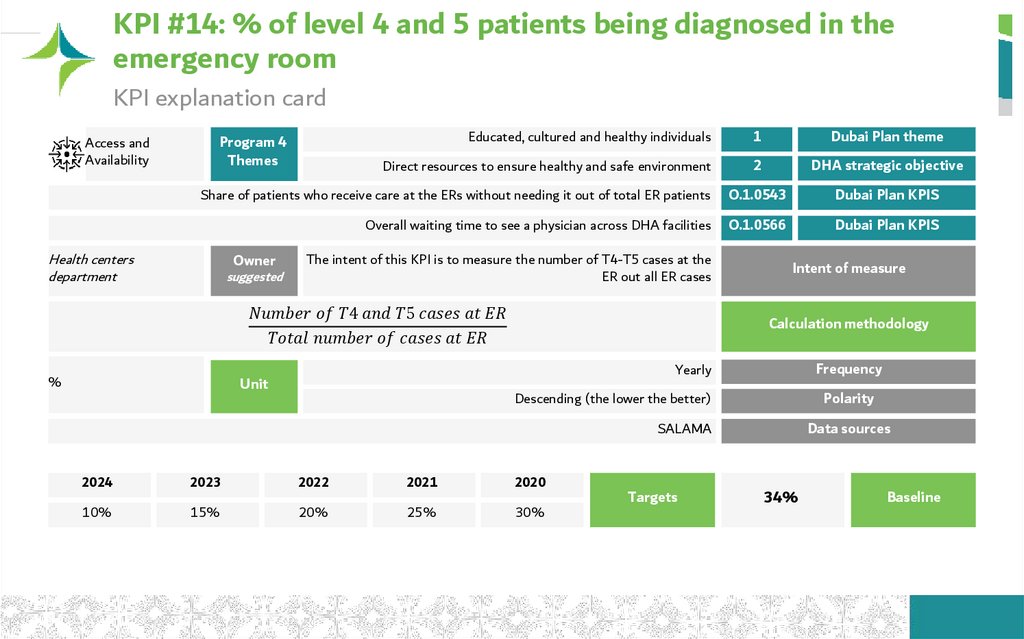
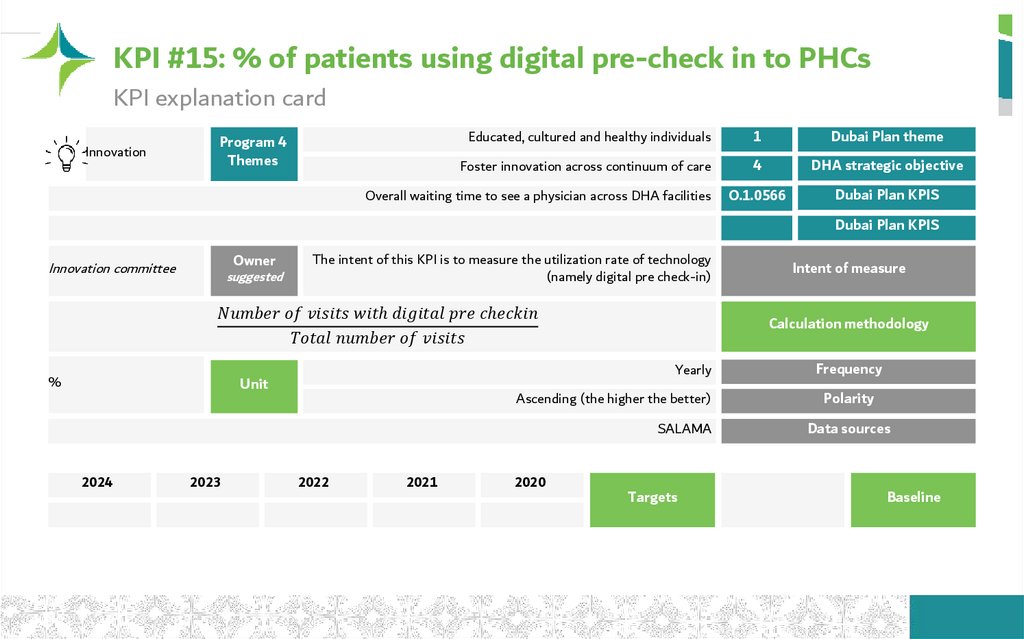
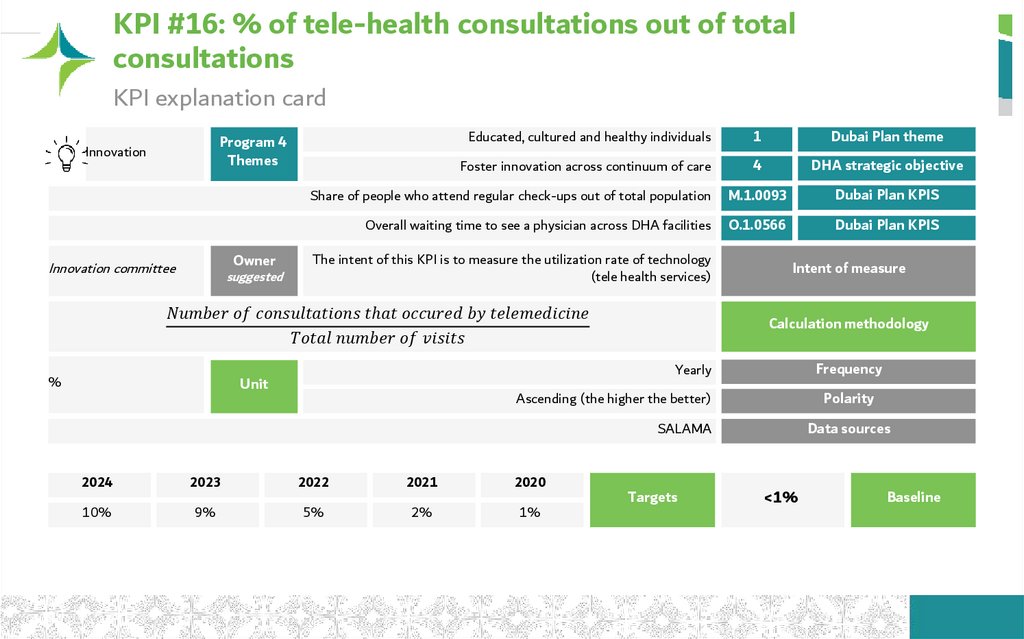
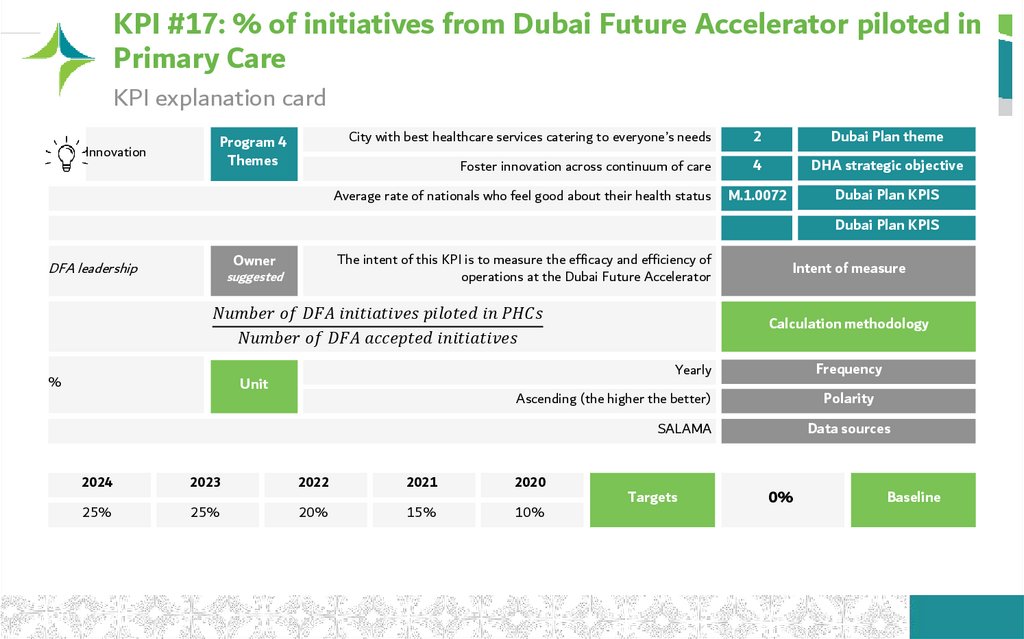
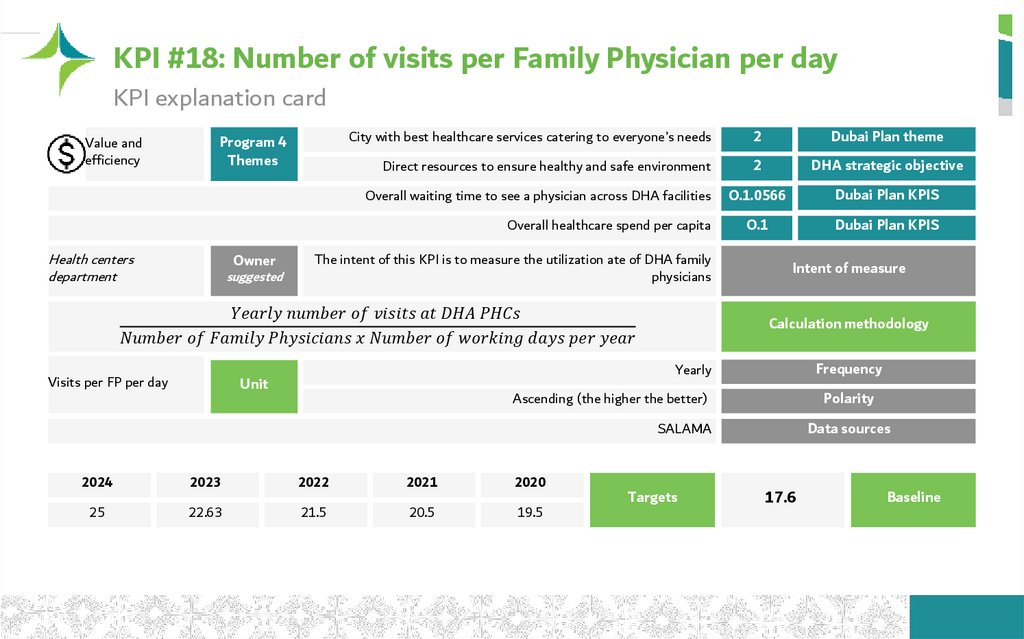
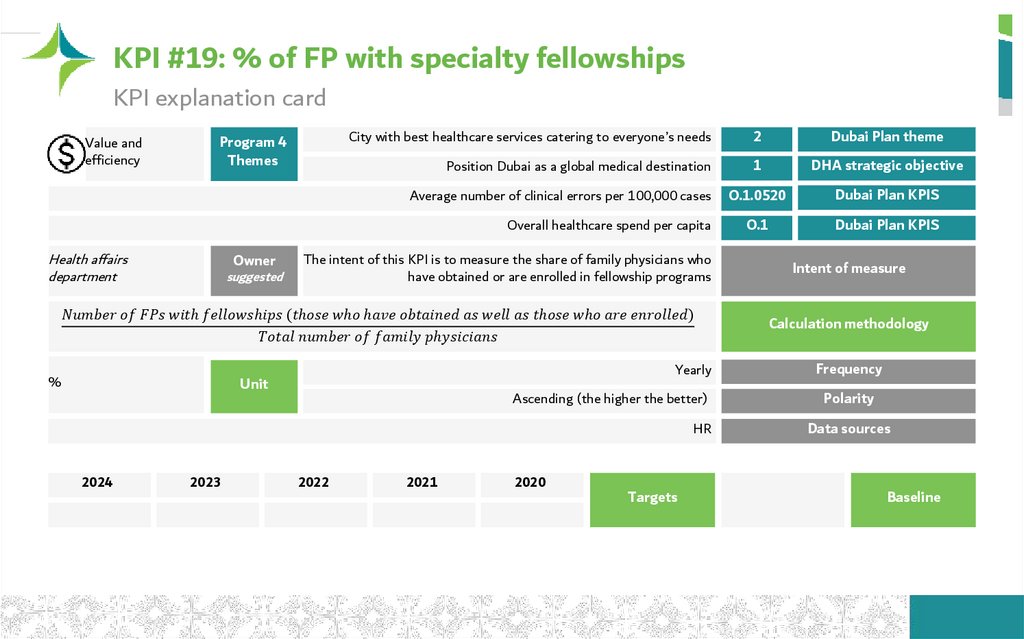
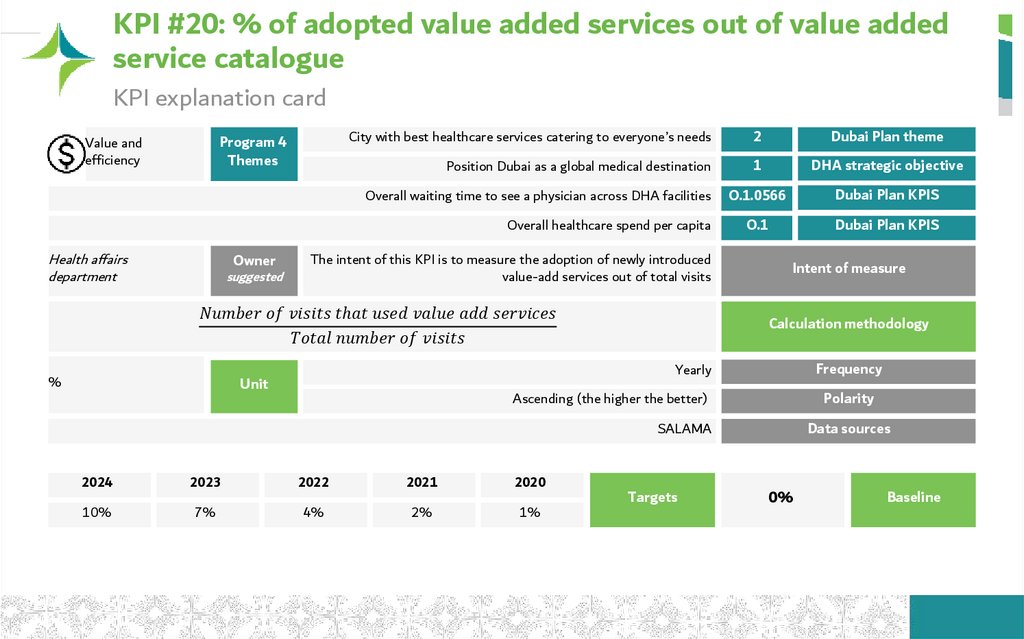
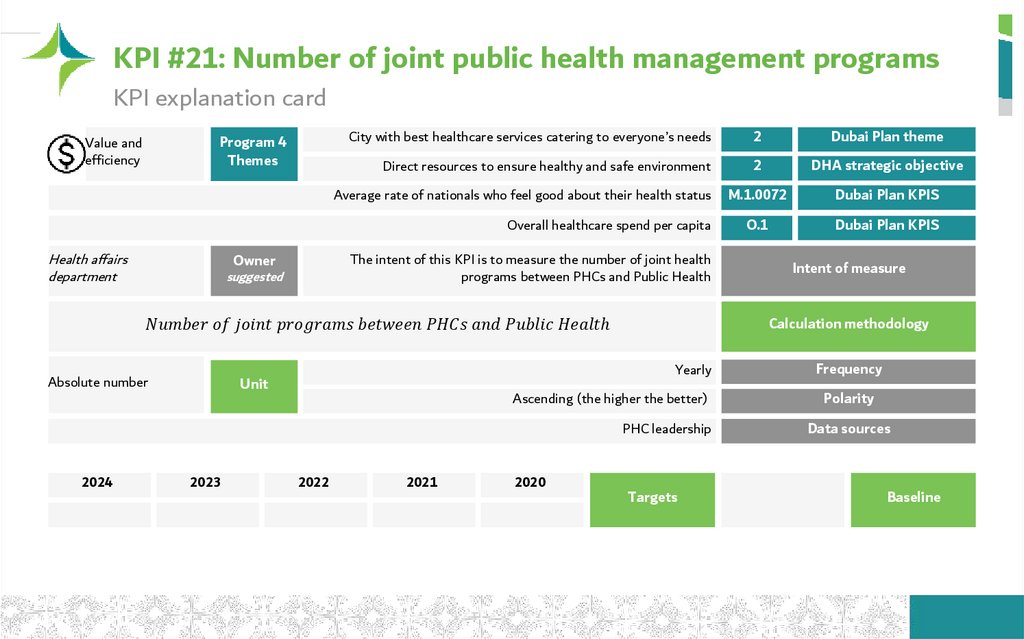
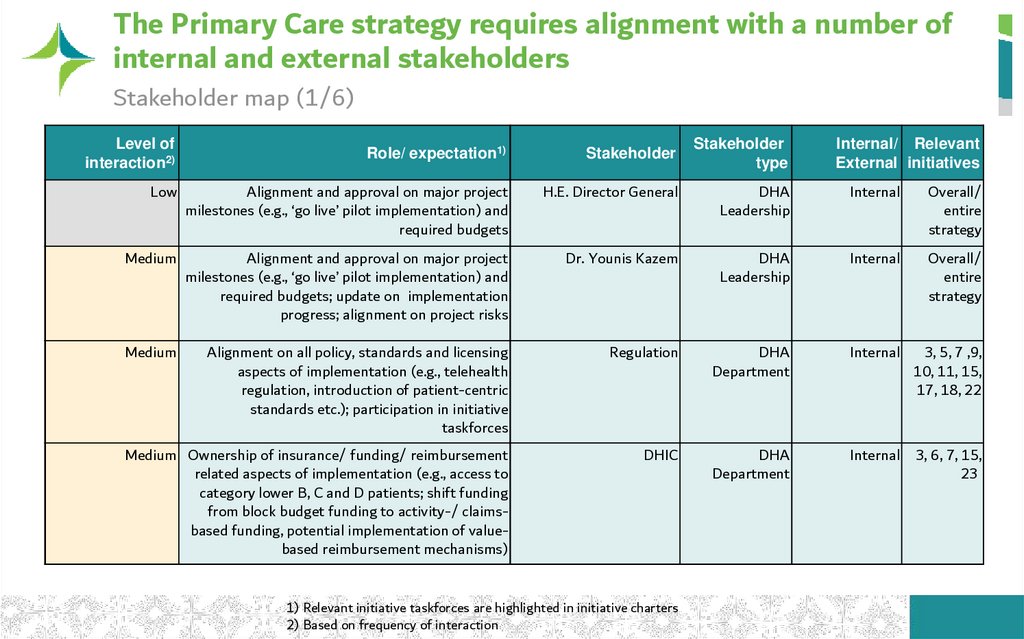
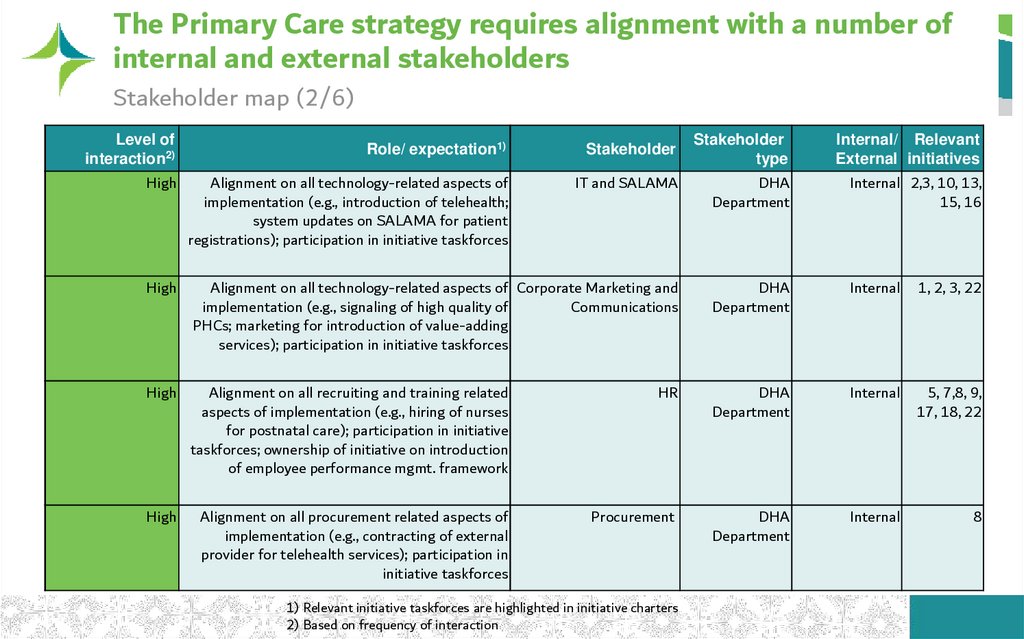
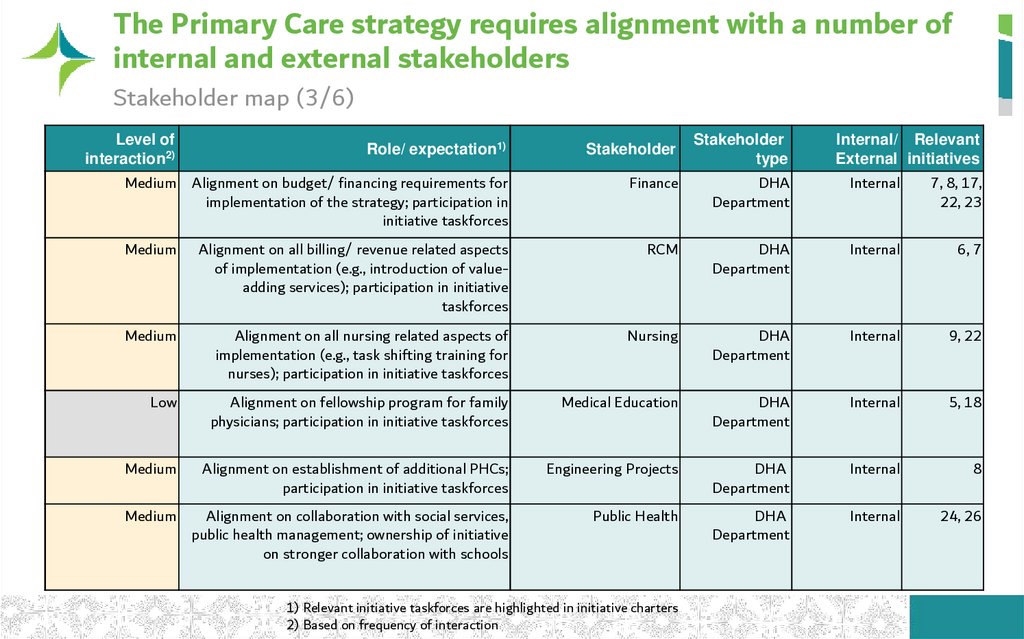
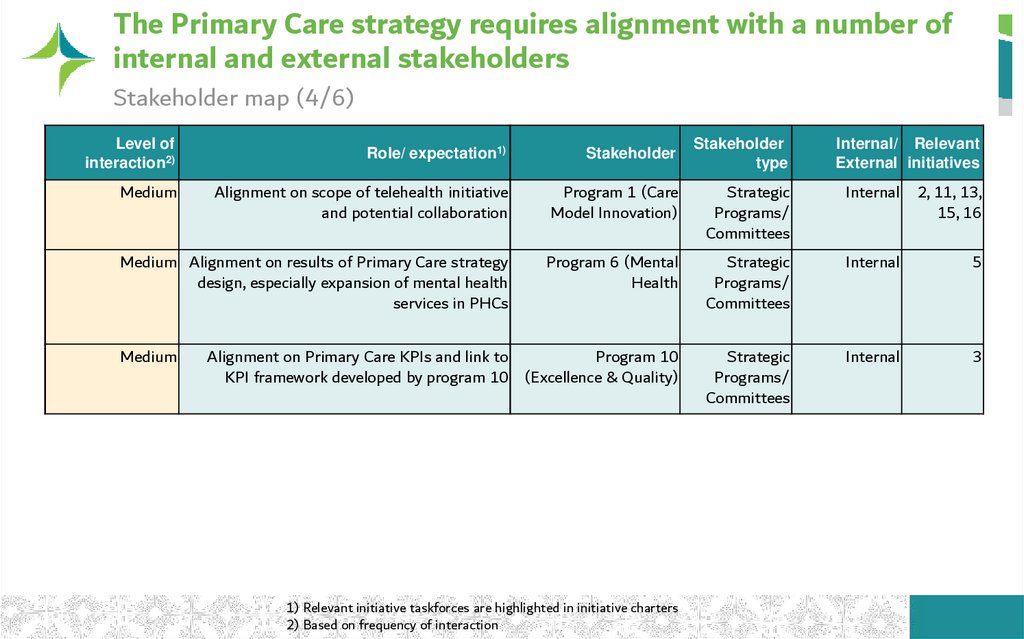
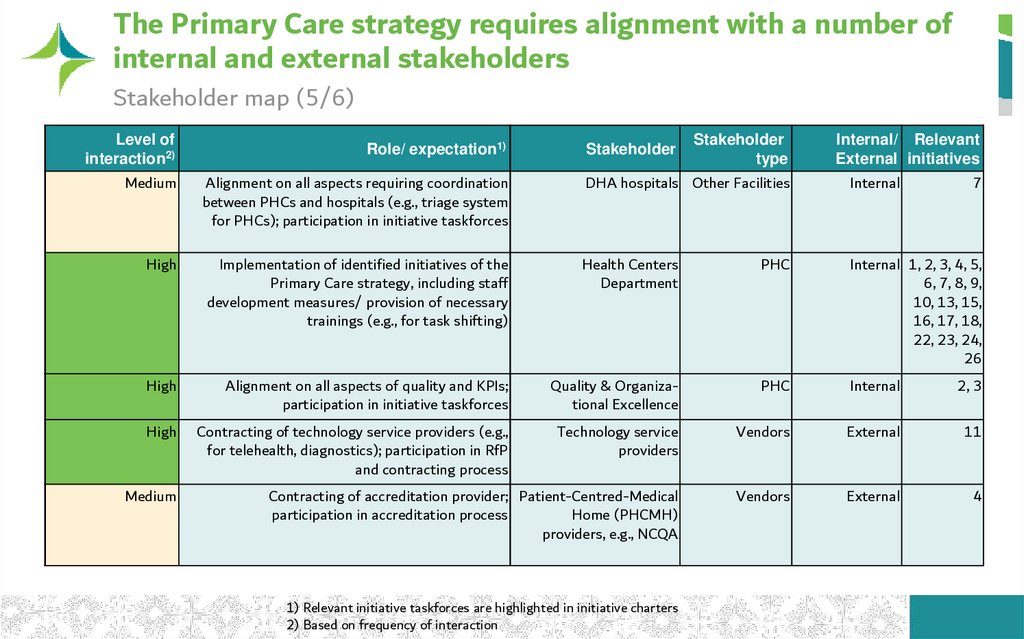

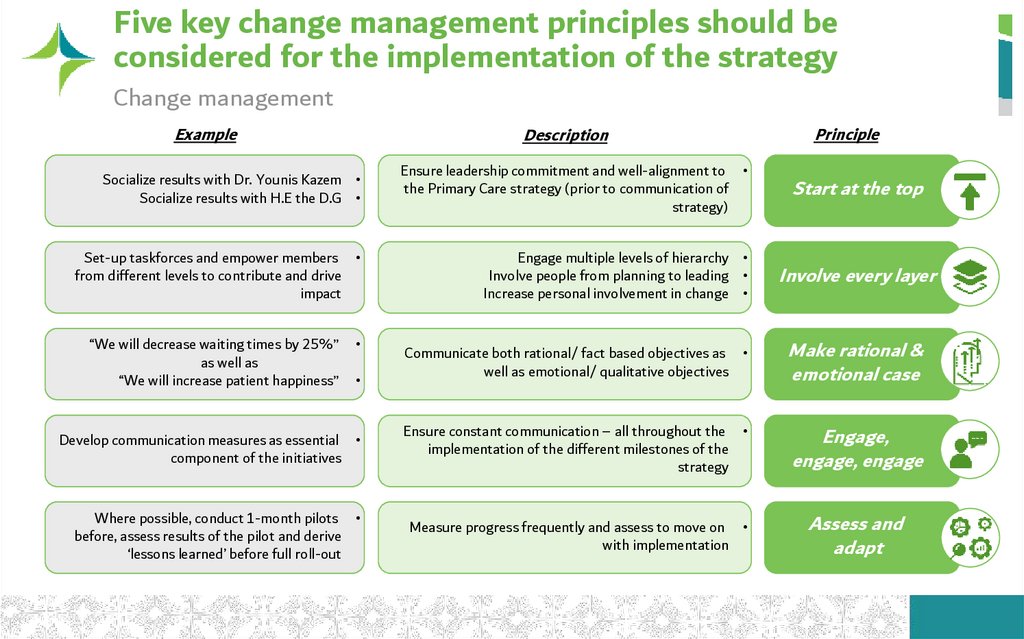
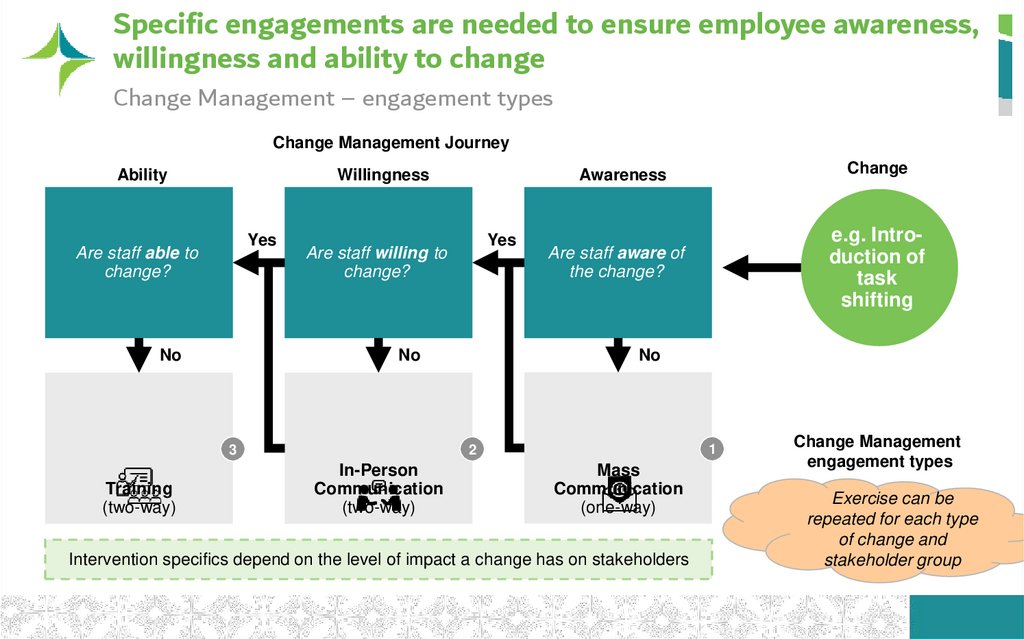
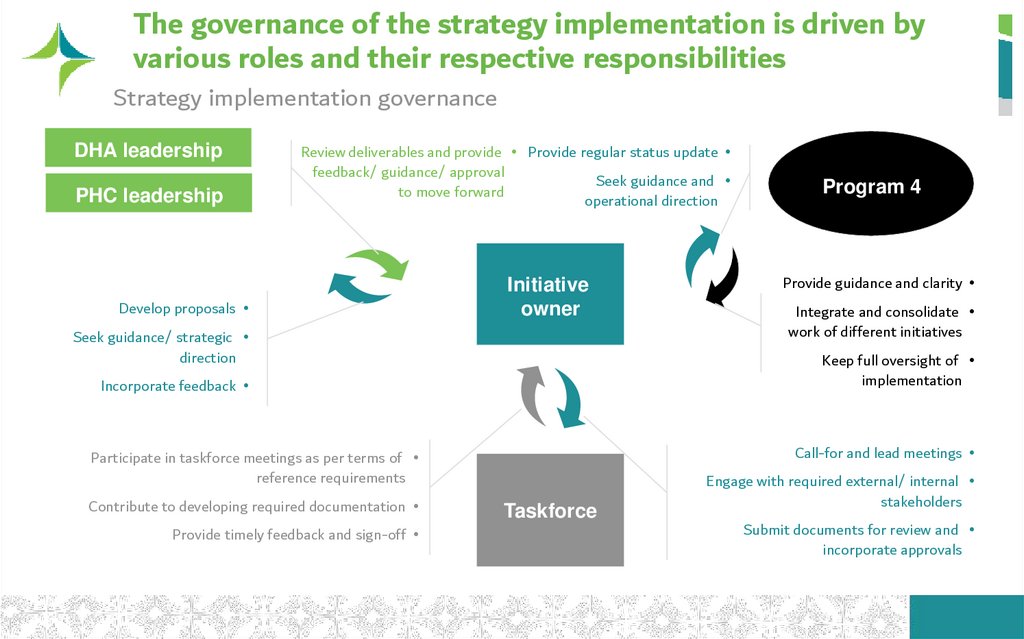
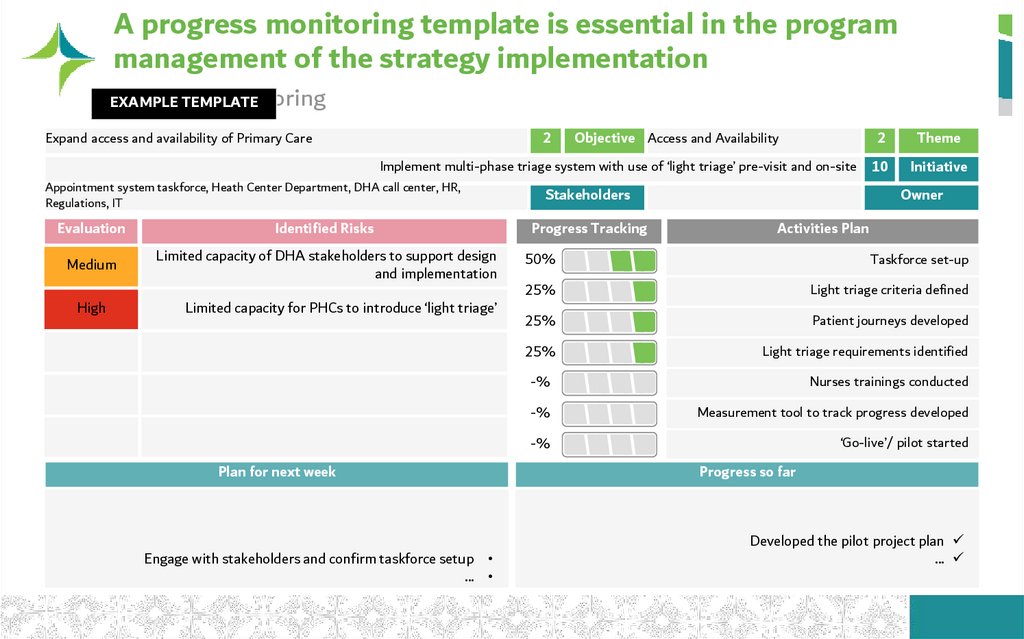
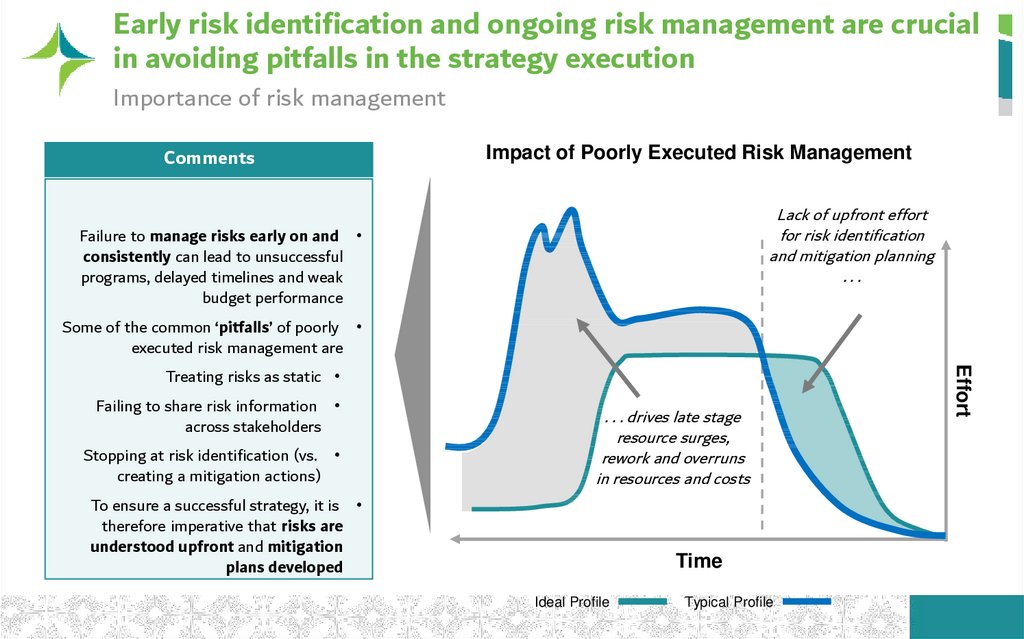
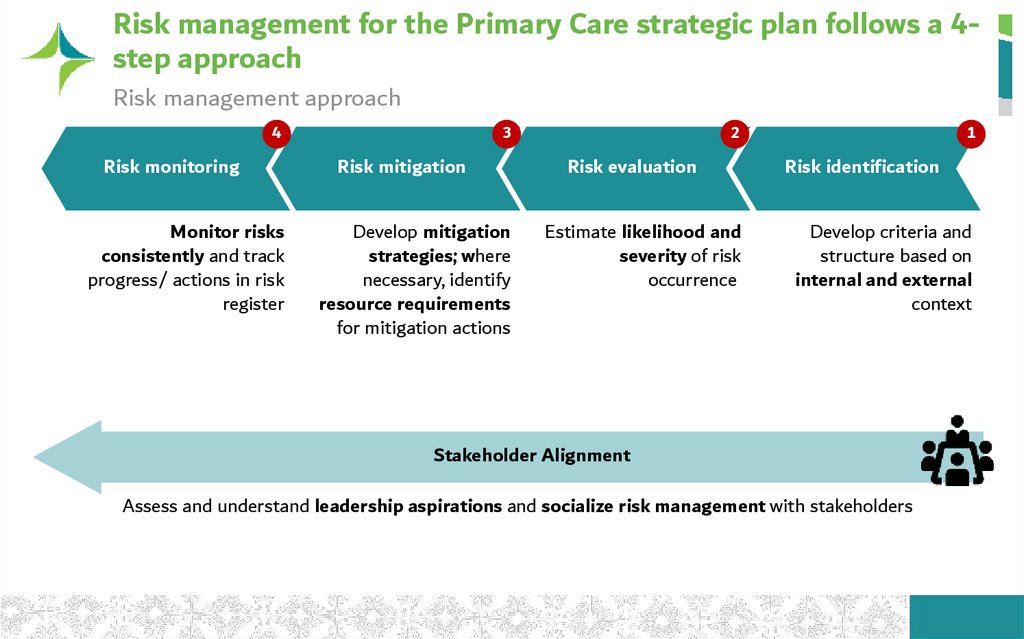
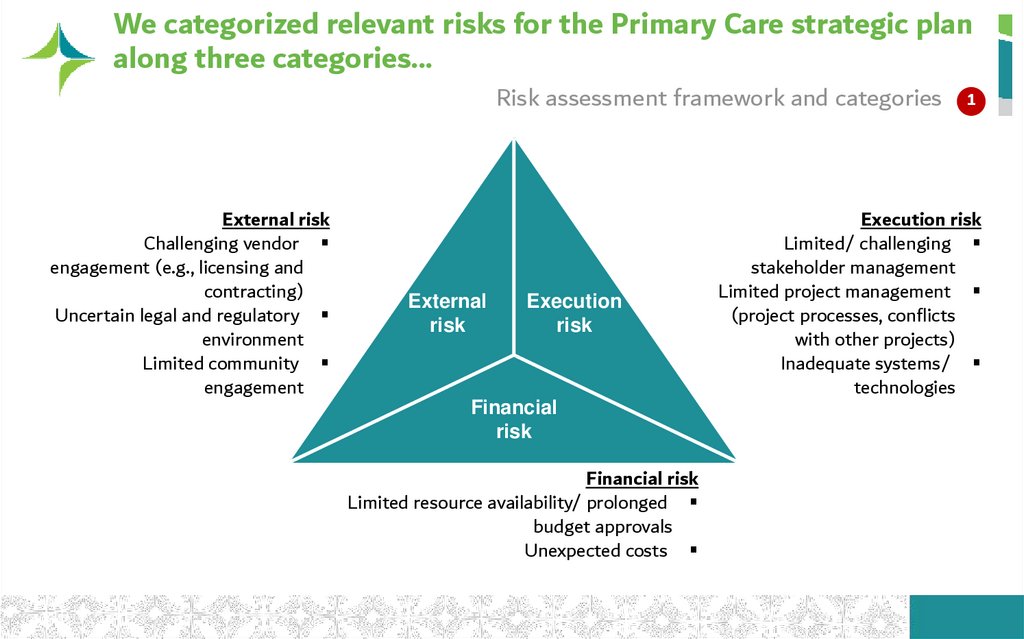
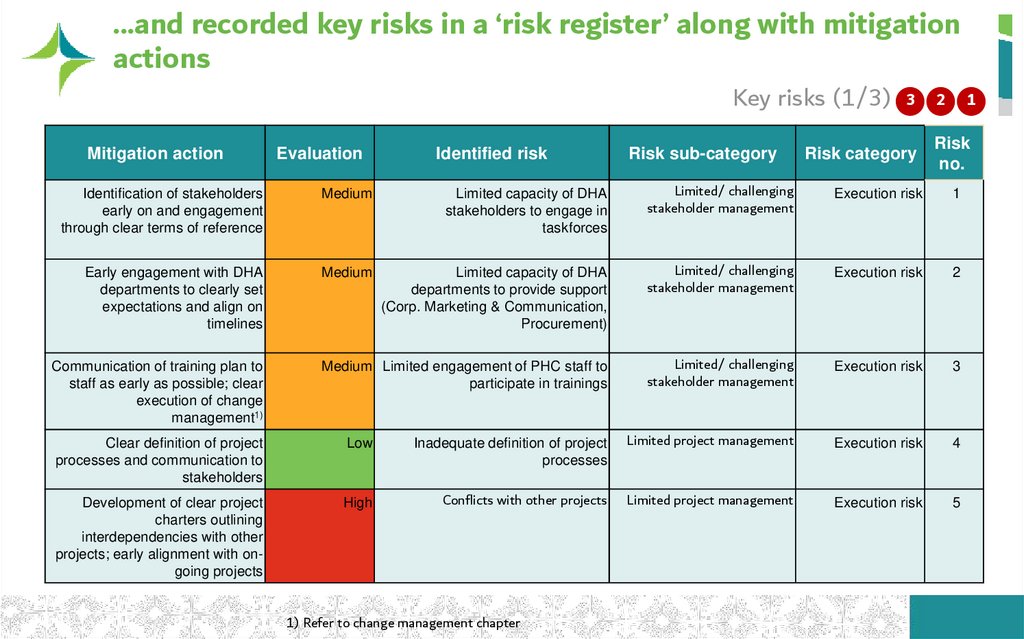
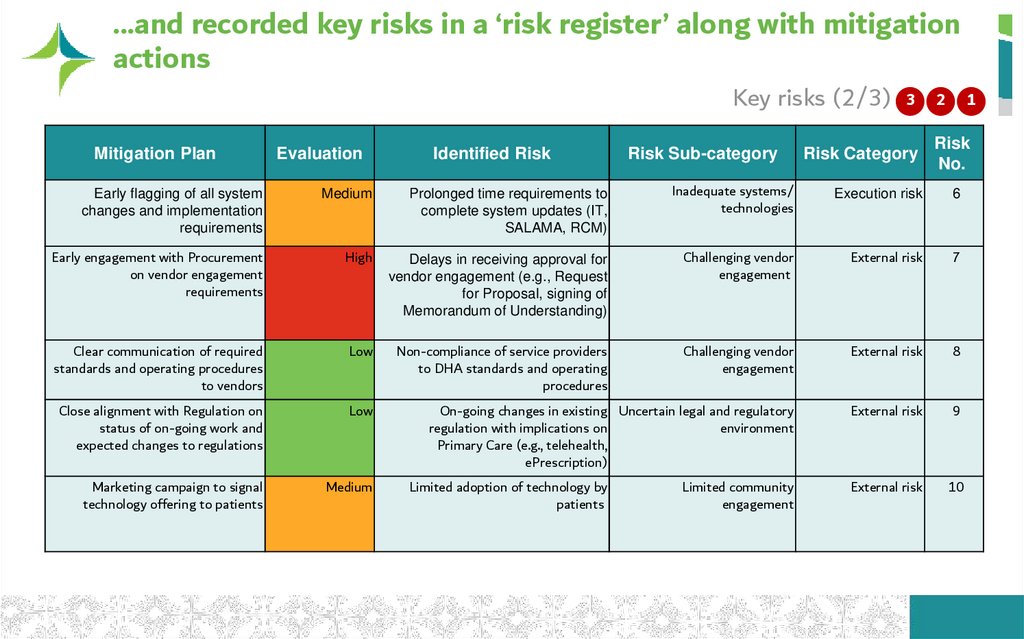
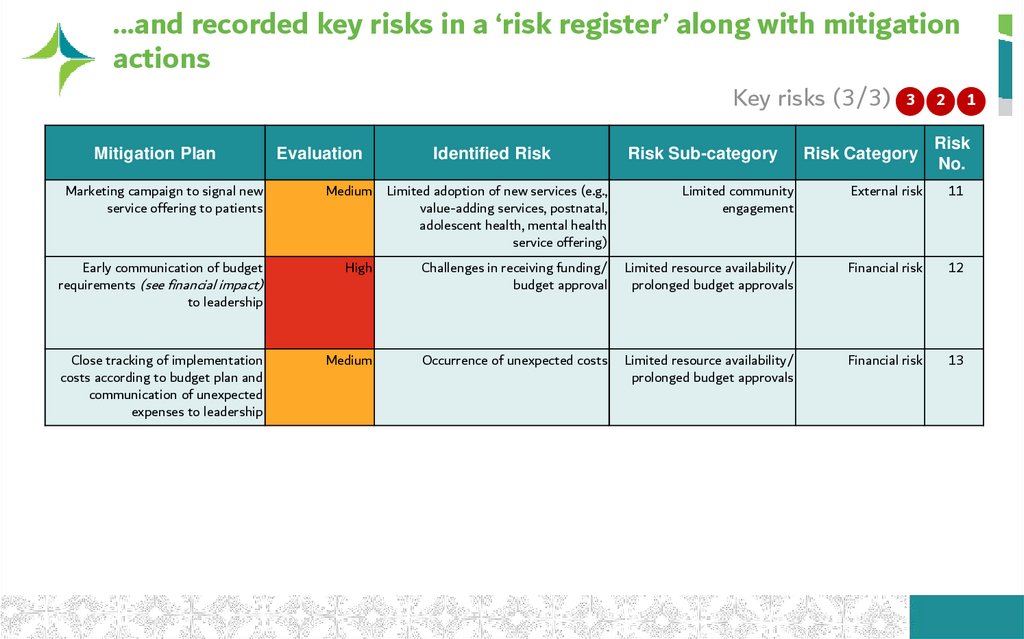
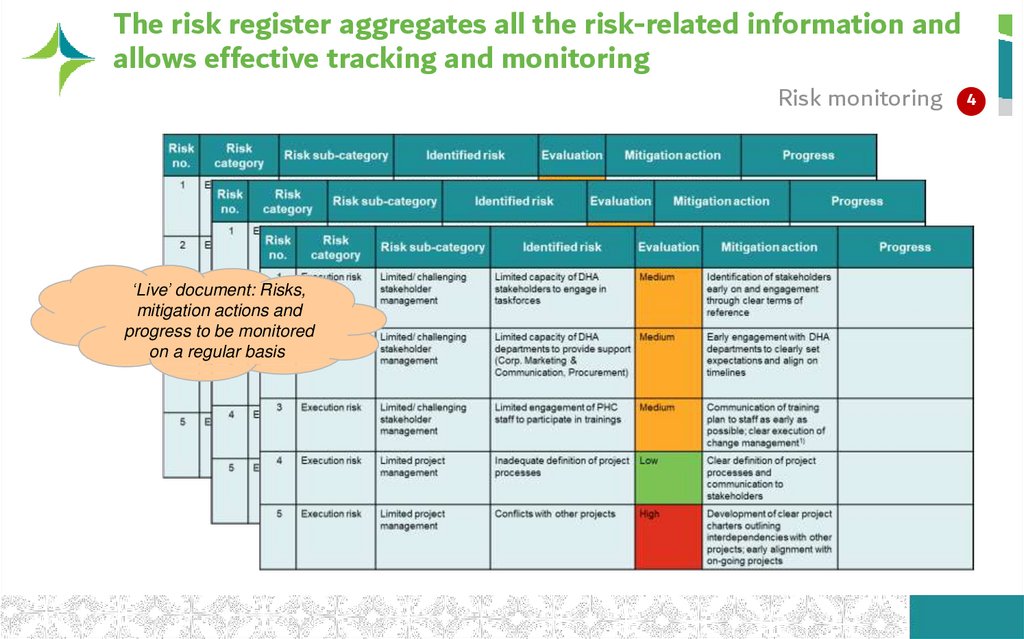
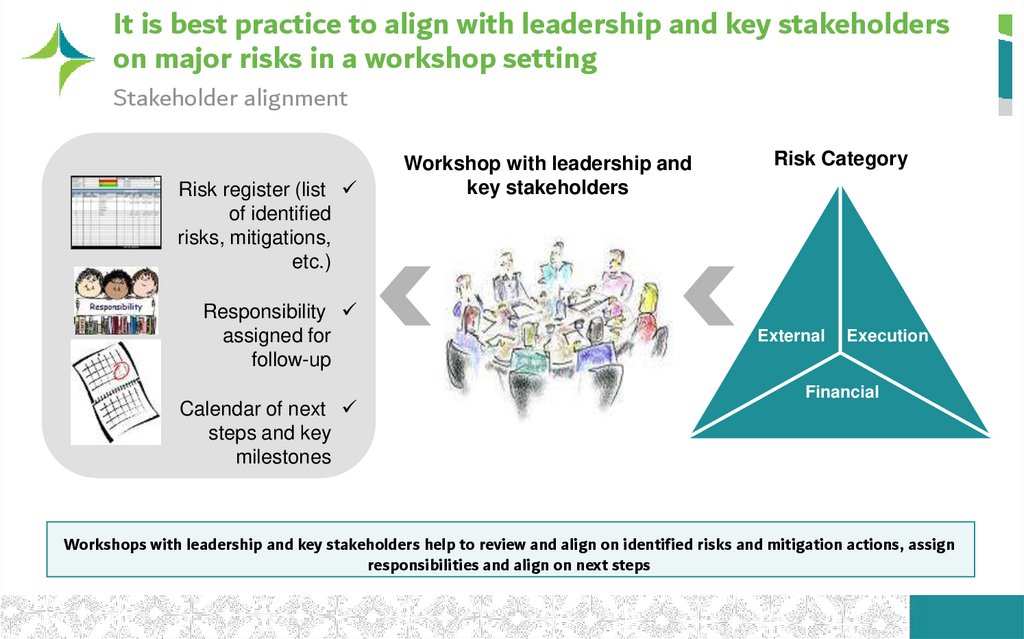

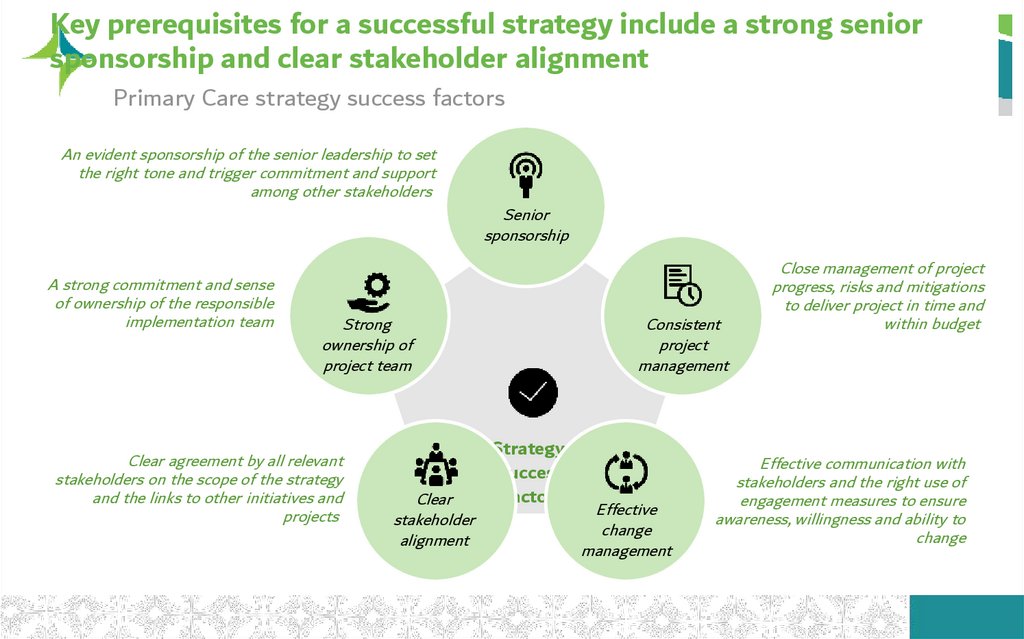

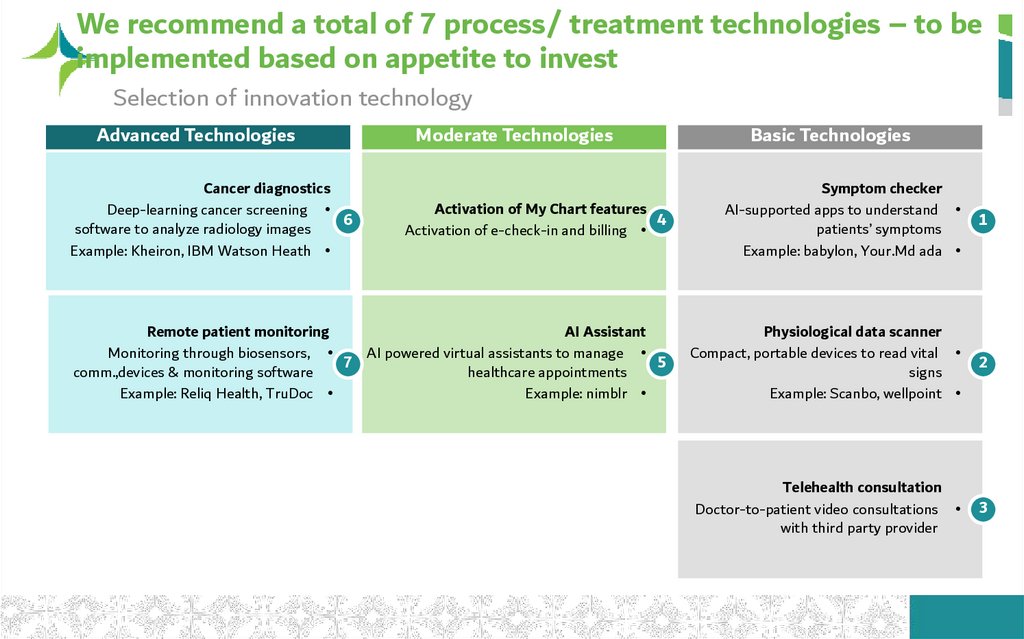
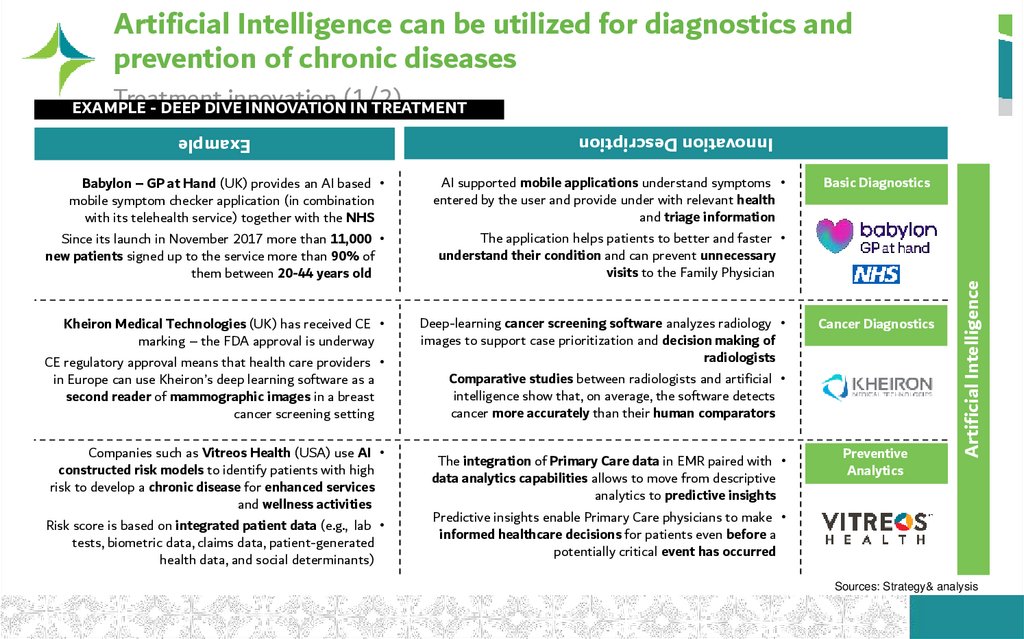
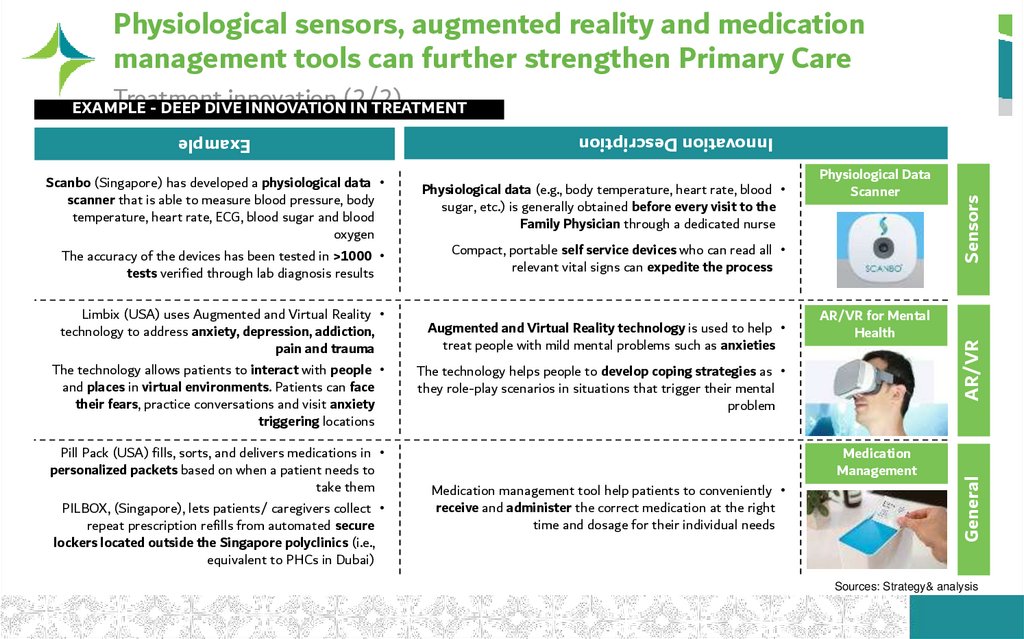
 medicine


