


")


")


 medicine
Similar presentations:


")


Basics of ECG
1. Basics of ECG
Dr Subroto Mandal, MD, DM, DCAssociate Professor, Cardiology
http://emergencymedic.blogspot.com
2. HISTORY
• 1842- Italian scientist Carlo Matteucci realizes thatelectricity is associated with the heart beat
• 1876- Irish scientist Marey analyzes the electric
pattern of frog’s heart
• 1895 - William Einthoven , credited for the
invention of EKG
• 1906 - using the string electrometer EKG,
William Einthoven diagnoses some heart problems
3. CONTD…
• 1924 - the noble prize for physiology ormedicine is given to William Einthoven for his
work on EKG
• 1938 -AHA and Cardiac society of great Britan
defined and position of chest leads
• 1942- Goldberger increased Wilson’s Unipolar
lead voltage by 50% and made Augmented leads
• 2005- successful reduction in time of onset of
chest pain and PTCA by wireless transmission of
ECG on his PDA.
4.
5. MODERN ECG INSTRUMENT
6.
What is an EKG?•The electrocardiogram (EKG) is a representation
of the electrical events of the cardiac cycle.
•Each event has a distinctive waveform
•the study of waveform can lead to greater insight
into a patient’s cardiac pathophysiology.
7.
With EKGs we can identifyArrhythmias
Myocardial ischemia and infarction
Pericarditis
Chamber hypertrophy
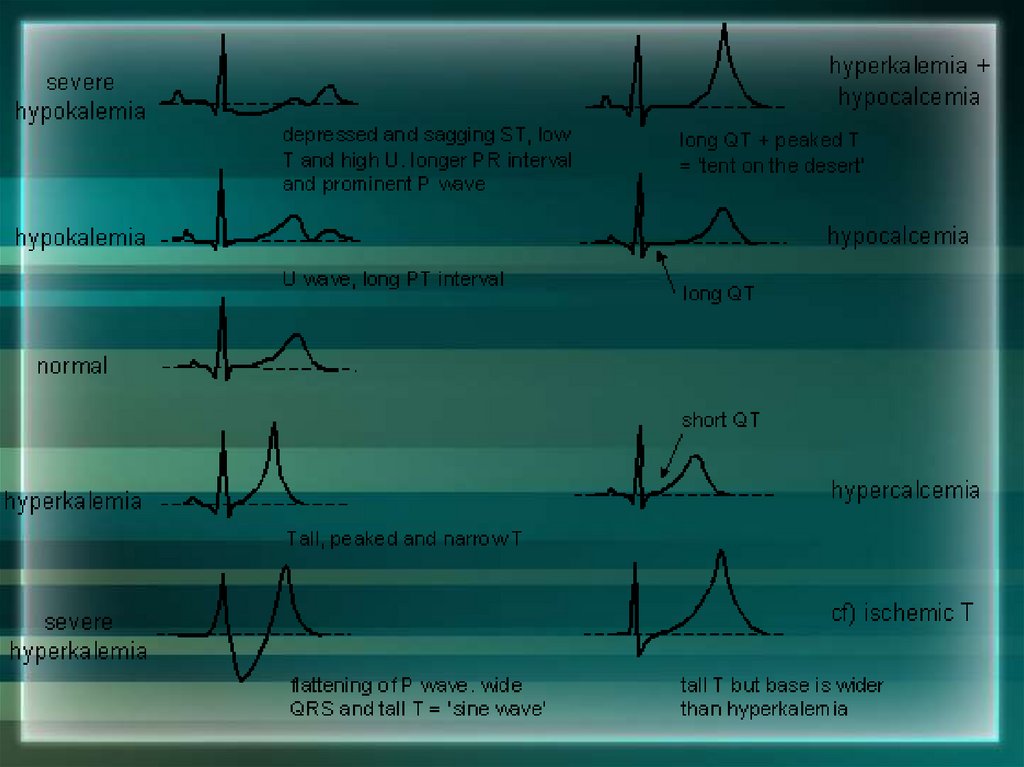
Electrolyte disturbances (i.e. hyperkalemia,
hypokalemia)
Drug toxicity (i.e. digoxin and drugs which
prolong the QT interval)
8. Depolarization
• Contraction of any muscle is associated withelectrical changes called depolarization
• These changes can be detected by electrodes
attached to the surface of the body
9. Pacemakers of the Heart
• SA Node - Dominant pacemaker with anintrinsic rate of 60 - 100 beats/minute.
• AV Node - Back-up pacemaker with an
intrinsic rate of 40 - 60 beats/minute.
• Ventricular cells - Back-up pacemaker with
an intrinsic rate of 20 - 45 bpm.
10.
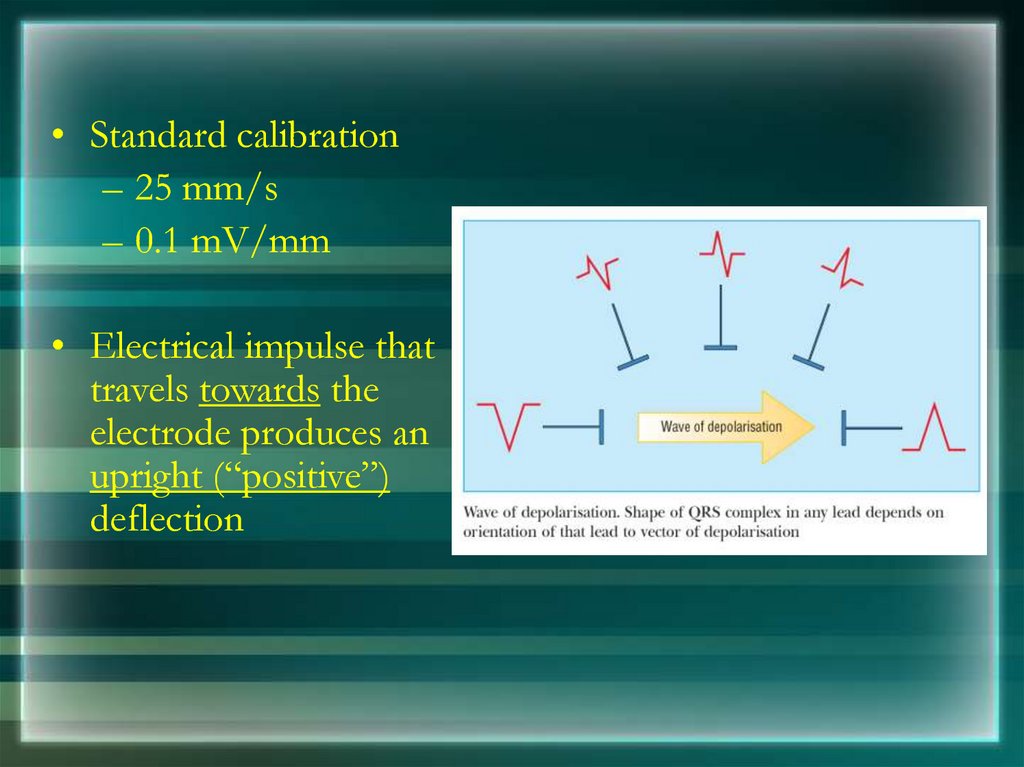
• Standard calibration– 25 mm/s
– 0.1 mV/mm
• Electrical impulse that
travels towards the
electrode produces an
upright (“positive”)
deflection
11. Impulse Conduction & the ECG
Impulse Conduction & the ECGSinoatrial node
AV node
Bundle of His
Bundle Branches
Purkinje fibers
12. The “PQRST”
• P wave - Atrialdepolarization
• QRS - Ventricular
depolarization
• T wave - Ventricular
repolarization
13. The PR Interval
Atrial depolarization+
delay in AV junction
(AV node/Bundle of His)
(delay allows time for
the atria to contract
before the ventricles
contract)
14. NORMAL ECG
15. The ECG Paper
• Horizontally– One small box - 0.04 s
– One large box - 0.20 s
• Vertically
– One large box - 0.5 mV
16.
EKG Leadswhich measure the difference in electrical potential
between two points
1. Bipolar Leads: Two different points on the body
2. Unipolar Leads: One point on the body and a virtual
reference point with zero electrical potential, located in
the center of the heart
17.
EKG LeadsThe standard EKG has 12 leads:
3 Standard Limb Leads
3 Augmented Limb Leads
6 Precordial Leads
18.
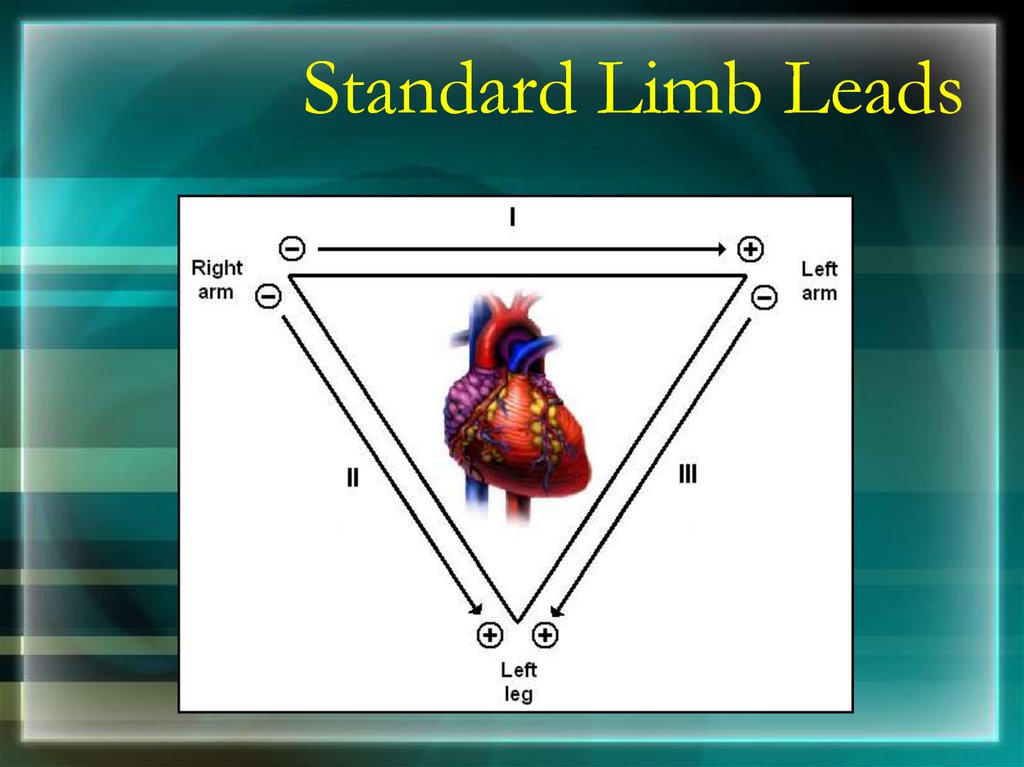
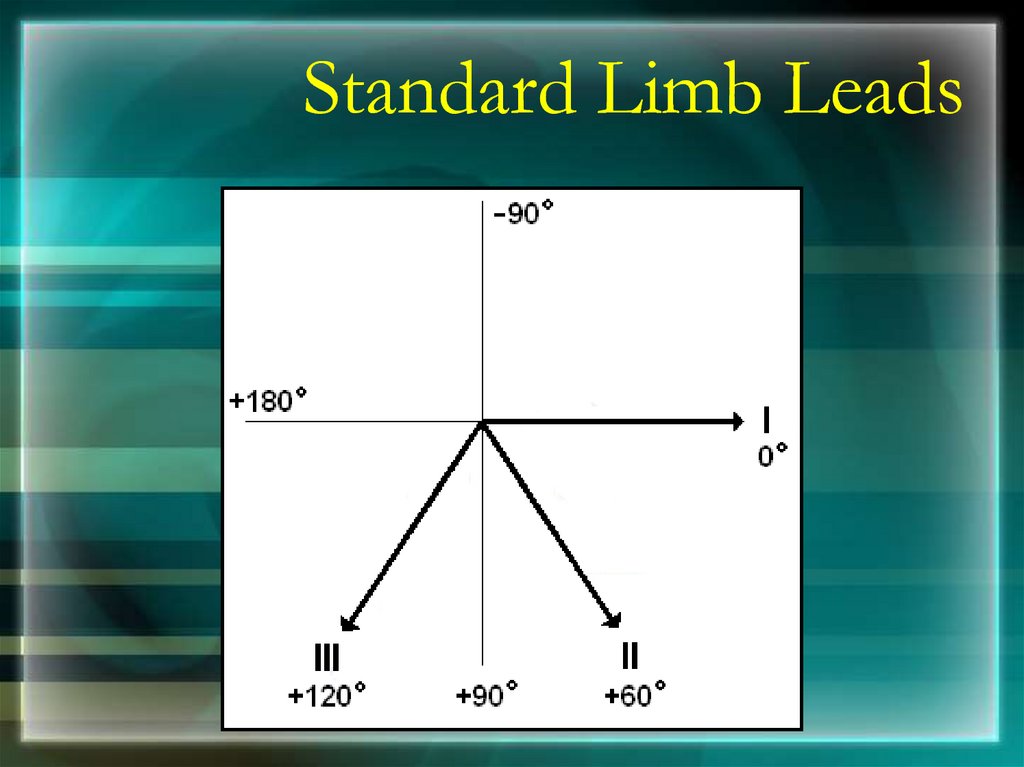
Standard Limb Leads19.
Standard Limb Leads20.
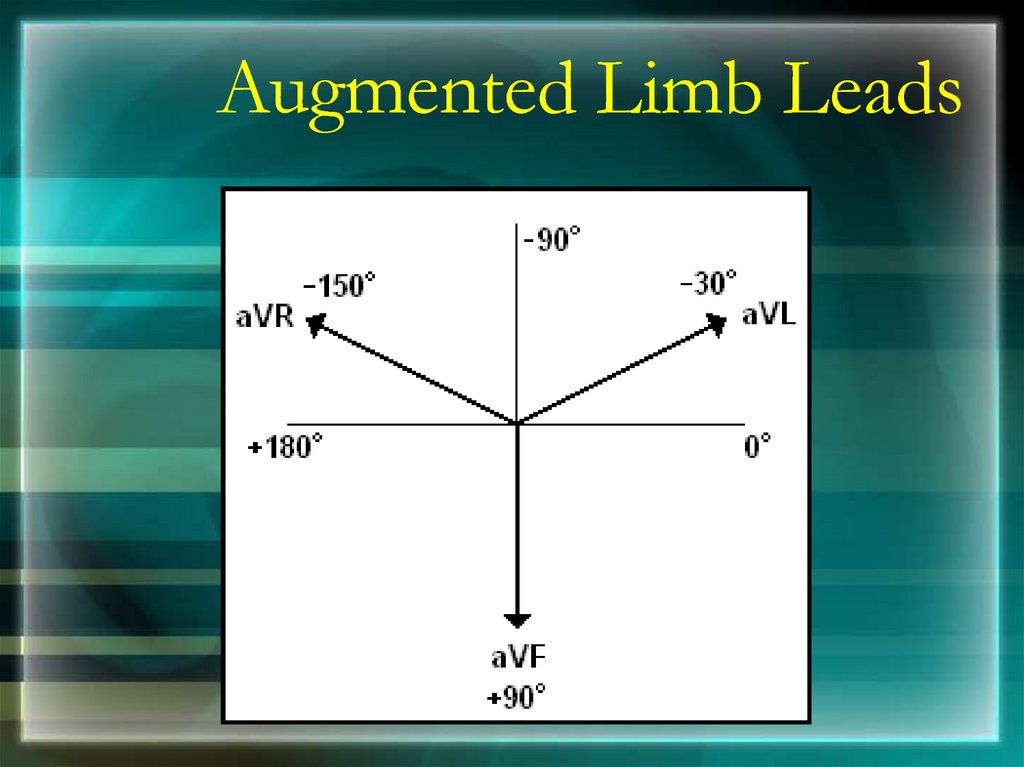
Augmented Limb Leads21.
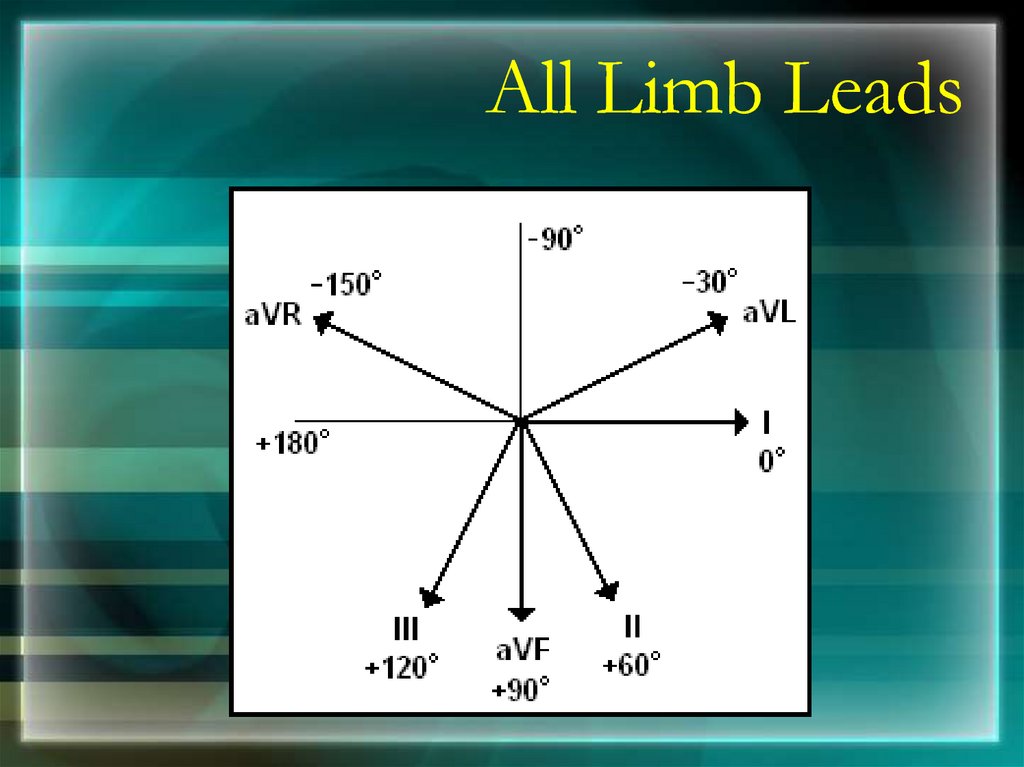
All Limb Leads22.
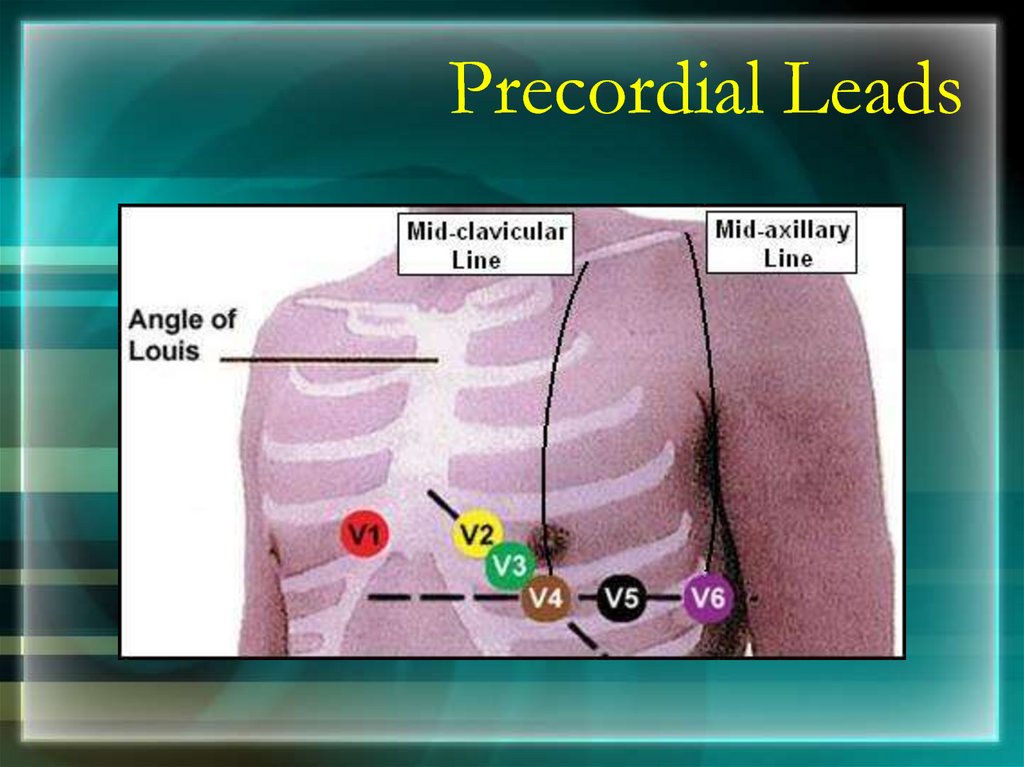
Precordial Leads23.
Precordial Leads24. Right Sided & Posterior Chest Leads
Right Sided & Posterior Chest Leads25.
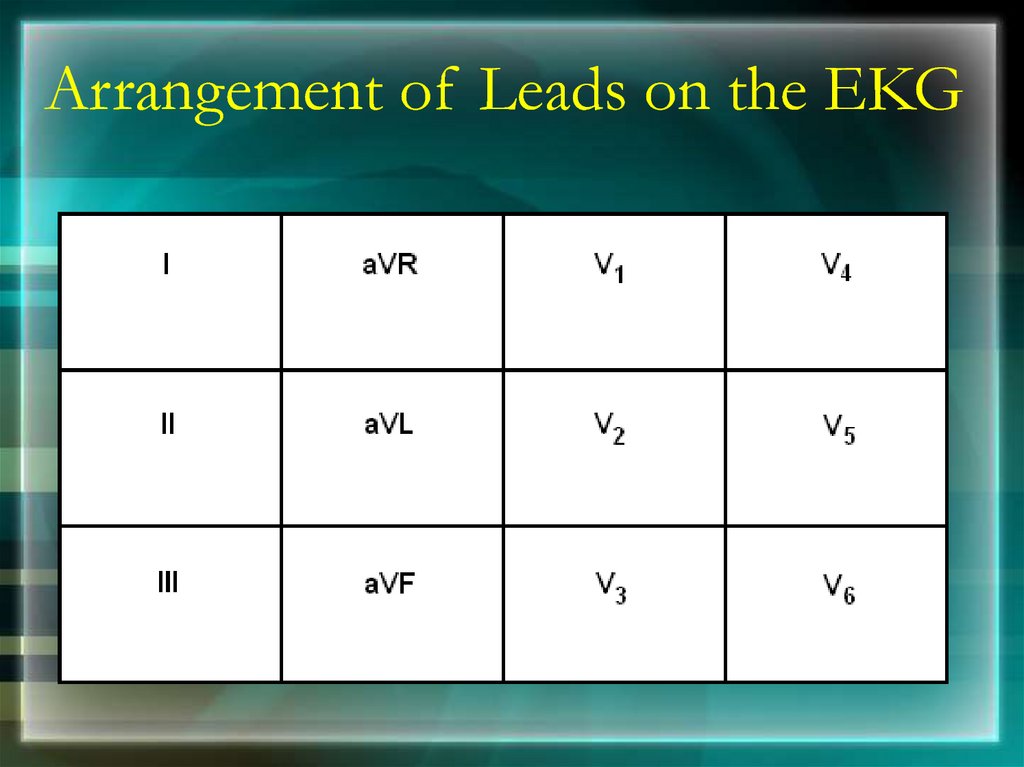
Arrangement of Leads on the EKG26.
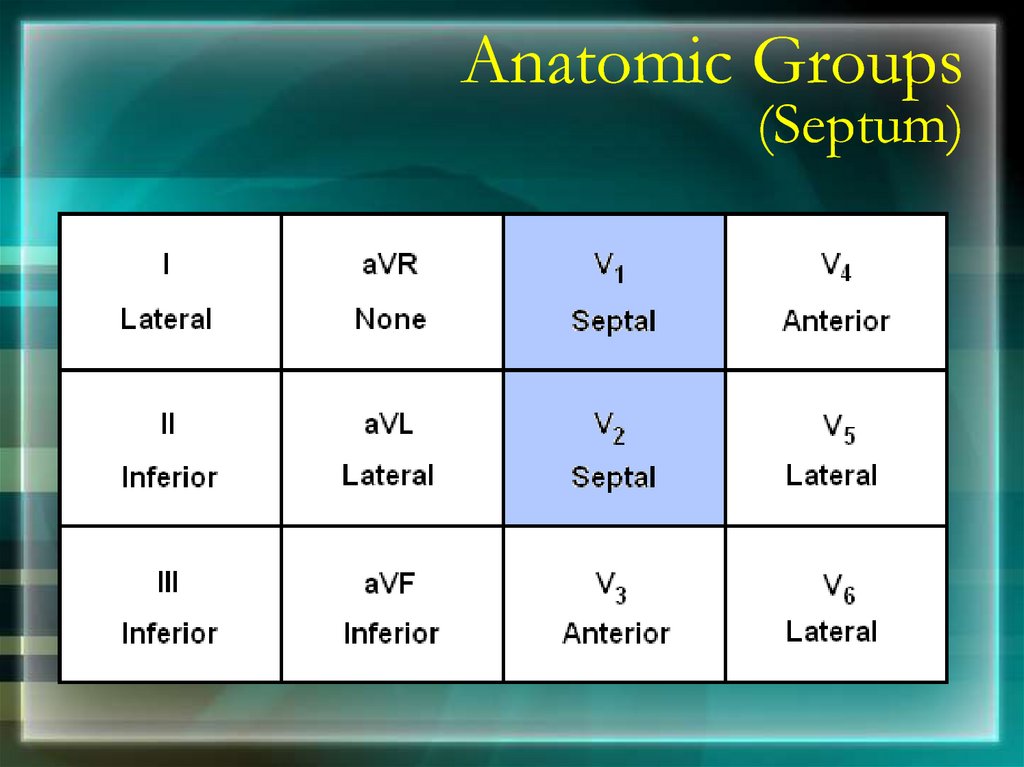
Anatomic Groups(Septum)
27.
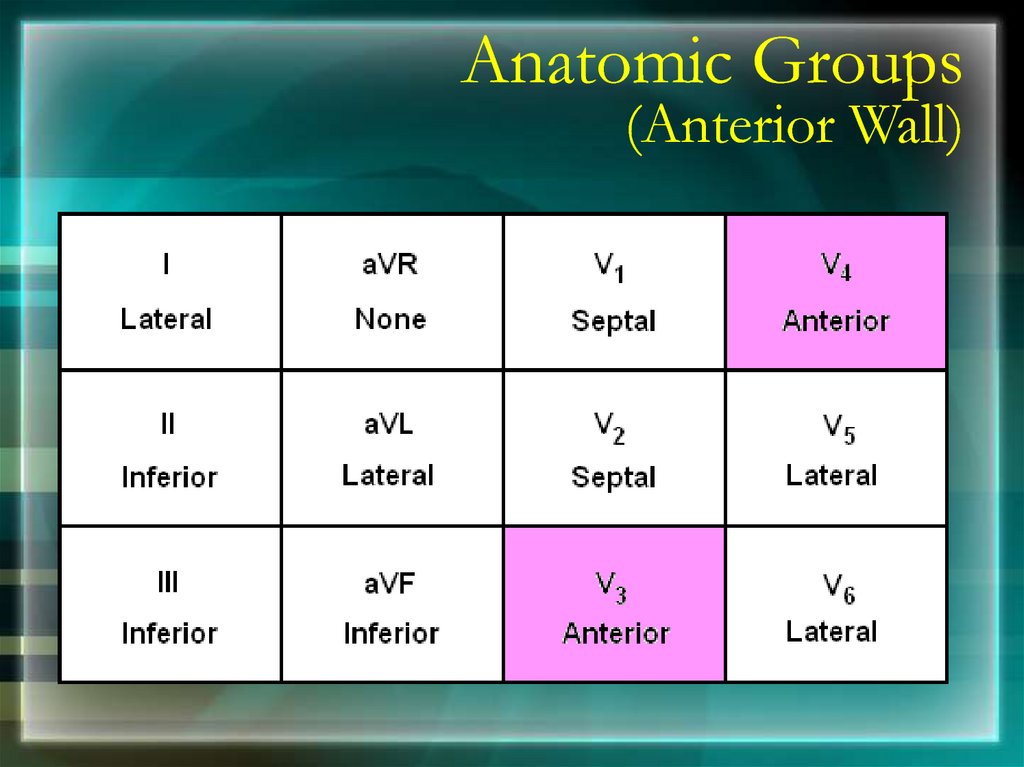
Anatomic Groups(Anterior Wall)
28.
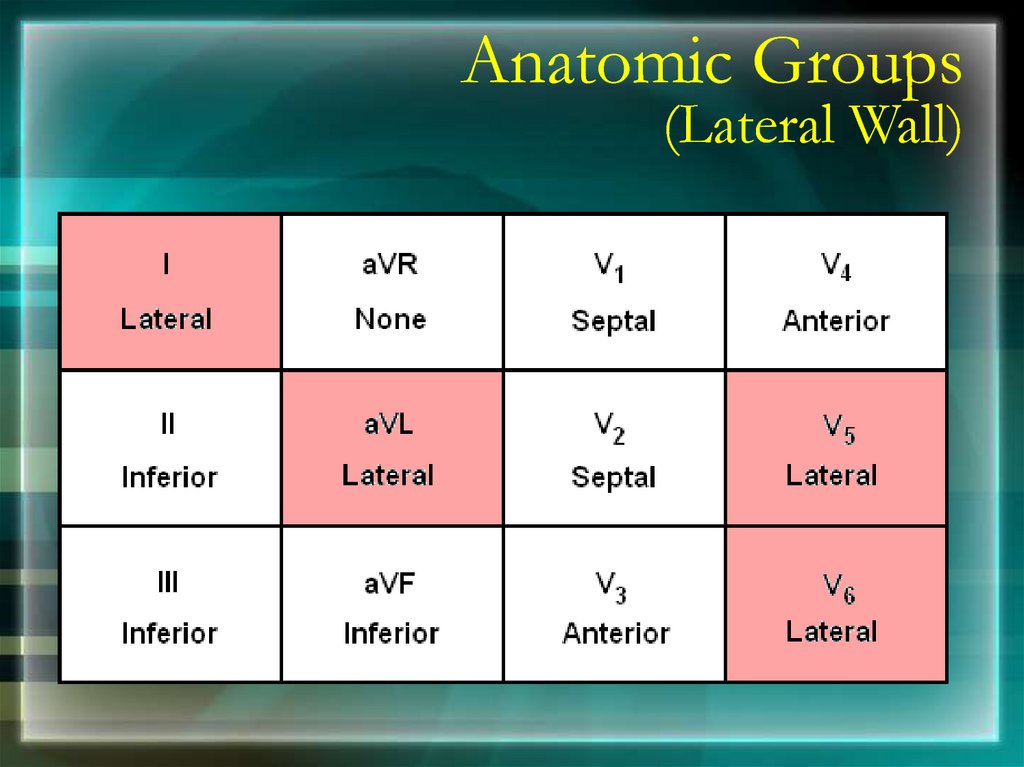
Anatomic Groups(Lateral Wall)
29.
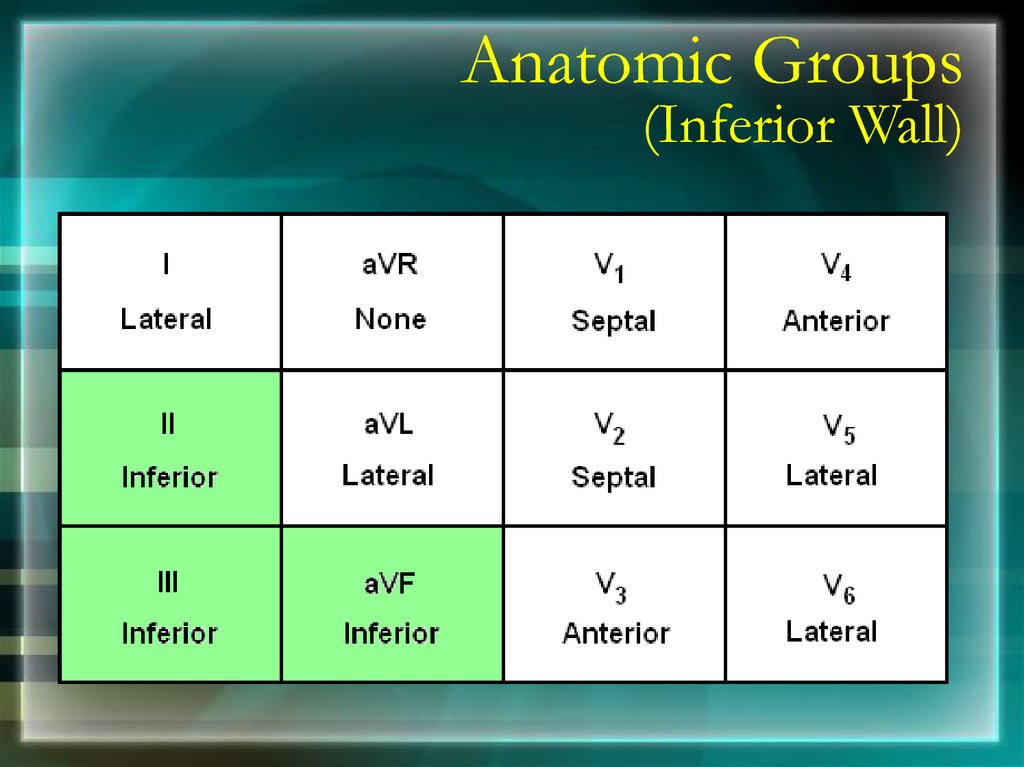
Anatomic Groups(Inferior Wall)
30.
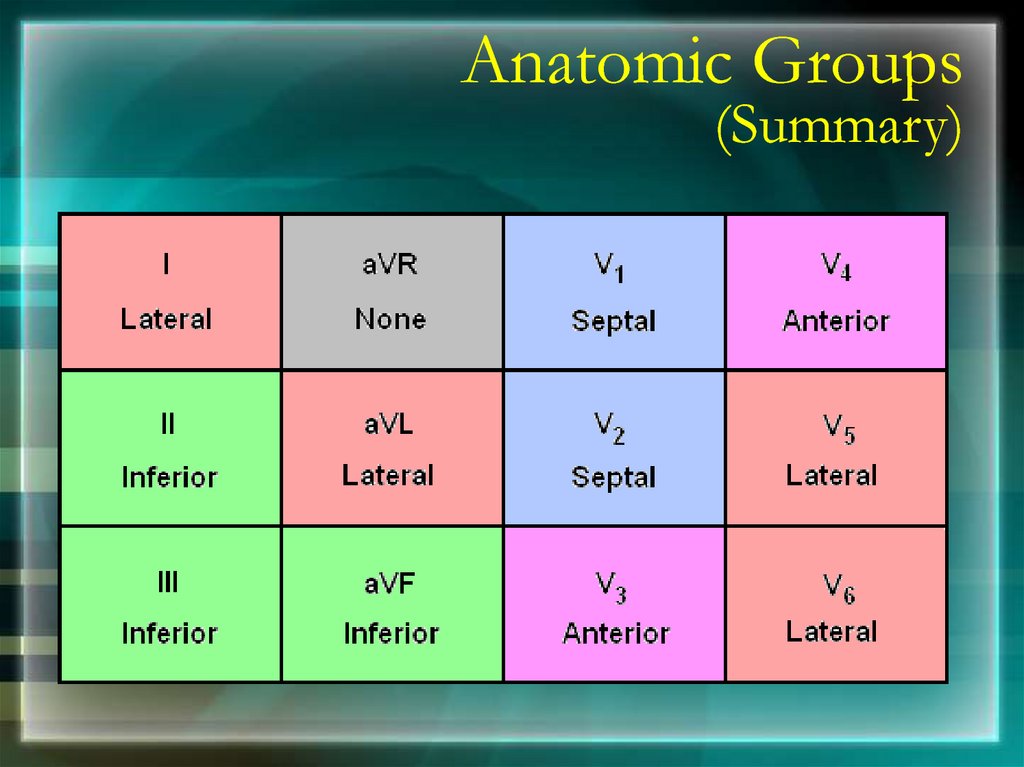
Anatomic Groups(Summary)
31. ECG RULES
• Professor Chamberlains 10 rules of normal:-32. RULE 1
PR interval should be 120 to 200milliseconds or 3 to 5 little squares
33. RULE 2
The width of the QRS complex should notexceed 110 ms, less than 3 little squares
34. RULE 3
The QRS complex should be dominantly upright inleads I and II
35. RULE 4
QRS and T waves tend to have the samegeneral direction in the limb leads
36. RULE 5
All waves are negative in lead aVR37. RULE 6
The R wave must grow from V1 to at least V4The S wave must grow from V1 to at least V3
and disappear in V6
38. RULE 7
The ST segment should start isoelectricexcept in V1 and V2 where it may be elevated
39. RULE 8
The P waves should be upright in I, II, and V2 to V640. RULE 9
There should be no Q wave or only a small q lessthan 0.04 seconds in width in I, II, V2 to V6
41. RULE 10
The T wave must be upright in I, II, V2 to V642. P wave
Always positive in lead I and II
Always negative in lead aVR
< 3 small squares in duration
< 2.5 small squares in amplitude
Commonly biphasic in lead V1
Best seen in leads II
43. Right Atrial Enlargement
• Tall (> 2.5 mm), pointed P waves (P Pulmonale)44. Left Atrial Enlargement
• Notched/bifid (‘M’ shaped) P wave (P‘mitrale’) in limb leads
45. P Pulmonale
P Mitrale46. Short PR Interval
• WPW (WolffParkinson-White)Syndrome
• Accessory pathway
(Bundle of Kent)
allows early activation
of the ventricle (delta
wave and short PR
interval)
47. Long PR Interval
• First degree Heart Block48. QRS Complexes
• Nonpathological Q waves may present in I, III, aVL,V5, and V6
• R wave in lead V6 is smaller than V5
• Depth of the S wave, should not exceed 30 mm
• Pathological Q wave > 2mm deep and > 1mm wide or
> 25% amplitude of the subsequent R wave
49. QRS in LVH & RVH
QRS in LVH & RVH50. Conditions with Tall R in V1
51. Right Atrial and Ventricular Hypertrophy
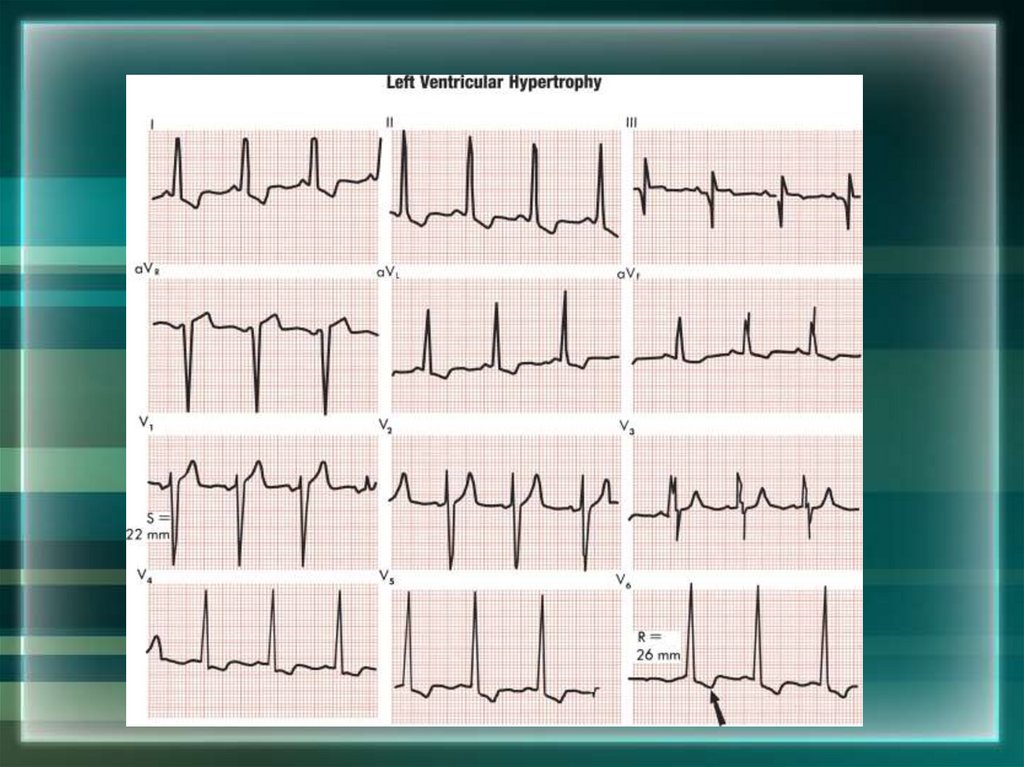
52. Left Ventricular Hypertrophy
• Sokolow & Lyon Criteria• S in V1+ R in V5 or V6 > 35 mm
• An R wave of 11 to 13 mm (1.1 to 1.3 mV)
or more in lead aVL is another sign of
LVH
53.
54. ST Segment
• ST Segment is flat (isoelectric)• Elevation or depression of ST segment by
1 mm or more
• “J” (Junction) point is the point between
QRS and ST segment
55. Variable Shapes Of ST Segment Elevations in AMI
Goldberger AL. Goldberger: Clinical Electrocardiography: A Simplified Approach. 7thed: Mosby Elsevier; 2006.
56. T wave
• Normal T wave is asymmetrical, first half having agradual slope than the second
• Should be at least 1/8 but less than 2/3 of the
amplitude of the R
• T wave amplitude rarely exceeds 10 mm
• Abnormal T waves are symmetrical, tall, peaked,
biphasic or inverted.
• T wave follows the direction of the QRS deflection.
57. T wave
58. QT interval
1. Total duration of Depolarization andRepolarization
2. QT interval decreases when heart rate increases
3. For HR = 70 bpm, QT<0.40 sec.
4. QT interval should be 0.35 0.45 s,
5. Should not be more than half of the interval
between adjacent R waves (RR interval).
59. QT Interval
60. U wave
• U wave related to afterdepolarizations whichfollow repolarization
• U waves are small, round, symmetrical and
positive in lead II, with amplitude < 2 mm
• U wave direction is the same as T wave
• More prominent at slow heart rates
61.
Determining the Heart RateRule of 300/1500
10 Second Rule
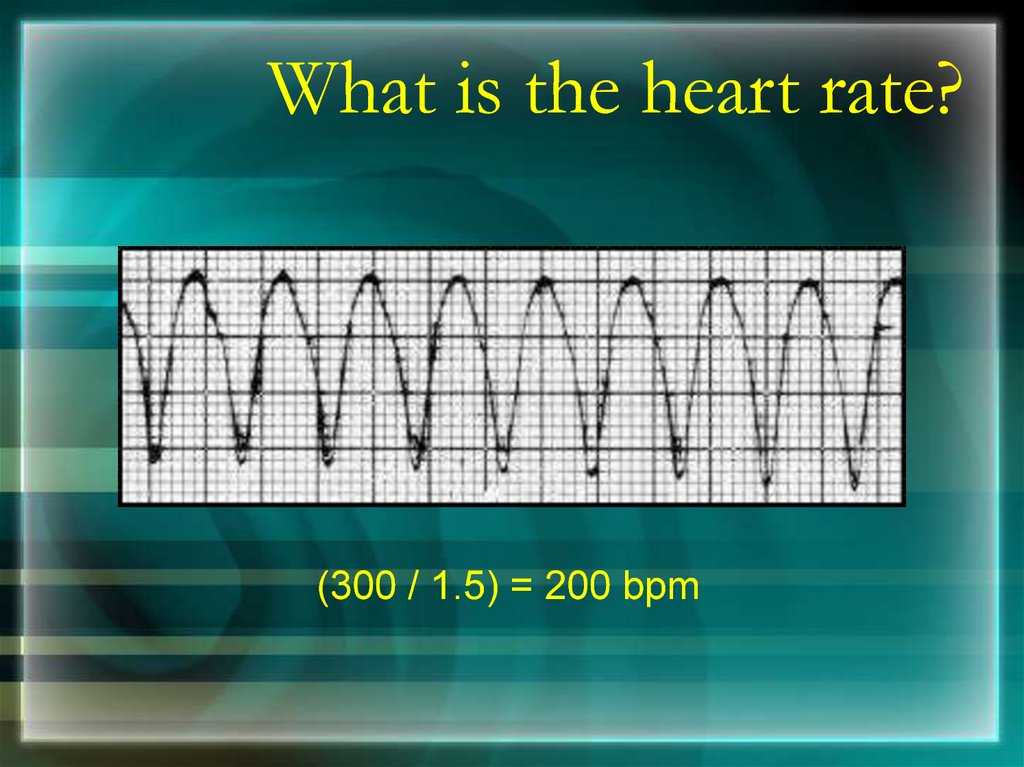
62.
Rule of 300Count the number of “big boxes” between two
QRS complexes, and divide this into 300. (smaller
boxes with 1500)
for regular rhythms.
63.
What is the heart rate?(300 / 6) = 50 bpm
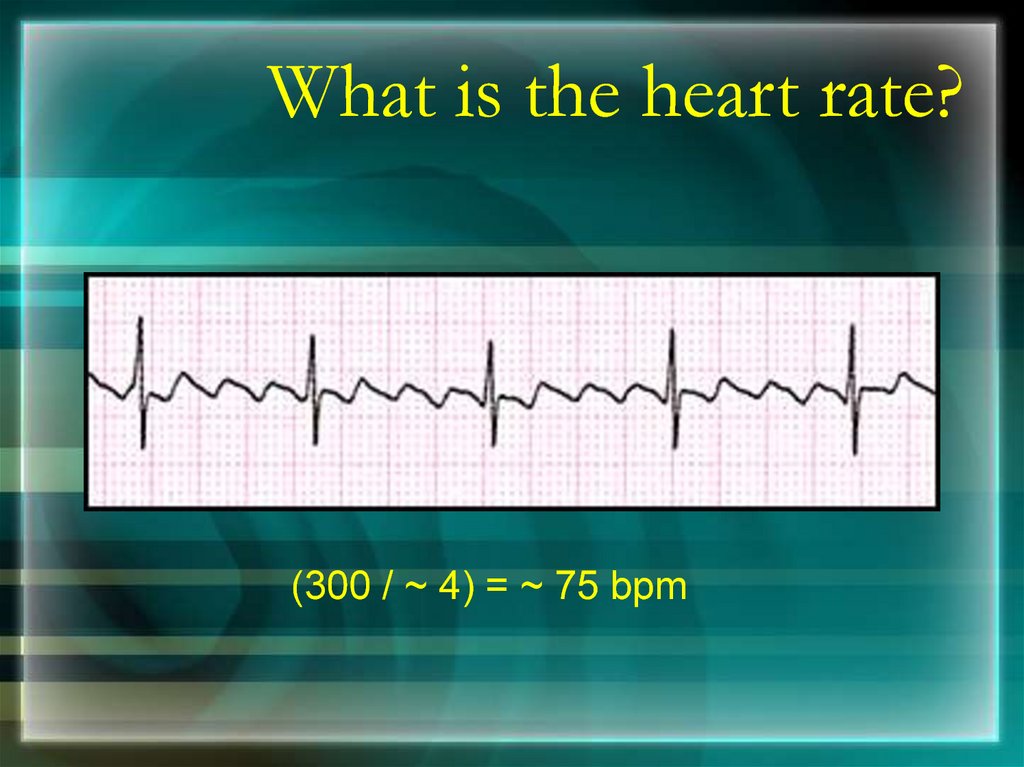
64.
What is the heart rate?(300 / ~ 4) = ~ 75 bpm
65.
What is the heart rate?(300 / 1.5) = 200 bpm
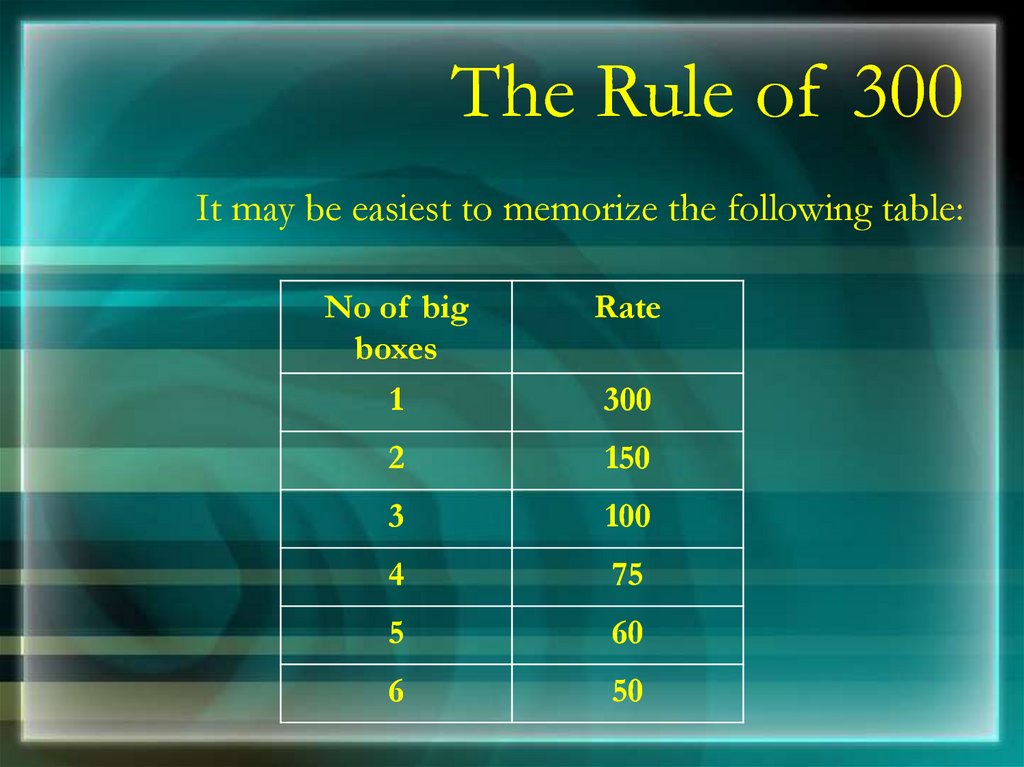
66.
The Rule of 300It may be easiest to memorize the following table:
No of big
boxes
Rate
1
300
2
150
3
100
4
75
5
60
6
50
67.
10 Second RuleEKGs record 10 seconds of rhythm per page,
Count the number of beats present on the EKG
Multiply by 6
For irregular rhythms.
68.
What is the heart rate?33 x 6 = 198 bpm
69. Calculation of Heart Rate
70. Question
• Calculate the heart rate71.
The QRS AxisThe QRS axis represents overall direction of the
heart’s electrical activity.
Abnormalities hint at:
Ventricular enlargement
Conduction blocks (i.e. hemiblocks)
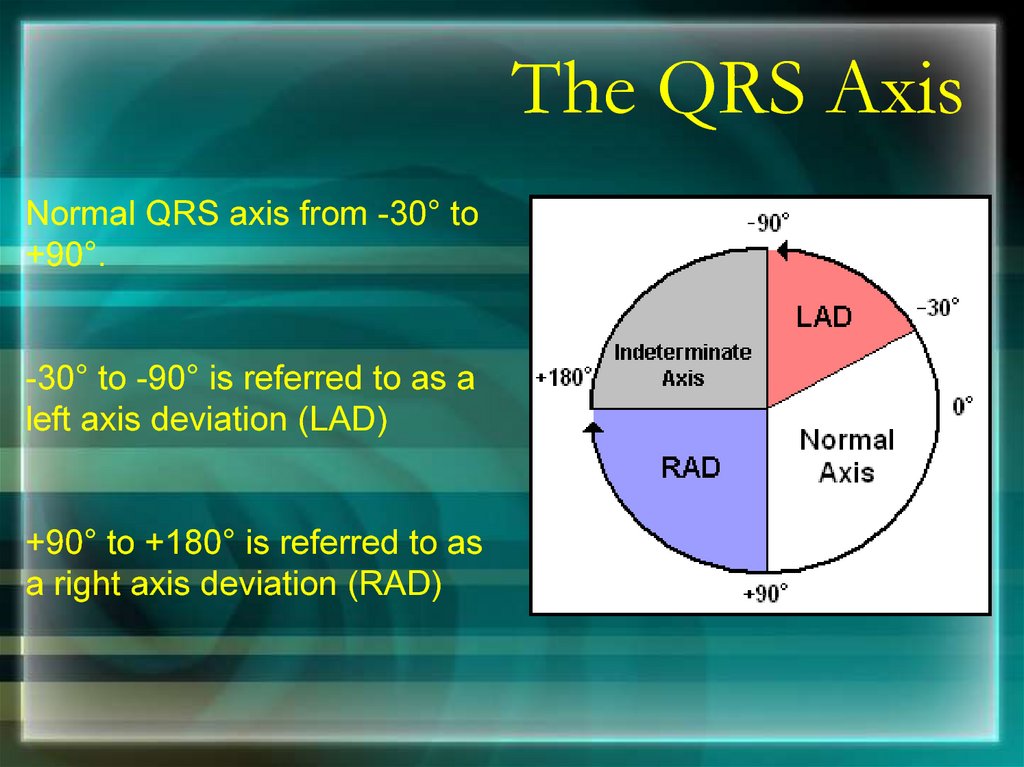
72.
The QRS AxisNormal QRS axis from -30° to
+90°.
-30° to -90° is referred to as a
left axis deviation (LAD)
+90° to +180° is referred to as
a right axis deviation (RAD)
73.
Determining the AxisThe Quadrant Approach
The Equiphasic Approach
74.
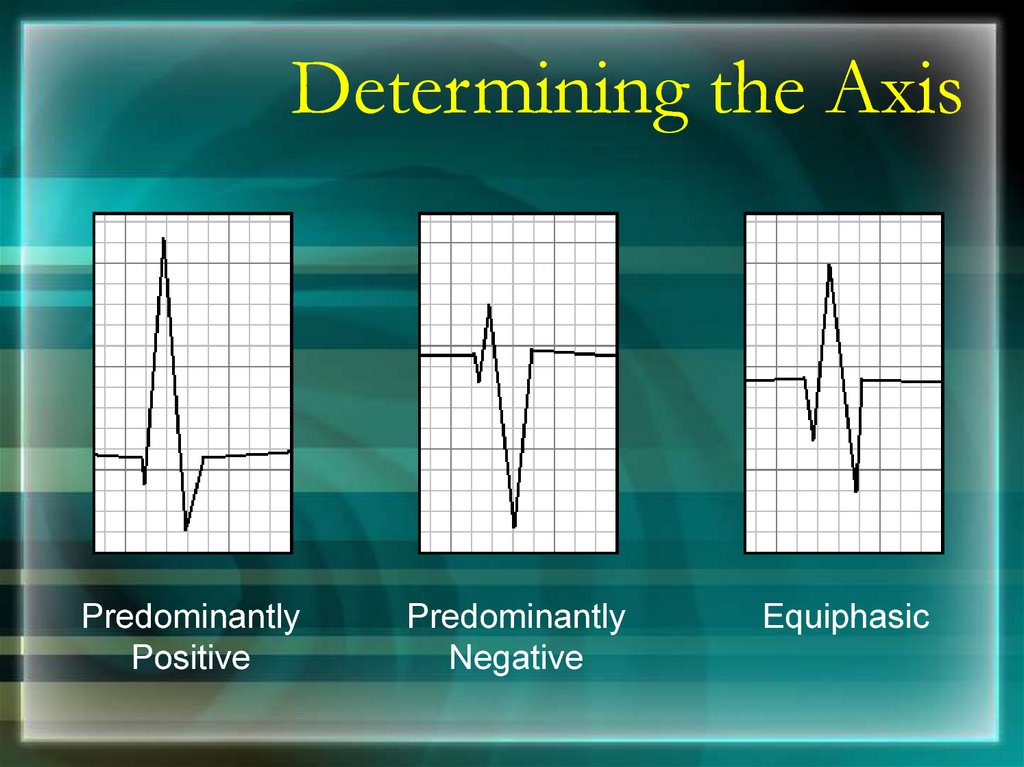
Determining the AxisPredominantly
Positive
Predominantly
Negative
Equiphasic
75.
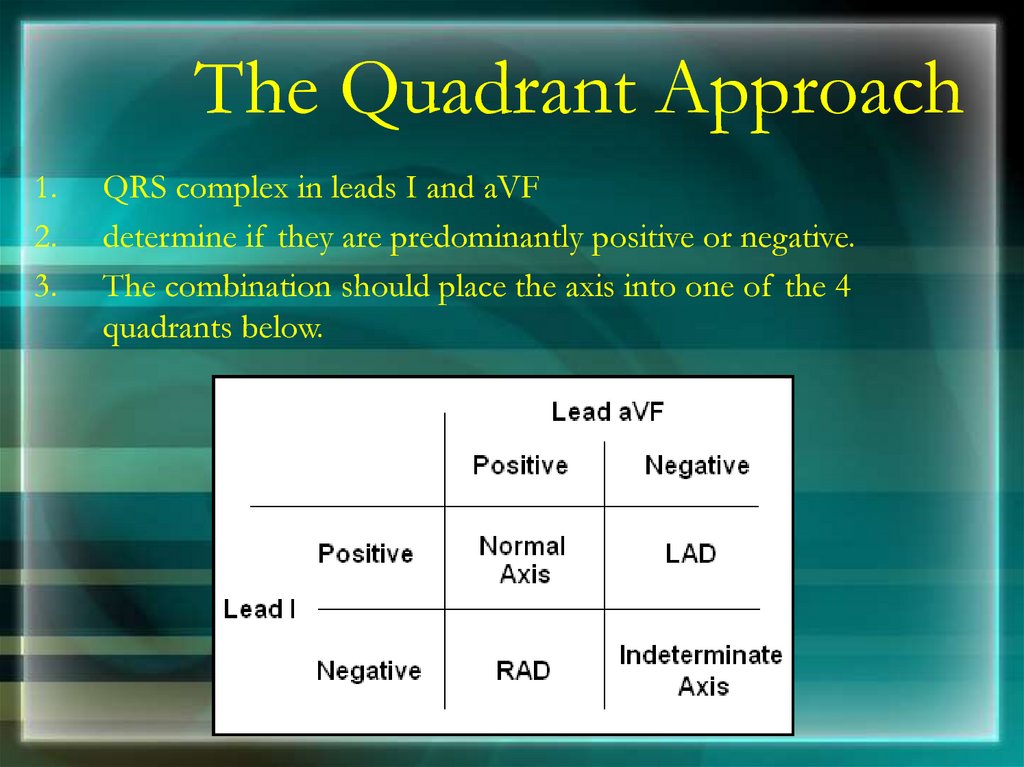
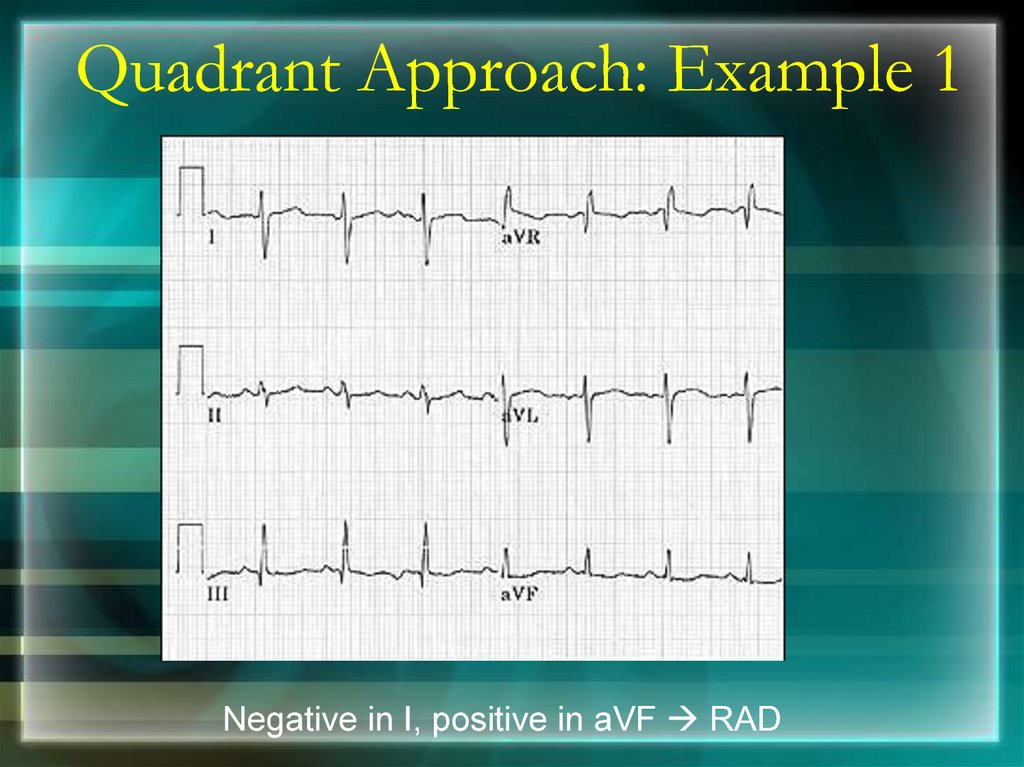
The Quadrant Approach1.
2.
3.
QRS complex in leads I and aVF
determine if they are predominantly positive or negative.
The combination should place the axis into one of the 4
quadrants below.
76.
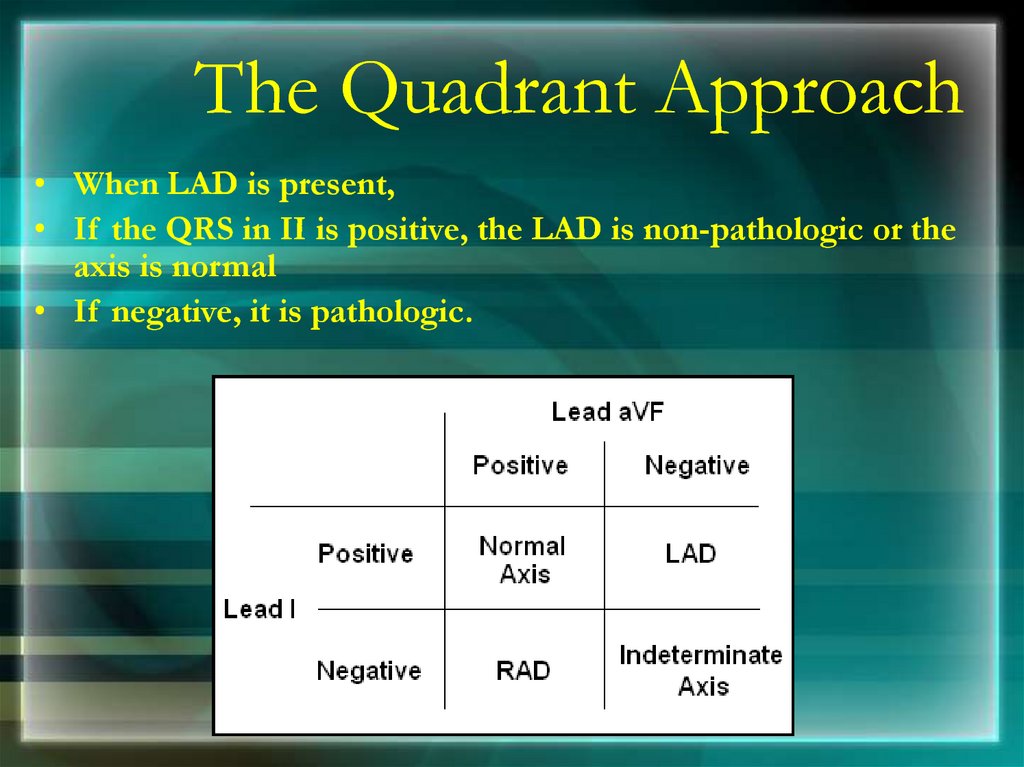
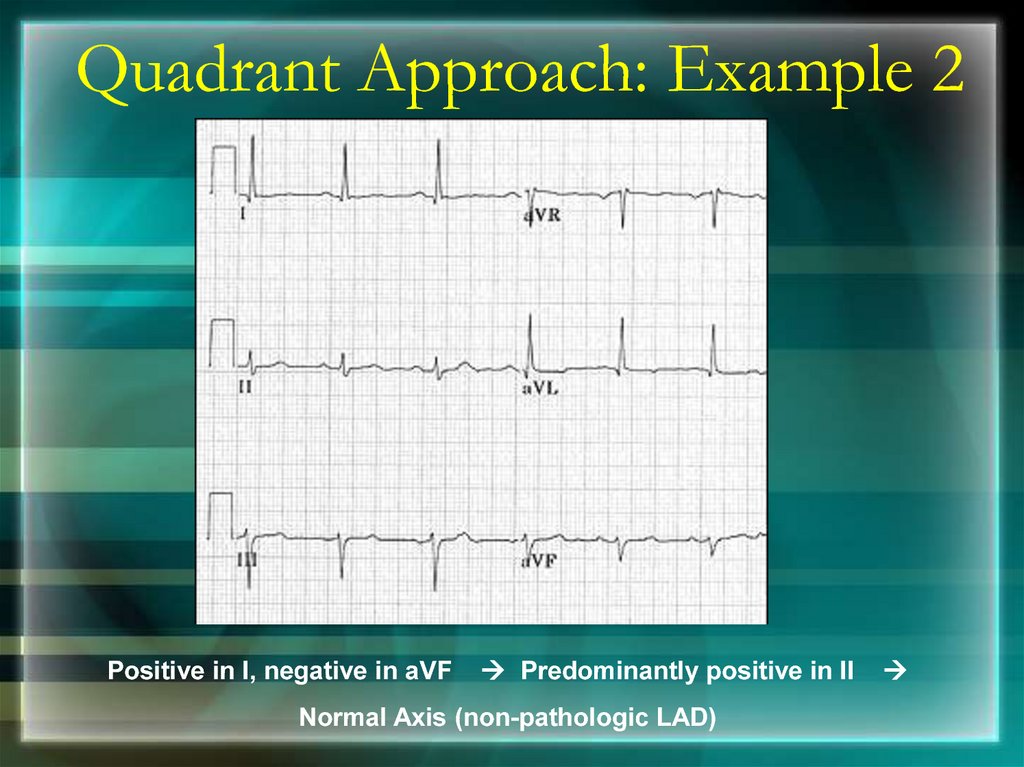
The Quadrant Approach• When LAD is present,
• If the QRS in II is positive, the LAD is non-pathologic or the
axis is normal
• If negative, it is pathologic.
77.
Quadrant Approach: Example 1Negative in I, positive in aVF RAD
78.
Quadrant Approach: Example 2Positive in I, negative in aVF
Predominantly positive in II
Normal Axis (non-pathologic LAD)
79.
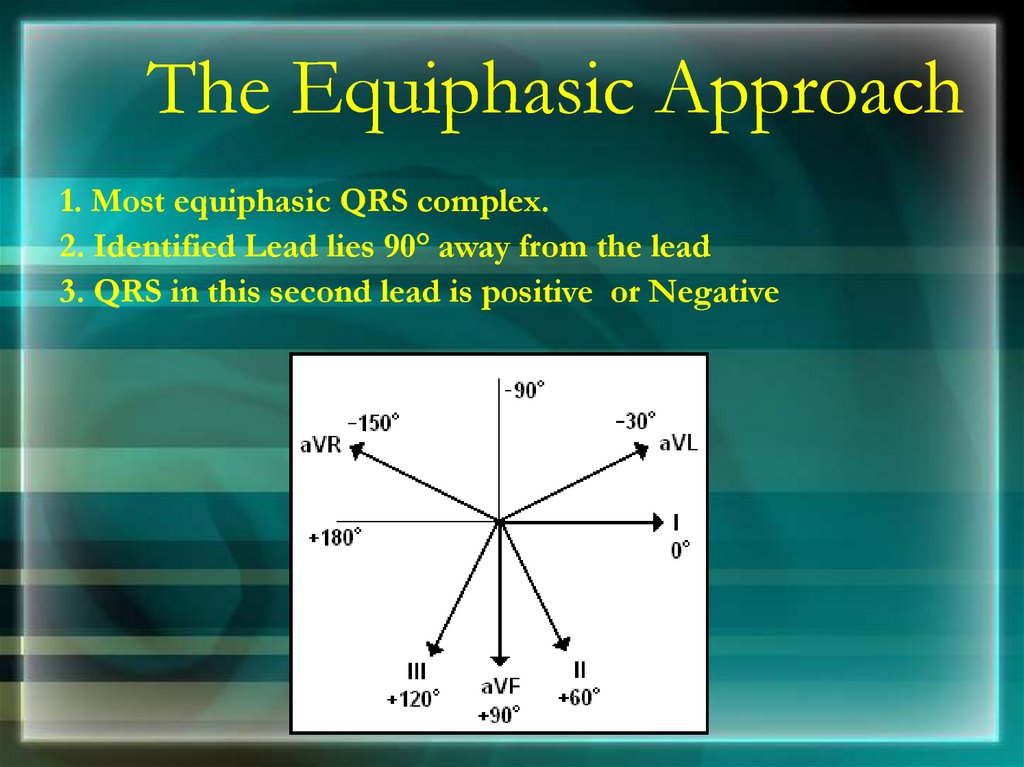
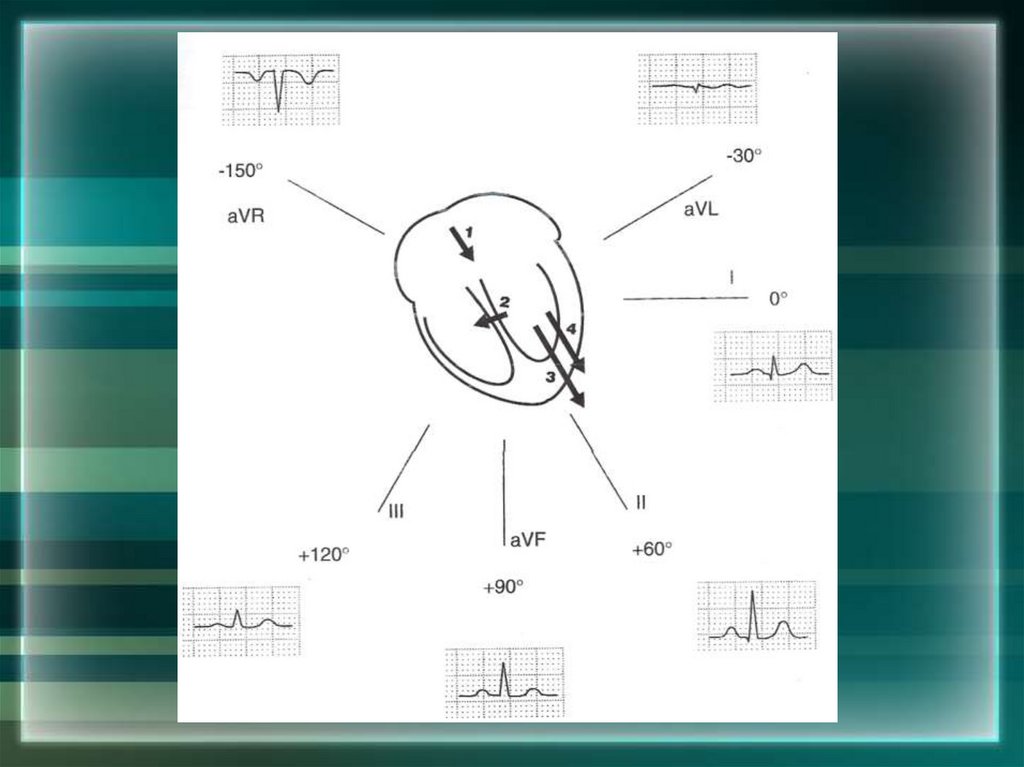
The Equiphasic Approach1. Most equiphasic QRS complex.
2. Identified Lead lies 90° away from the lead
3. QRS in this second lead is positive or Negative
80.
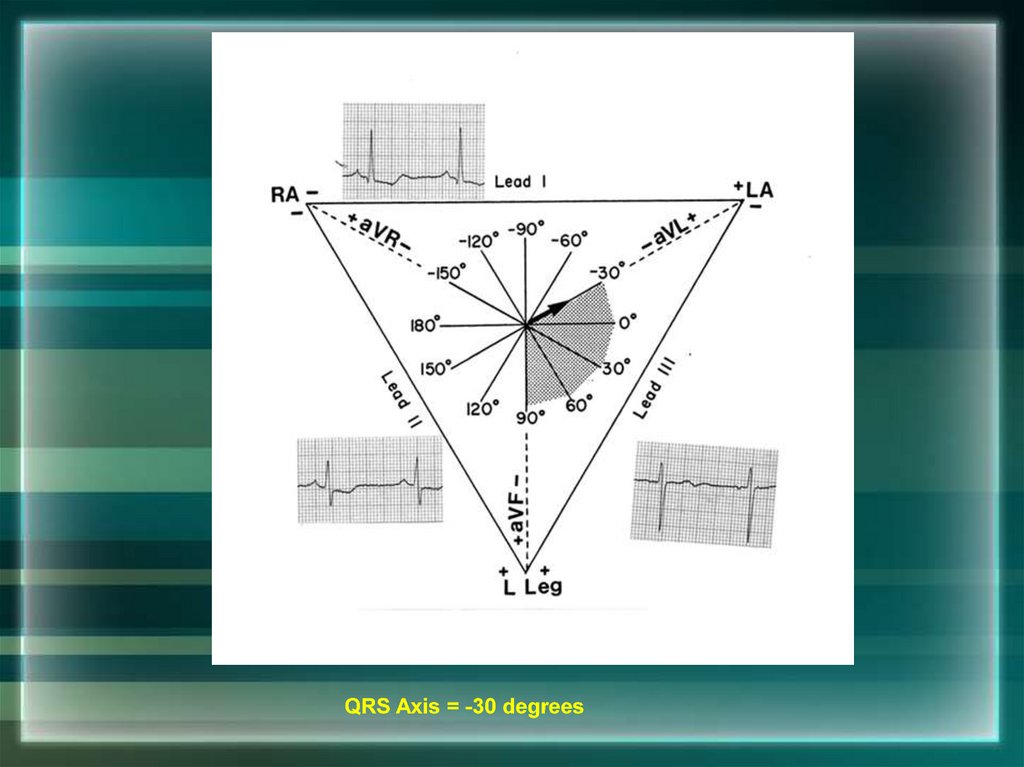
QRS Axis = -30 degrees81.
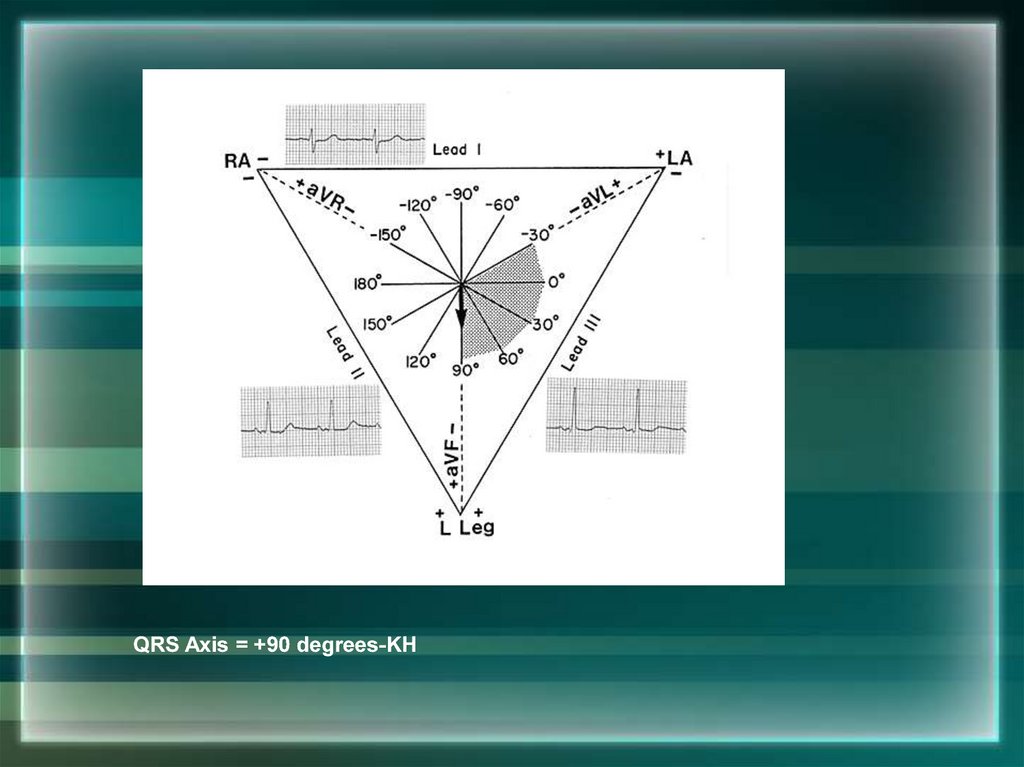
QRS Axis = +90 degrees-KH82.
83.
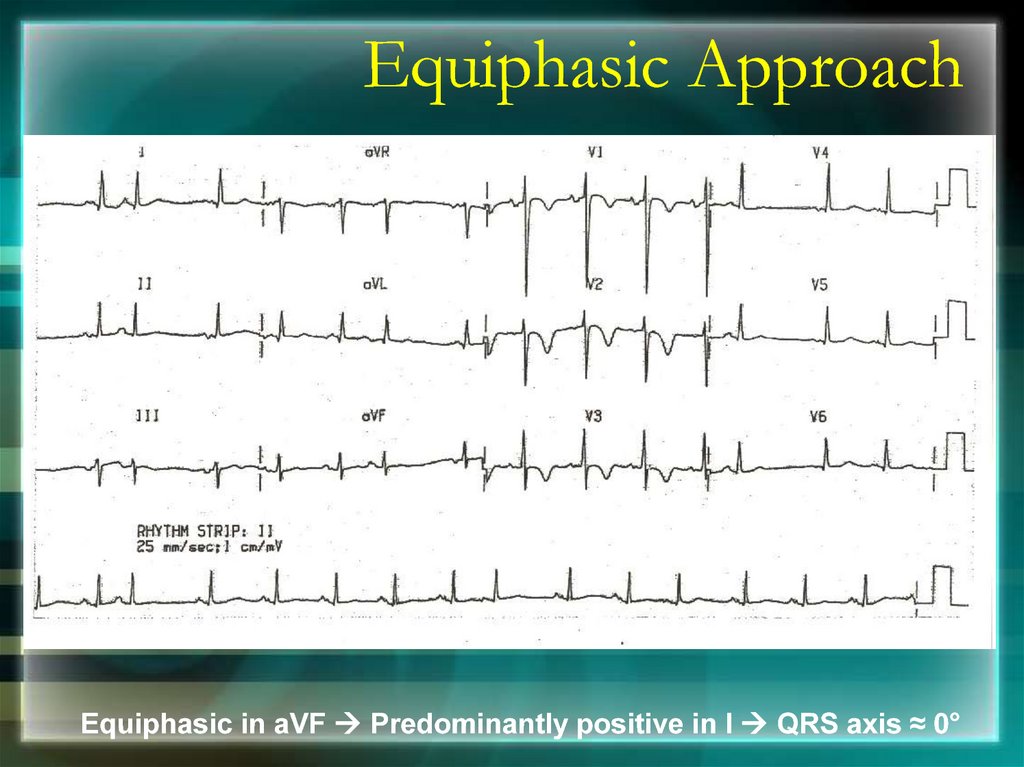
Equiphasic ApproachEquiphasic in aVF Predominantly positive in I QRS axis ≈ 0°
84.
Thank You85. BRADYARRYTHMIA
Dr Subroto Mandal, MD, DM, DCAssociate Professor, Cardiology
86. Classification
Sinus Bradycardia
Junctional Rhythm
Sino Atrial Block
Atrioventricular block
87. Impulse Conduction & the ECG
Impulse Conduction & the ECGSinoatrial node
AV node
Bundle of His
Bundle Branches
88. Sinus Bradycardia
89. Junctional Rhythm
90. SA Block
Sinus impulses is blocked within the SA junction
Between SA node and surrounding myocardium
Abscent of complete Cardiac cycle
Occures irregularly and unpredictably
Present :Young athletes, Digitalis, Hypokalemia, Sick
Sinus Syndrome
91. AV Block
• First Degree AV Block• Second Degree AV Block
• Third Degree AV Block
92. First Degree AV Block
Delay in the conduction through the conducting system
Prolong P-R interval
All P waves are followed by QRS
Associated with : AC Rheumati Carditis, Digitalis, Beta
Blocker, excessive vagal tone, ischemia, intrinsic disease in
the AV junction or bundle branch system.
93. Second Degree AV Block
Intermittent failure of AV conduction
Impulse blocked by AV node
Types:
Mobitz type 1 (Wenckebach Phenomenon)
Mobitz type 2
94.
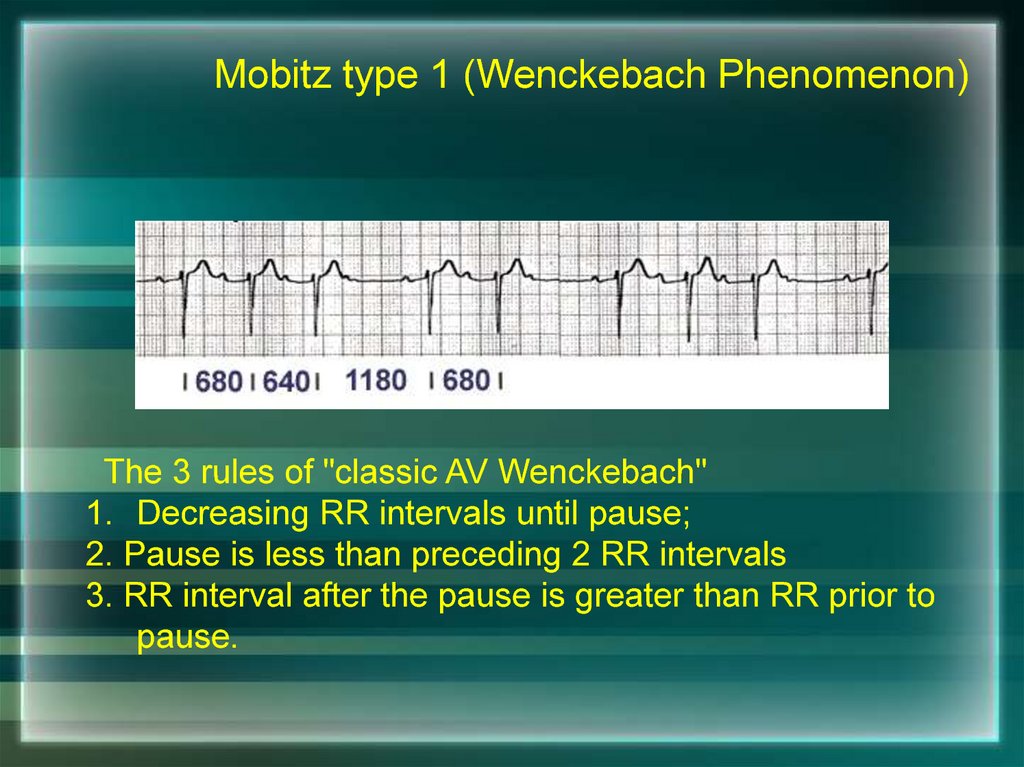
Mobitz type 1 (Wenckebach Phenomenon)The 3 rules of "classic AV Wenckebach"
1. Decreasing RR intervals until pause;
2. Pause is less than preceding 2 RR intervals
3. RR interval after the pause is greater than RR prior to
pause.
95. Mobitz type 1 (Wenckebach Phenomenon)
96.
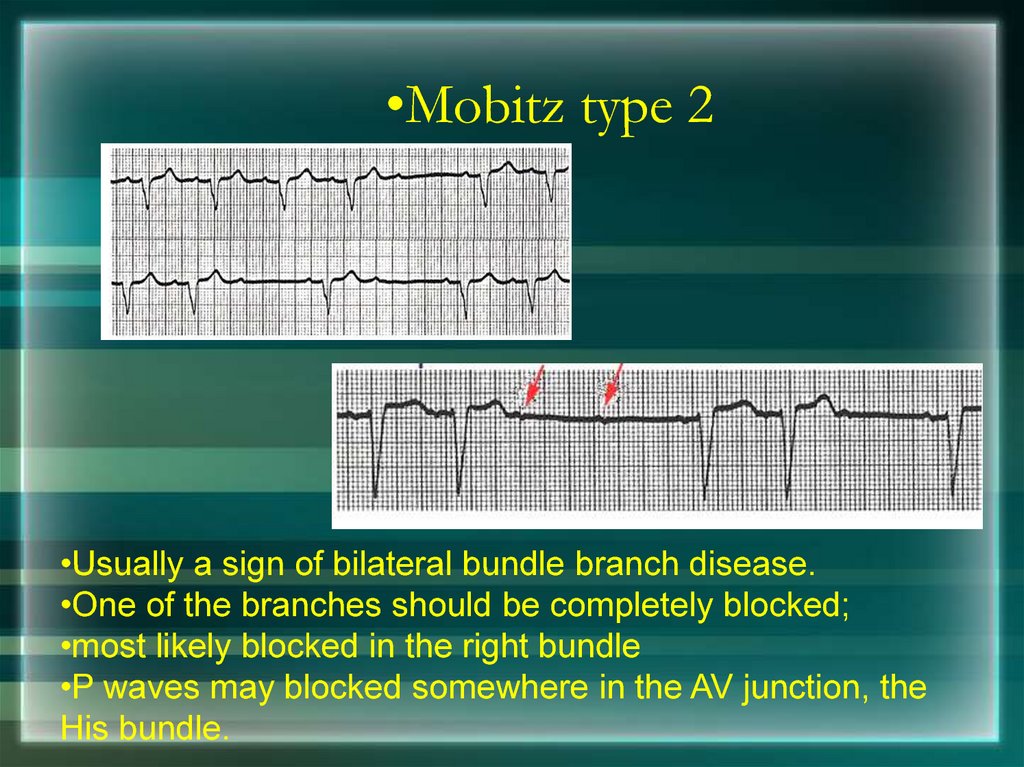
•Mobitz type 2•Usually a sign of bilateral bundle branch disease.
•One of the branches should be completely blocked;
•most likely blocked in the right bundle
•P waves may blocked somewhere in the AV junction, the
His bundle.
97. Third Degree Heart Block
•CHB evidenced by the AV dissociation•A junctional escape rhythm at 45 bpm.
•The PP intervals vary because of ventriculophasic sinus arrhythmia;
98. Third Degree Heart Block
3rd degree AV block with a left ventricular escape rhythm,'B' the right ventricular pacemaker rhythm is shown.
99.
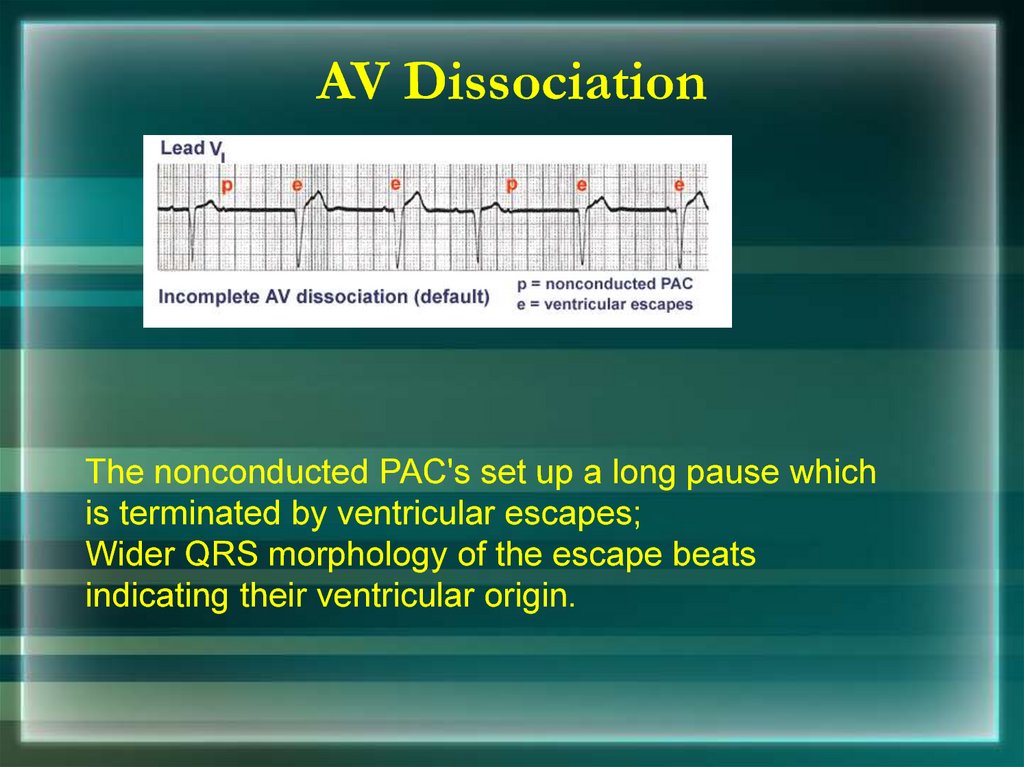
AV DissociationThe nonconducted PAC's set up a long pause which
is terminated by ventricular escapes;
Wider QRS morphology of the escape beats
indicating their ventricular origin.
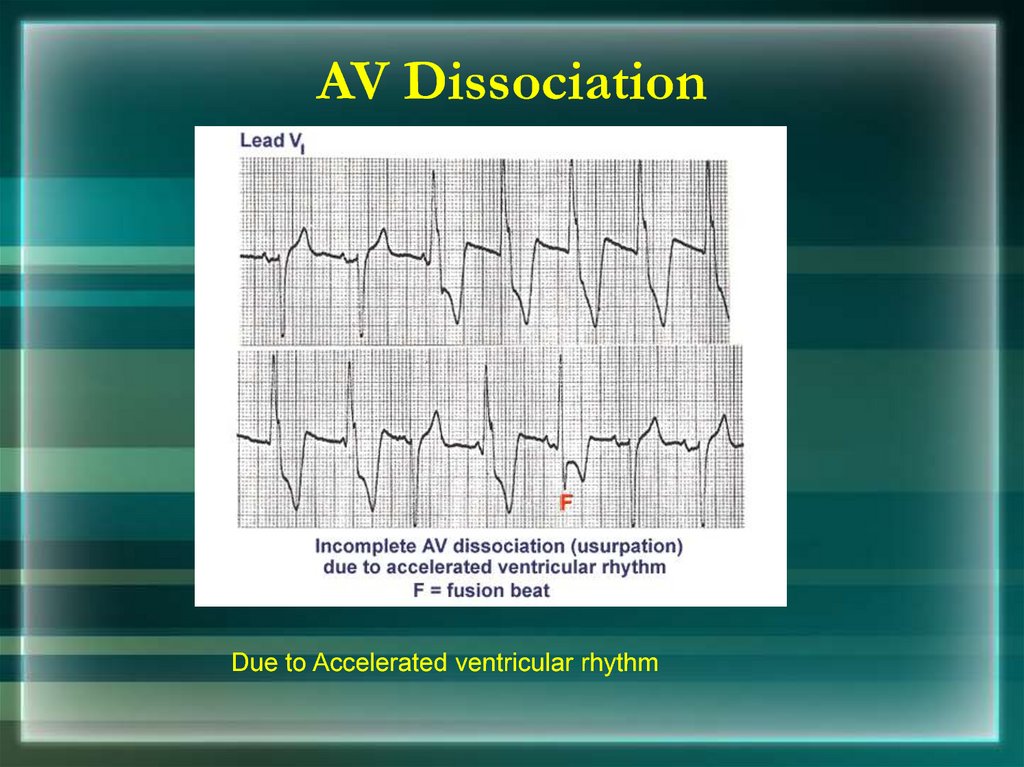
100.
AV DissociationDue to Accelerated ventricular rhythm
101.
Thank You102. Putting it all Together
Do you think this person is having amyocardial infarction. If so, where?
103. Interpretation
Yes, this person is having an acute anteriorwall myocardial infarction.
104. Putting it all Together
Now, where do you think this person ishaving a myocardial infarction?
105. Inferior Wall MI
This is an inferior MI. Note the ST elevationin leads II, III and aVF.
106. Putting it all Together
How about now?107. Anterolateral MI
This person’s MI involves both the anterior wall(V2-V4) and the lateral wall (V5-V6, I, and aVL)!
108. Rhythm #6
Rate?
Regularity?
P waves?
PR interval?
QRS duration?
70 bpm
regular
flutter waves
none
0.06 s
Interpretation? Atrial Flutter
109. Rhythm #7
Rate?
Regularity?
P waves?
PR interval?
QRS duration?
74 148 bpm
Regular regular
Normal none
0.16 s none
0.08 s
Interpretation? Paroxysmal Supraventricular
Tachycardia (PSVT)
110. PSVT
• Deviation from NSR– The heart rate suddenly speeds up, often
triggered by a PAC (not seen here) and the P
waves are lost.
111. Ventricular Arrhythmias
• Ventricular Tachycardia• Ventricular Fibrillation
112. Rhythm #8
Rate?
Regularity?
P waves?
PR interval?
QRS duration?
160 bpm
regular
none
none
wide (> 0.12 sec)
Interpretation? Ventricular Tachycardia
113. Ventricular Tachycardia
• Deviation from NSR– Impulse is originating in the ventricles (no P
waves, wide QRS).
114. Rhythm #9
Rate?
Regularity?
P waves?
PR interval?
QRS duration?
none
irregularly irreg.
none
none
wide, if recognizable
Interpretation? Ventricular Fibrillation
115. Ventricular Fibrillation
• Deviation from NSR– Completely abnormal.
116. Arrhythmia Formation
Arrhythmias can arise from problems in the:• Sinus node
• Atrial cells
• AV junction
• Ventricular cells
117. SA Node Problems
The SA Node can:• fire too slow
• fire too fast
Sinus Bradycardia
Sinus Tachycardia
Sinus Tachycardia may be an appropriate
response to stress.
118. Atrial Cell Problems
Atrial cells can:• fire occasionally
from a focus
• fire continuously
due to a looping reentrant circuit
Premature Atrial Contractions
(PACs)
Atrial Flutter
119. AV Junctional Problems
The AV junction can:• fire continuously due
to a looping reentrant circuit
• block impulses
coming from the SA
Node
Paroxysmal
Supraventricular
Tachycardia
AV Junctional Blocks
120. Rhythm #1
Rate?
Regularity?
P waves?
PR interval?
QRS duration?
30 bpm
regular
normal
0.12 s
0.10 s
Interpretation? Sinus Bradycardia
121. Rhythm #2
Rate?
Regularity?
P waves?
PR interval?
QRS duration?
130 bpm
regular
normal
0.16 s
0.08 s
Interpretation? Sinus Tachycardia
122. Rhythm #3
Rate?
Regularity?
P waves?
PR interval?
QRS duration?
70 bpm
occasionally irreg.
2/7 different contour
0.14 s (except 2/7)
0.08 s
Interpretation? NSR with Premature Atrial
Contractions
123. Premature Atrial Contractions
• Deviation from NSR– These ectopic beats originate in the atria
(but not in the SA node), therefore the
contour of the P wave, the PR interval,
and the timing are different than a
normally generated pulse from the SA
node.
124. Rhythm #4
Rate?
Regularity?
P waves?
PR interval?
QRS duration?
60 bpm
occasionally irreg.
none for 7th QRS
0.14 s
0.08 s (7th wide)
Interpretation? Sinus Rhythm with 1 PVC
125. Ventricular Conduction
NormalAbnormal
Signal moves rapidly
through the ventricles
Signal moves slowly
through the ventricles
126. AV Nodal Blocks
• 1st Degree AV Block• 2nd Degree AV Block, Type I
• 2nd Degree AV Block, Type II
• 3rd Degree AV Block
127. Rhythm #10
Rate?
Regularity?
P waves?
PR interval?
QRS duration?
60 bpm
regular
normal
0.36 s
0.08 s
Interpretation? 1st Degree AV Block
128. 1st Degree AV Block
• Etiology: Prolonged conduction delay in the AVnode or Bundle of His.
129. Rhythm #11
Rate?
Regularity?
P waves?
PR interval?
QRS duration?
50 bpm
regularly irregular
nl, but 4th no QRS
lengthens
0.08 s
Interpretation? 2nd Degree AV Block, Type I
130. Rhythm #12
Rate?
Regularity?
P waves?
PR interval?
QRS duration?
40 bpm
regular
nl, 2 of 3 no QRS
0.14 s
0.08 s
Interpretation? 2nd Degree AV Block, Type II
131. 2nd Degree AV Block, Type II
• Deviation from NSR– Occasional P waves are completely blocked
(P wave not followed by QRS).
132. Rhythm #13
Rate?
Regularity?
P waves?
PR interval?
QRS duration?
40 bpm
regular
no relation to QRS
none
wide (> 0.12 s)
Interpretation? 3rd Degree AV Block
133. 3rd Degree AV Block
• Deviation from NSR– The P waves are completely blocked in the
AV junction; QRS complexes originate
independently from below the junction.
134. Supraventricular Arrhythmias
• Atrial Fibrillation• Atrial Flutter
• Paroxysmal Supraventricular Tachycardia
135. Rhythm #5
Rate?
Regularity?
P waves?
PR interval?
QRS duration?
100 bpm
irregularly irregular
none
none
0.06 s
Interpretation? Atrial Fibrillation
136. Atrial Fibrillation
• Deviation from NSR– No organized atrial depolarization, so no
normal P waves (impulses are not originating
from the sinus node).
– Atrial activity is chaotic (resulting in an
irregularly irregular rate).
– Common, affects 2-4%, up to 5-10% if > 80
years old
137. Rhythm #6
Rate?
Regularity?
P waves?
PR interval?
QRS duration?
70 bpm
regular
flutter waves
none
0.06 s
Interpretation? Atrial Flutter
138. Rhythm #7
Rate?
Regularity?
P waves?
PR interval?
QRS duration?
74 148 bpm
Regular regular
Normal none
0.16 s none
0.08 s
Interpretation? Paroxysmal Supraventricular
Tachycardia (PSVT)
139. PSVT
• Deviation from NSR– The heart rate suddenly speeds up, often
triggered by a PAC (not seen here) and the P
waves are lost.
140. Ventricular Arrhythmias
• Ventricular Tachycardia• Ventricular Fibrillation
141. Rhythm #8
Rate?
Regularity?
P waves?
PR interval?
QRS duration?
160 bpm
regular
none
none
wide (> 0.12 sec)
Interpretation? Ventricular Tachycardia
142. Ventricular Tachycardia
• Deviation from NSR– Impulse is originating in the ventricles (no P
waves, wide QRS).
143. Rhythm #9
Rate?
Regularity?
P waves?
PR interval?
QRS duration?
none
irregularly irreg.
none
none
wide, if recognizable
Interpretation? Ventricular Fibrillation
144. Ventricular Fibrillation
• Deviation from NSR– Completely abnormal.
145. Diagnosing a MI
To diagnose a myocardial infarction you need togo beyond looking at a rhythm strip and obtain
a 12-Lead ECG.
12-Lead
ECG
Rhythm
Strip
146. Views of the Heart
Some leads get agood view of the:
Anterior portion
of the heart
Inferior portion
of the heart
Lateral portion
of the heart
147. ST Elevation
One way todiagnose an
acute MI is to
look for
elevation of the
ST segment.
148. ST Elevation (cont)
Elevation of the STsegment (greater
than 1 small box) in
2 leads is consistent
with a myocardial
infarction.
149. Anterior View of the Heart
The anterior portion of the heart is best viewedusing leads V1- V4.
150. Anterior Myocardial Infarction
If you see changes in leads V1 - V4 thatare consistent with a myocardial
infarction, you can conclude that it is an
anterior wall myocardial infarction.
151. Putting it all Together
Do you think this person is having amyocardial infarction. If so, where?
152. Interpretation
Yes, this person is having an acute anteriorwall myocardial infarction.
153. Other MI Locations
Now that you know where to look for ananterior wall myocardial infarction let’s look at
how you would determine if the MI involves
the lateral wall or the inferior wall of the
heart.
154. Other MI Locations
First, take a lookagain at this picture
of the heart.
Anterior portion
of the heart
Inferior portion
of the heart
Lateral portion
of the heart
155. Other MI Locations
Second, remember that the 12-leads of the ECG look at differentportions of the heart. The limb and augmented leads “see”
electrical activity moving inferiorly (II, III and aVF), to the left (I,
aVL) and to the right (aVR). Whereas, the precordial leads “see”
electrical activity in the posterior to anterior direction.
Limb Leads
Augmented Leads
Precordial Leads
156. Other MI Locations
Now, using these 3 diagrams let’s figure where tolook for a lateral wall and inferior wall MI.
Limb Leads
Augmented Leads
Precordial Leads
157. Anterior MI
Remember the anterior portion of the heart is bestviewed using leads V1- V4.
Limb Leads
Augmented Leads
Precordial Leads
158. Lateral MI
So what leads do you thinkthe lateral portion of the
heart is best viewed?
Limb Leads
Leads I, aVL, and V5- V6
Augmented Leads
Precordial Leads
159. Inferior MI
Now how about theinferior portion of the
heart?
Limb Leads
Leads II, III and aVF
Augmented Leads
Precordial Leads
160. Putting it all Together
Now, where do you think this person ishaving a myocardial infarction?
161. Inferior Wall MI
This is an inferior MI. Note the ST elevationin leads II, III and aVF.
162. Putting it all Together
How about now?163. Anterolateral MI
This person’s MI involves both the anterior wall(V2-V4) and the lateral wall (V5-V6, I, and aVL)!
164. RIGHT ATRIAL ENLARGEMENT
165.
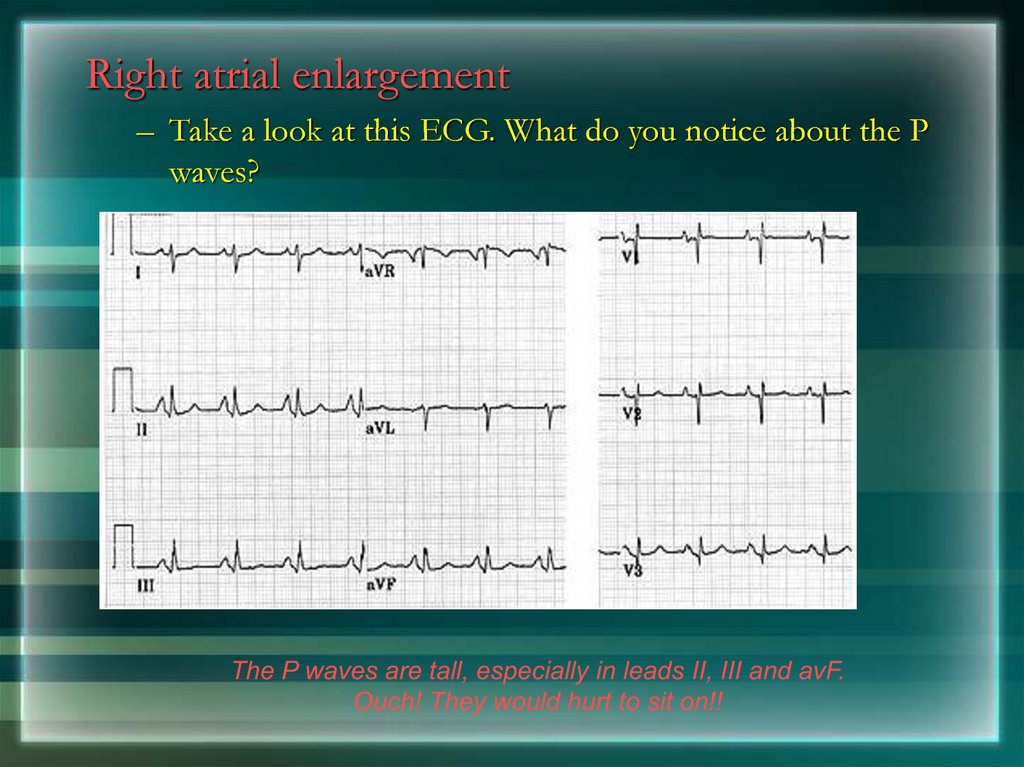
Right atrial enlargement– Take a look at this ECG. What do you notice about the P
waves?
The P waves are tall, especially in leads II, III and avF.
Ouch! They would hurt to sit on!!
166.
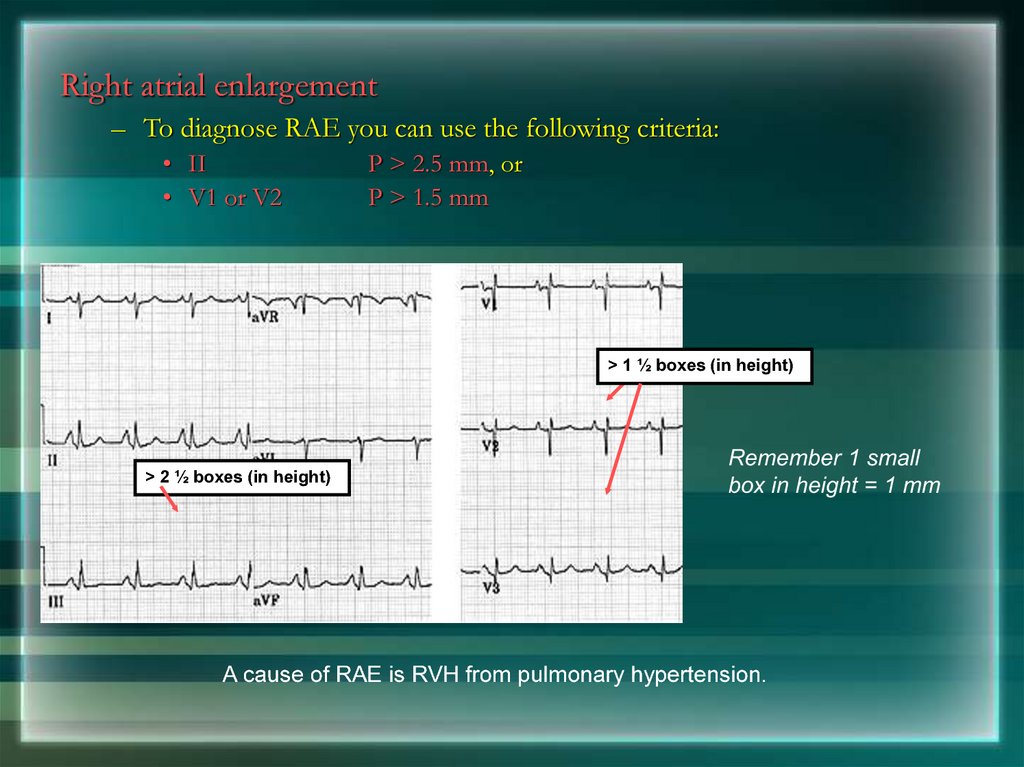
Right atrial enlargement– To diagnose RAE you can use the following criteria:
• II
• V1 or V2
P > 2.5 mm, or
P > 1.5 mm
> 1 ½ boxes (in height)
> 2 ½ boxes (in height)
Remember 1 small
box in height = 1 mm
A cause of RAE is RVH from pulmonary hypertension.
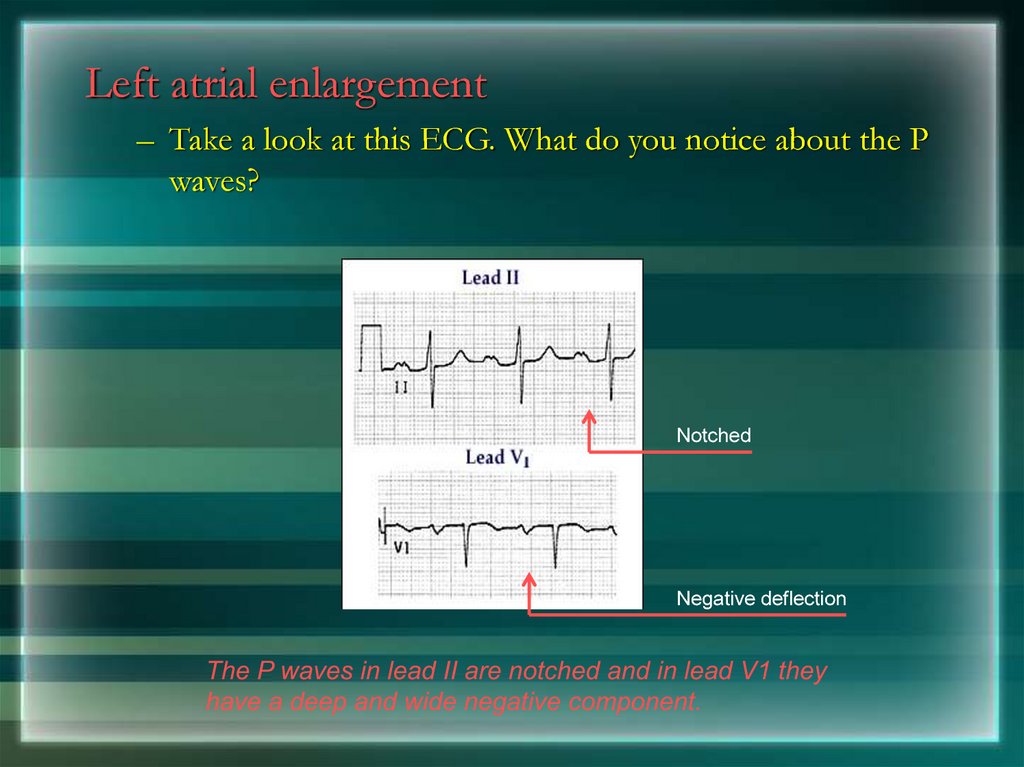
167.
Left atrial enlargement– Take a look at this ECG. What do you notice about the P
waves?
Notched
Negative deflection
The P waves in lead II are notched and in lead V1 they
have a deep and wide negative component.
168.
Left atrial enlargement– To diagnose LAE you can use the following criteria:
• II
• V1
> 0.04 s (1 box) between notched peaks, or
Neg. deflection > 1 box wide x 1 box deep
Normal
LAE
A common cause of LAE is LVH from hypertension.
169. Left Ventricular Hypertrophy
170. Left Ventricular Hypertrophy
Compare these two 12-lead ECGs. What stands outas different with the second one?
Normal
Left Ventricular Hypertrophy
Answer: The QRS complexes are very tall
(increased voltage)
171. Left Ventricular Hypertrophy
• Criteria exists to diagnose LVH using a 12-lead ECG.– For example:
• The R wave in V5 or V6 plus the S wave in V1 or V2 exceeds
35 mm.
• However, for now, all
you need to know is
that the QRS voltage
increases with LVH.
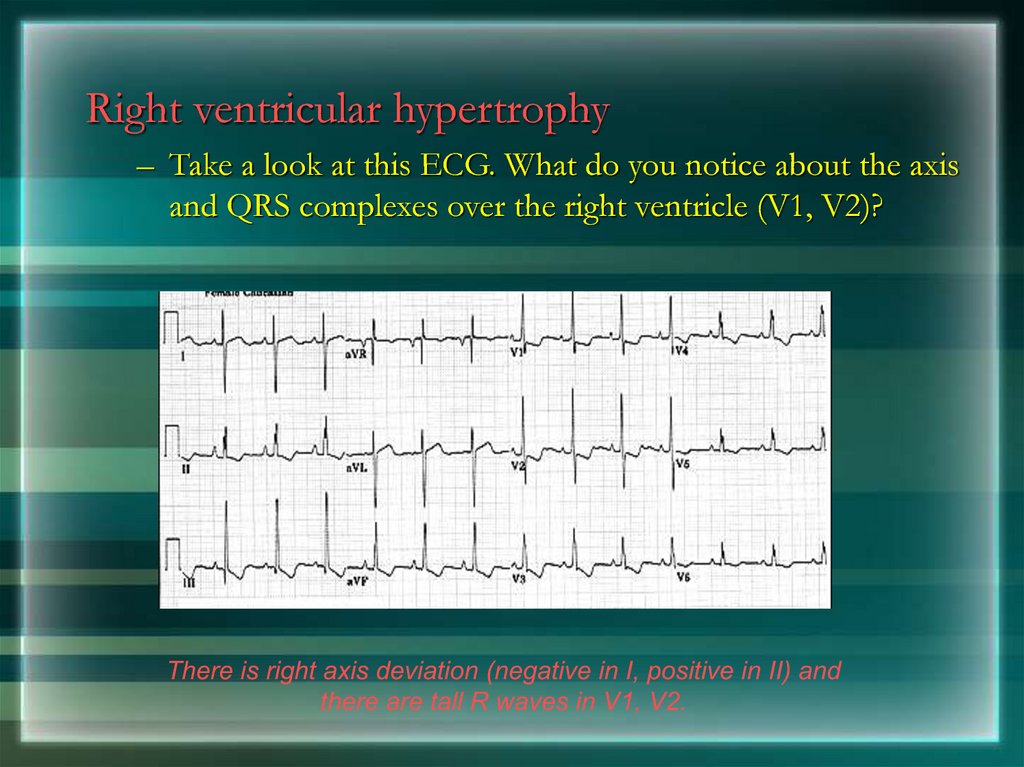
172.
Right ventricular hypertrophy– Take a look at this ECG. What do you notice about the axis
and QRS complexes over the right ventricle (V1, V2)?
There is right axis deviation (negative in I, positive in II) and
there are tall R waves in V1, V2.
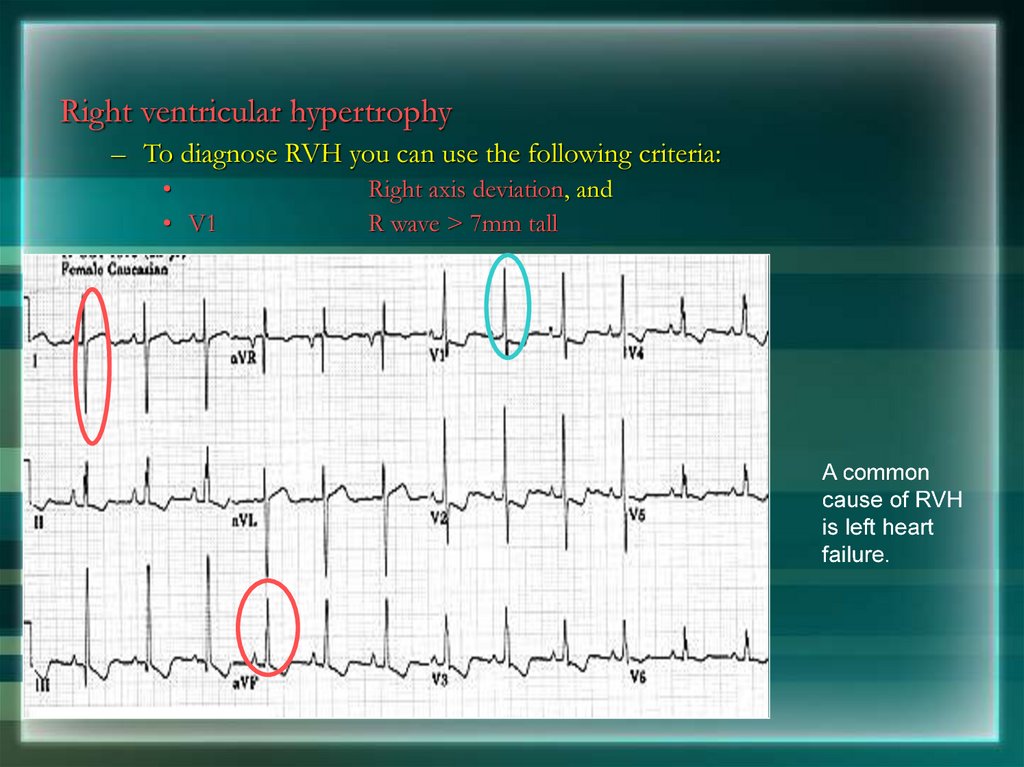
173.
Right ventricular hypertrophy– To diagnose RVH you can use the following criteria:
• V1
Right axis deviation, and
R wave > 7mm tall
A common
cause of RVH
is left heart
failure.
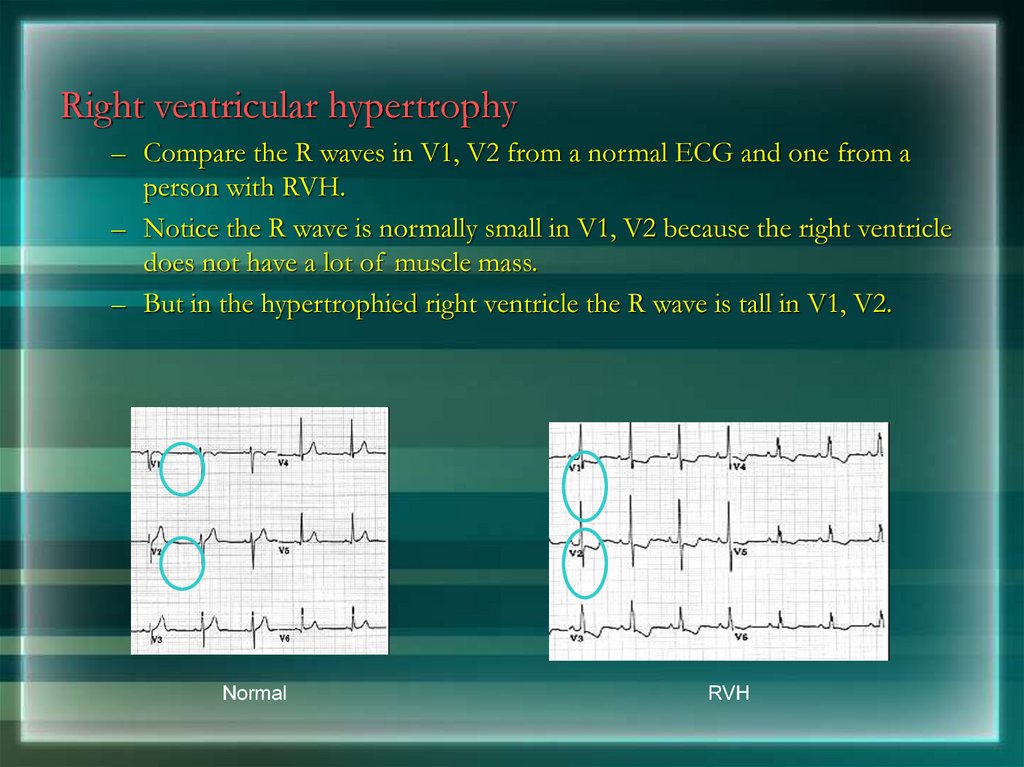
174.
Right ventricular hypertrophy– Compare the R waves in V1, V2 from a normal ECG and one from a
person with RVH.
– Notice the R wave is normally small in V1, V2 because the right ventricle
does not have a lot of muscle mass.
– But in the hypertrophied right ventricle the R wave is tall in V1, V2.
Normal
RVH
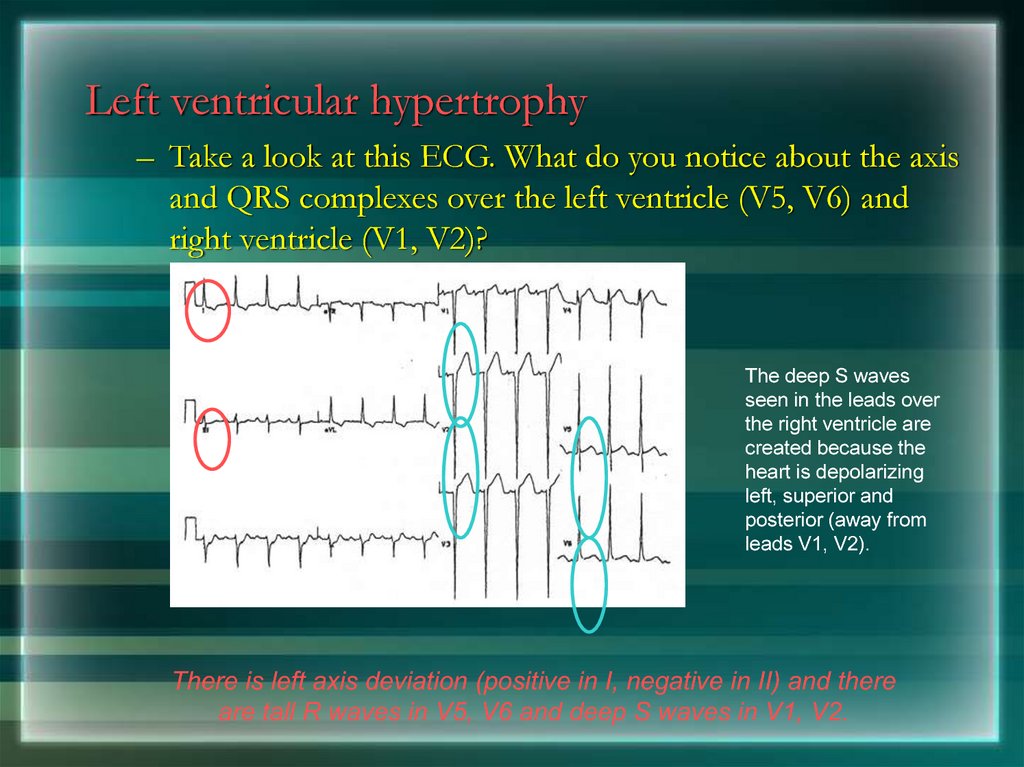
175.
Left ventricular hypertrophy– Take a look at this ECG. What do you notice about the axis
and QRS complexes over the left ventricle (V5, V6) and
right ventricle (V1, V2)?
The deep S waves
seen in the leads over
the right ventricle are
created because the
heart is depolarizing
left, superior and
posterior (away from
leads V1, V2).
There is left axis deviation (positive in I, negative in II) and there
are tall R waves in V5, V6 and deep S waves in V1, V2.
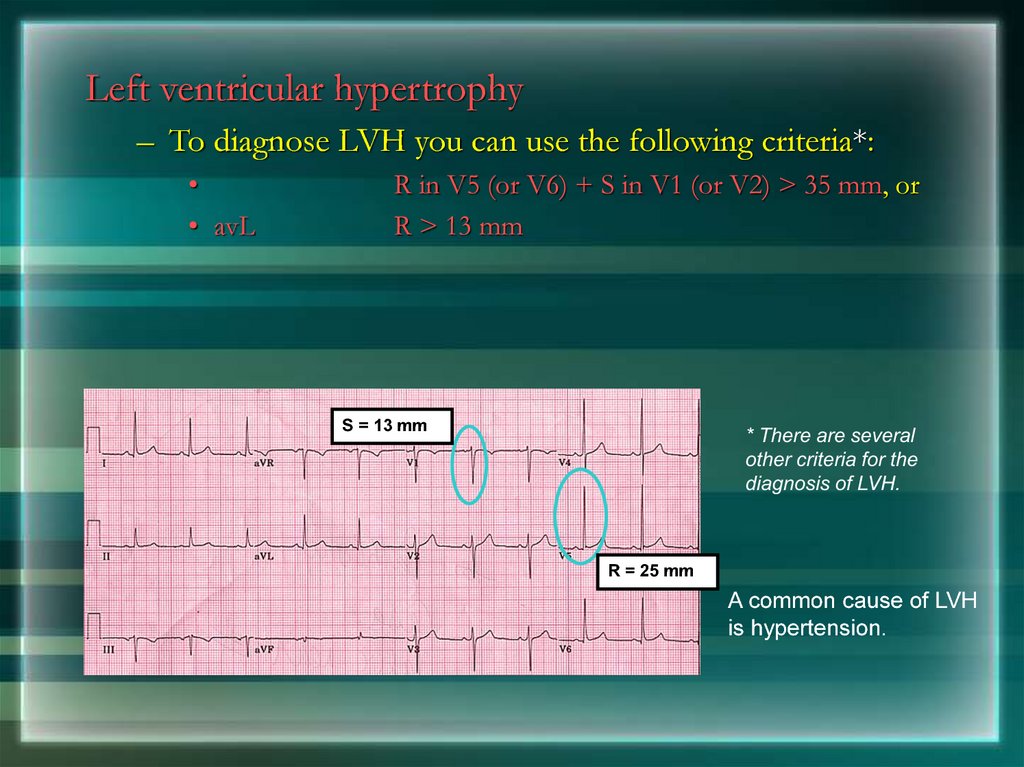
176.
Left ventricular hypertrophy– To diagnose LVH you can use the following criteria*:
• avL
R in V5 (or V6) + S in V1 (or V2) > 35 mm, or
R > 13 mm
S = 13 mm
* There are several
other criteria for the
diagnosis of LVH.
R = 25 mm
A common cause of LVH
is hypertension.
177. Bundle Branch Blocks
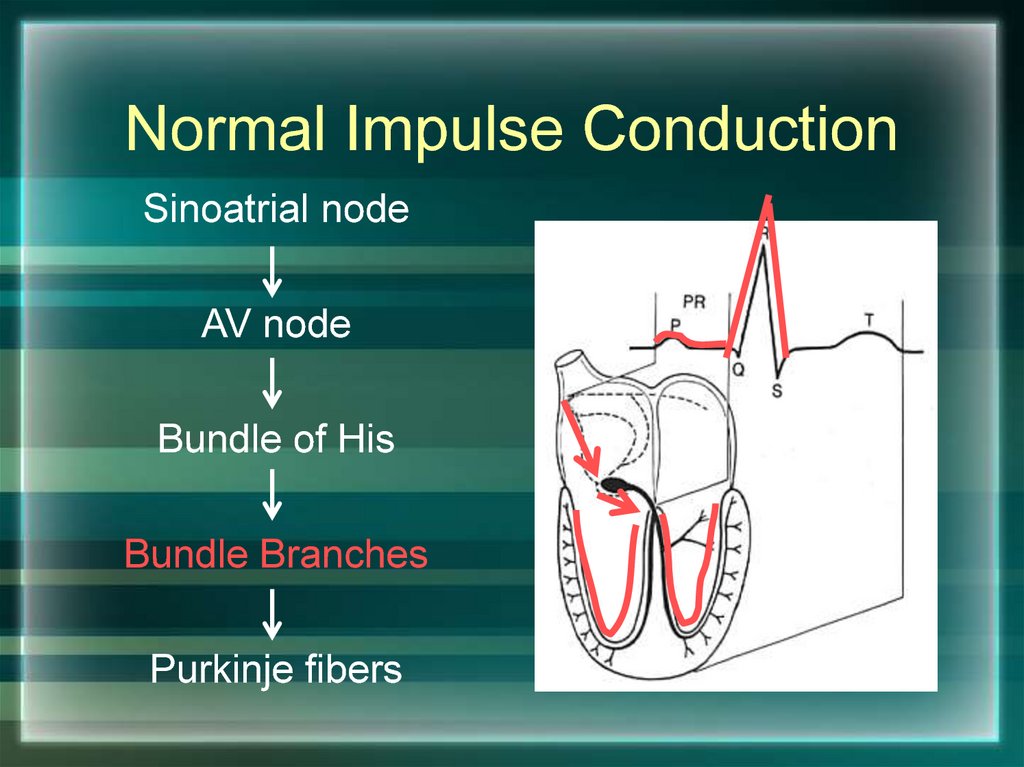
178.
Normal Impulse ConductionSinoatrial node
AV node
Bundle of His
Bundle Branches
Purkinje fibers
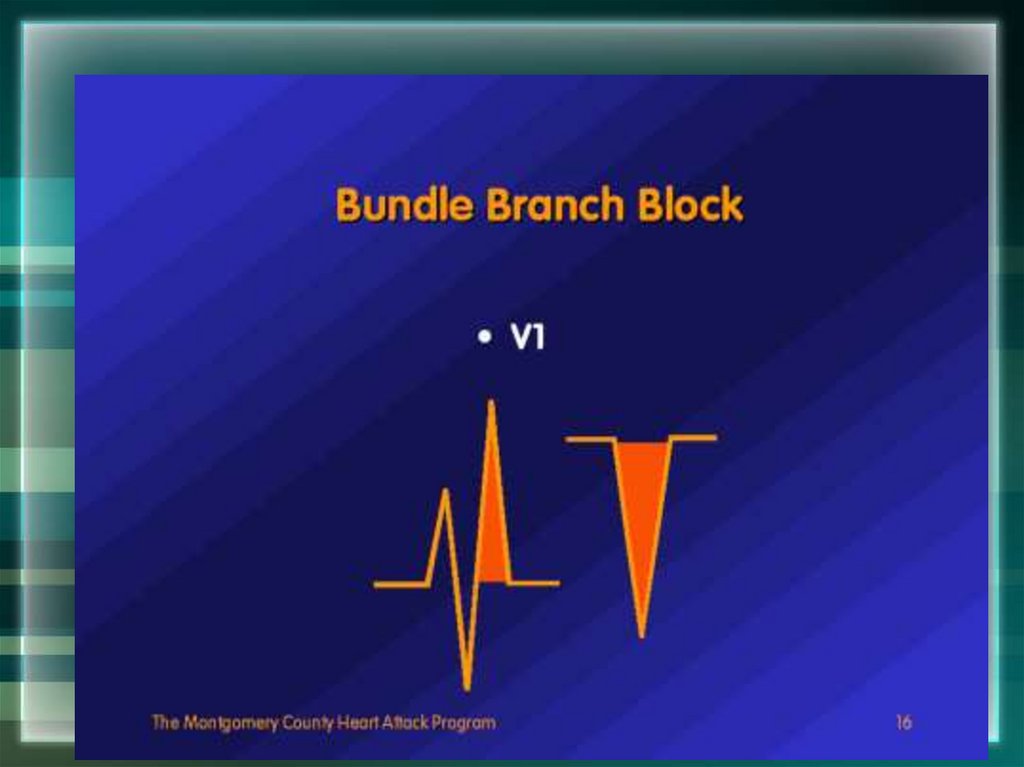
179. Bundle Branch Blocks
So, conduction in theBundle Branches and
Purkinje fibers are seen
as the QRS complex on
the ECG.
Therefore, a conduction
block of the Bundle
Branches would be
reflected as a change in
the QRS complex.
Right
BBB
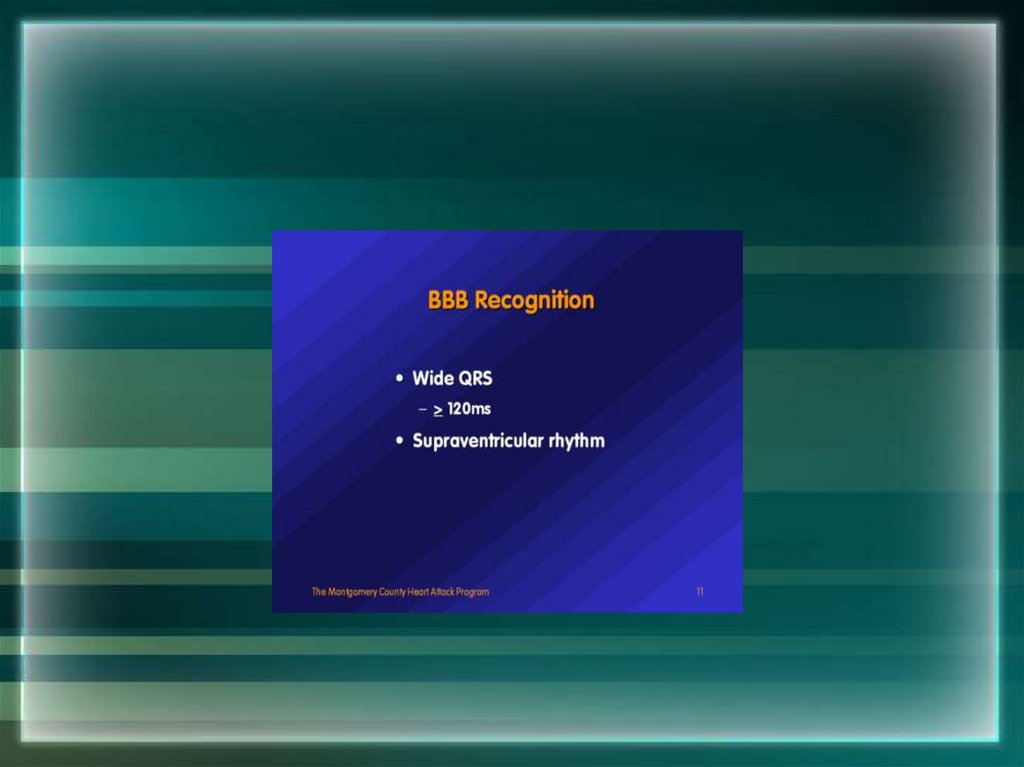
180. Bundle Branch Blocks
With Bundle Branch Blocks you will see two changeson the ECG.
1. QRS complex widens (> 0.12 sec).
2. QRS morphology changes (varies depending on ECG lead,
and if it is a right vs. left bundle branch block).
181.
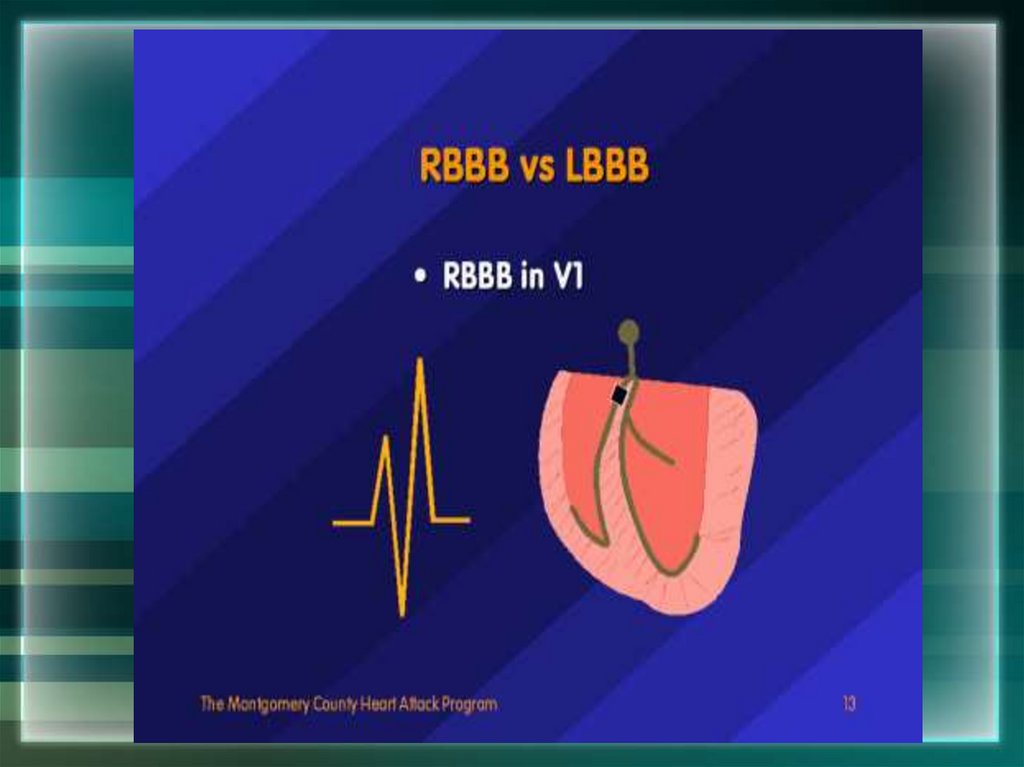
182. Right Bundle Branch Blocks
What QRS morphology is characteristic?For RBBB the wide QRS complex assumes a
unique, virtually diagnostic shape in those
leads overlying the right ventricle (V1 and V2).
V1
“Rabbit Ears”
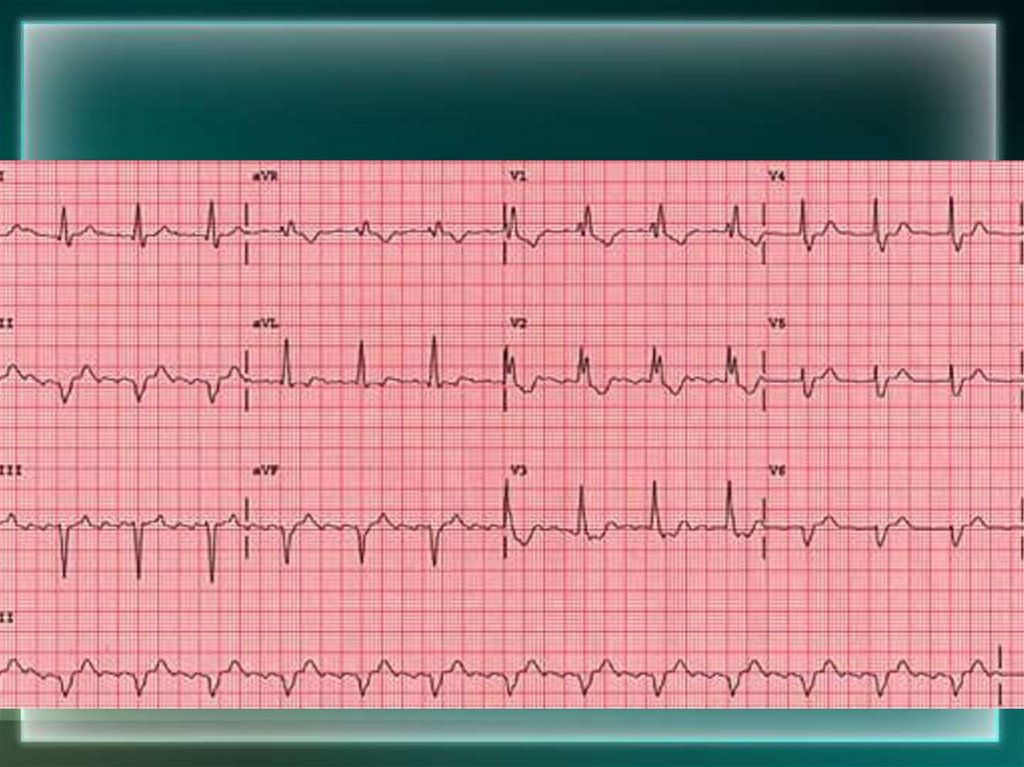
183. RBBB
184.
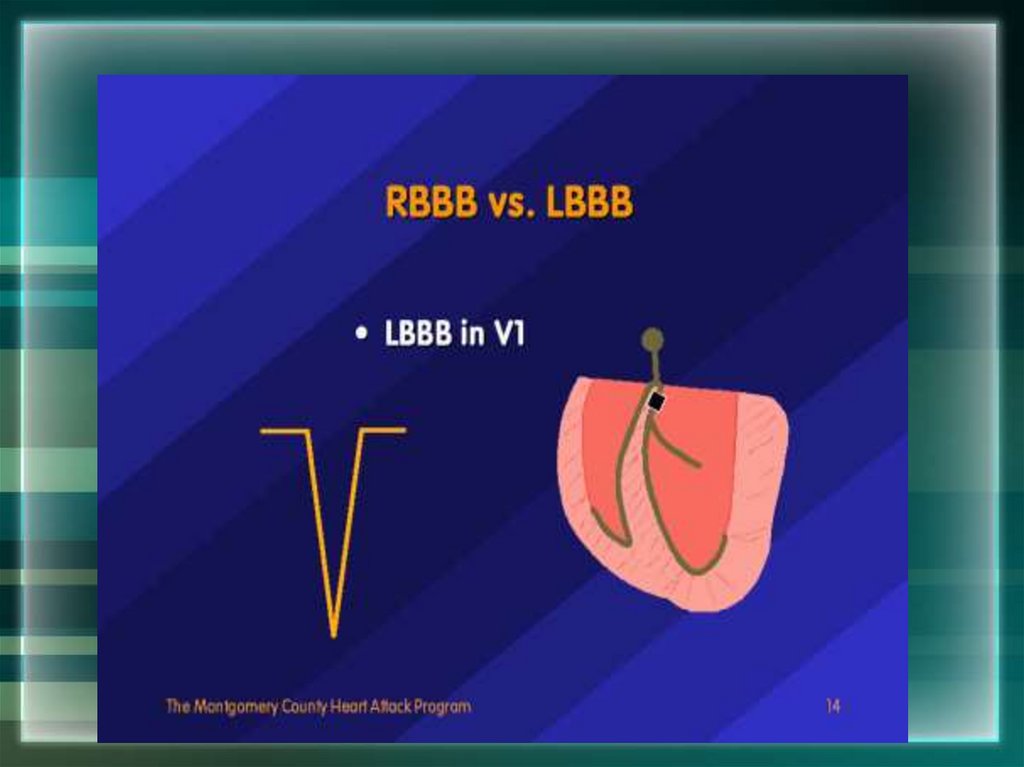
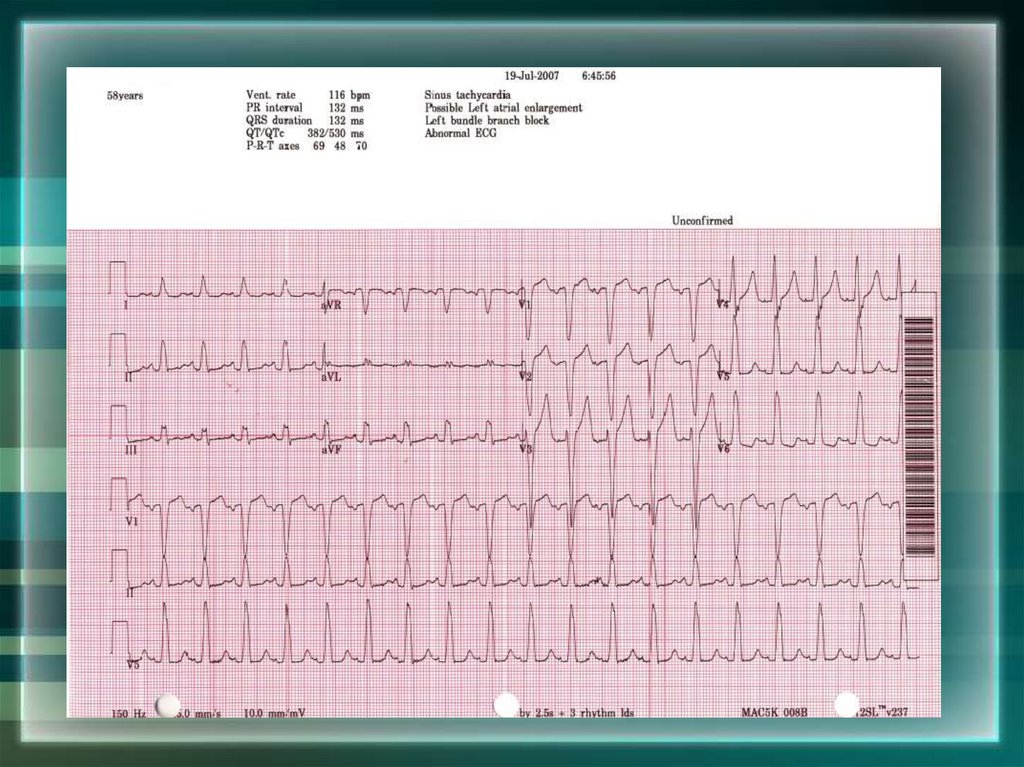
185. Left Bundle Branch Blocks
What QRS morphology is characteristic?For LBBB the wide QRS complex assumes a
characteristic change in shape in those leads
opposite the left ventricle (right ventricular
leads - V1 and V2).
Normal
Broad,
deep S
waves