


 chemistry
Similar presentations:


")


Crystal defects
1. Crystal defects
2. Perfect Crystals
All atoms are at rest on their correct lattice position.Hypothetically, only at zero Kelvin.
S=0
S k ln W
W=1, only one possible arrangement to have all N
atoms exactly on their lattice points.
Vibration of atoms can be regarded as a form of
defects.
3. Classification of defects in solids
• Zero-dimensional (point) defectsVacancies, Interstitial atoms (ions), Foreign atoms (ions)
• One-dimensional (linear) defects
Edge dislocation, screw dislocation
• Two-dimensional (flat) defects
Antiphase boundary, shear plane, low angle twist
boundary, low angle tilt boundary, grain boundary, surface
• Three-dimensional (spatial) defects
Pores, foreign inclusions
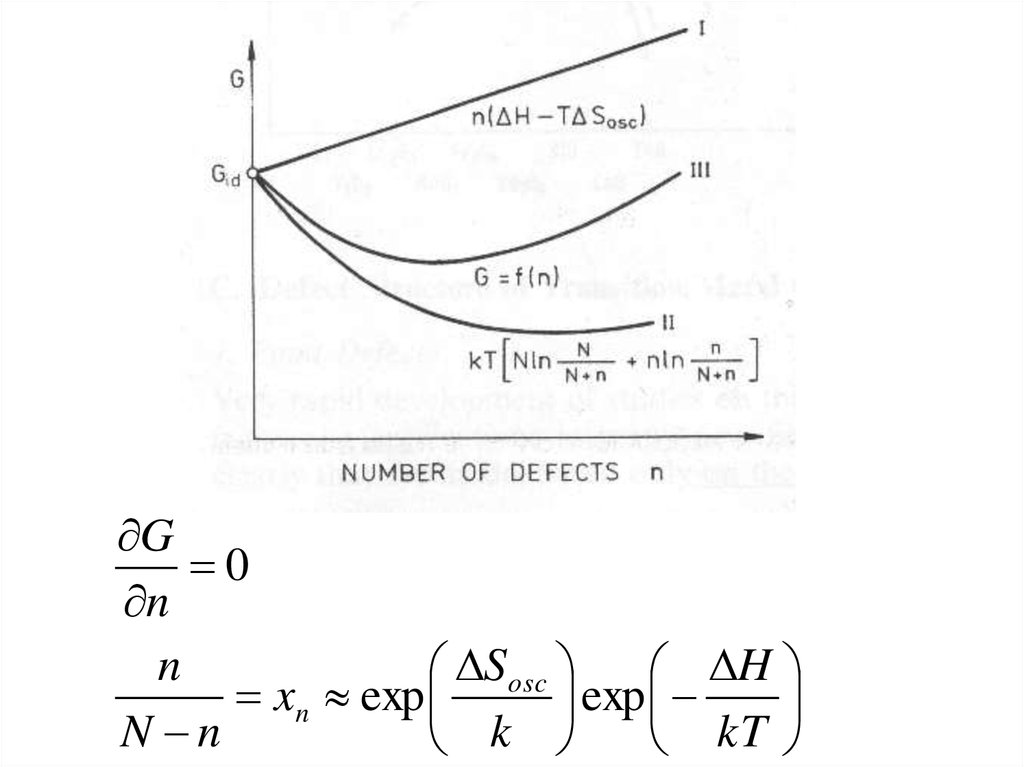
4. Thermodynamics of defect formation
Perfect → imperfectn vacancies created
DG=Gdef-Gper=DH-TDS
DH=n DHi
DHi: enthalpy of formation of one vacant site
DS=DSosc+DSc
DSosc: change of oscillation entropy of atoms surrounding
the vacancy
DSc: change in cofigurational entropy of system on
vacancies formation
5.
DS c S c ( def ) S c (id )DS c k ln Wdef k ln Wid k ln
Wdef
Wid
DS c k ln Wdef
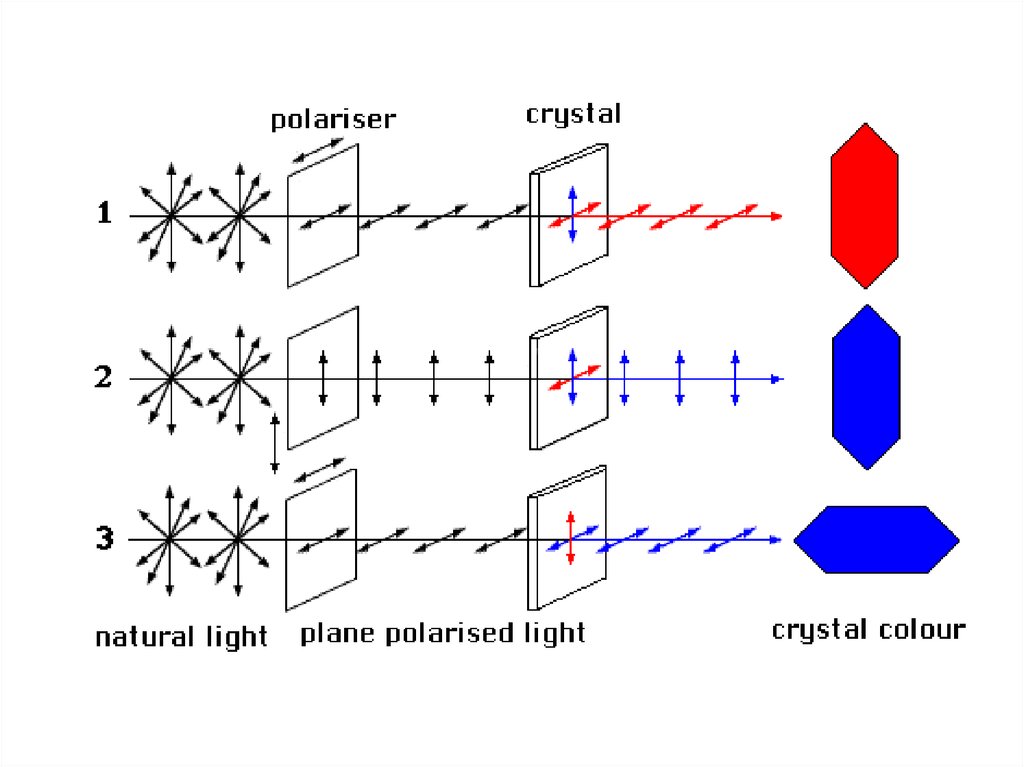
Now, N atoms distributed over N+n sites
And n vacancies distributed over N+n sites
N
n
DS c k N ln
n ln
N n
N n
6.
Nn
DG nDH nTDS osc kT N ln
n ln
N n
N n
DH always positive
DSosc always negative
n/(N+n) < 1, ln < 0
7.
G0
n
n
DSosc
DH
xn exp
exp
N n
kT
k
8.
• Defect formation possible only due toincreased configurational entropy in that
process.
• After n exceeds a certain limit, no significant
increase in Sc is produced
9. Crystal Defects
Defects can affectStrength
Conductivity
Deformation style
Color
10.
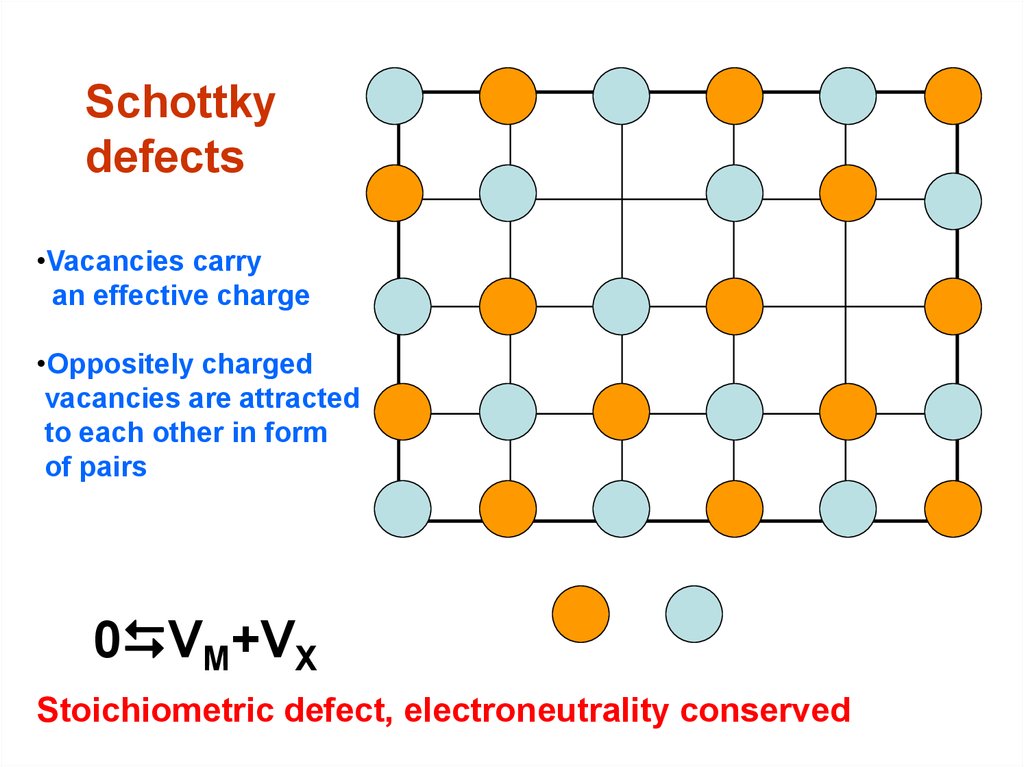
Schottkydefects
•Vacancies carry
an effective charge
•Oppositely charged
vacancies are attracted
to each other in form
of pairs
0 VM+VX
Stoichiometric defect, electroneutrality conserved
11. NaCl
• Dissociation enthalpy for vacancies pairs ≈ 120 kJ/mol.• At room temperature, 1 of 1015 crystal positions are
vacant.
• Corresponds to 10000 Schottky defect in 1 mg.
• These are responsible for electrical and optical
properties of NaCl.
12.
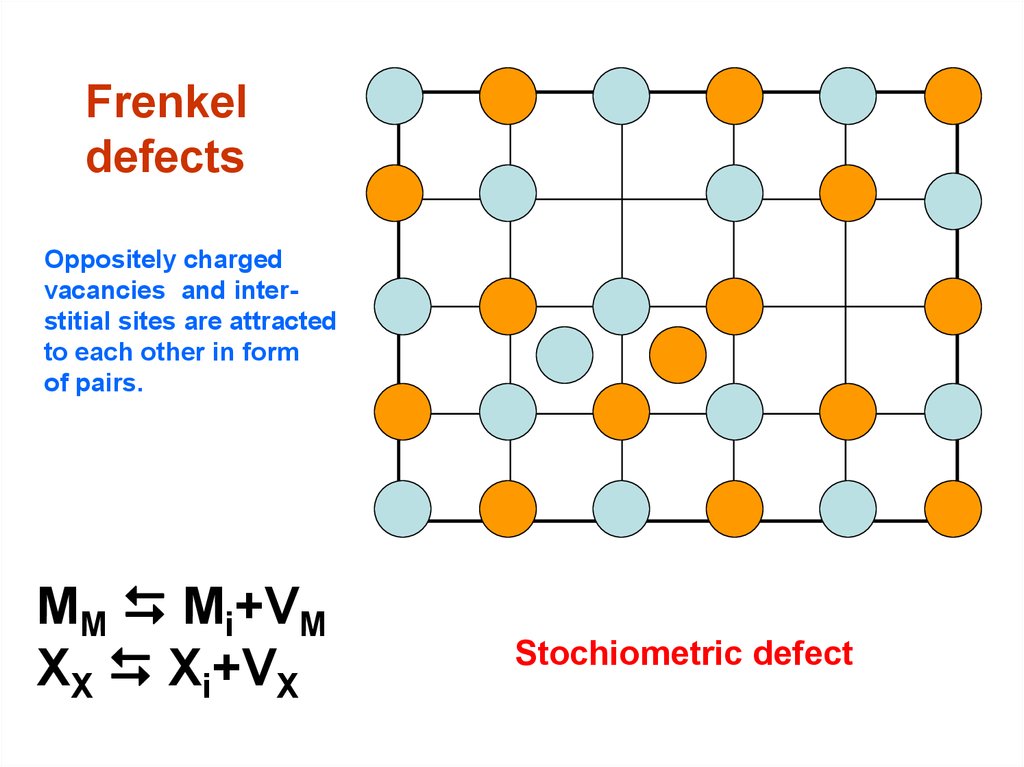
Frenkeldefects
Oppositely charged
vacancies and interstitial sites are attracted
to each other in form
of pairs.
MM Mi+VM
XX Xi+VX
Stochiometric defect
13. AgCl
• Ag+ in interstitial sites.• (Ag+)i tetrahedrally surrounded by 4 Cl- and 4 Ag+.
• Some covalent interaction between (Ag+)i and Cl- (further
stabilization of Frenkel defects).
• Na+ harder, no covalent interaction with Cl-. Frenkel
defects don’t occur in NaCl.
• CaF2, ZrO2 (Fluorite structure): anion in interstitial sites.
• Na2O (anti fluorite): cation in interstitial sites.
14. Crystal Defects
2. Line Defectsd) Edge dislocation
Migration aids ductile
deformation
Fig 10-4 of
Bloss,
Crystallography
and Crystal
Chemistry.©
MSA
15. Crystal Defects
2. Line Defectse) Screw dislocation
(aids mineral growth)
Fig 10-5 of
Bloss,
Crystallography
and Crystal
Chemistry. ©
MSA
16. Crystal Defects
3. Plane Defectsf) Lineage structure or mosaic crystal
Boundary of slightly mis-oriented volumes within a single
crystal
Lattices are close enough to provide continuity (so not
separate crystals)
Has short-range order, but not long-range (V4)
Fig 10-1 of Bloss, Crystallography and Crystal Chemistry. © MSA
17. Crystal Defects
3. Plane Defectsg) Domain structure (antiphase domains)
Also has short-range but not long-range order
Fig 10-2 of Bloss, Crystallography and Crystal Chemistry. © MSA
18. Crystal Defects
3. Plane Defectsh) Stacking faults
Common in clays and low-T disequilibrium
A - B - C layers may be various clay types (illite, smectite,
etc.)
ABCABCABCABABCABC
AAAAAABAAAAAAA
ABABABABABCABABAB
19.
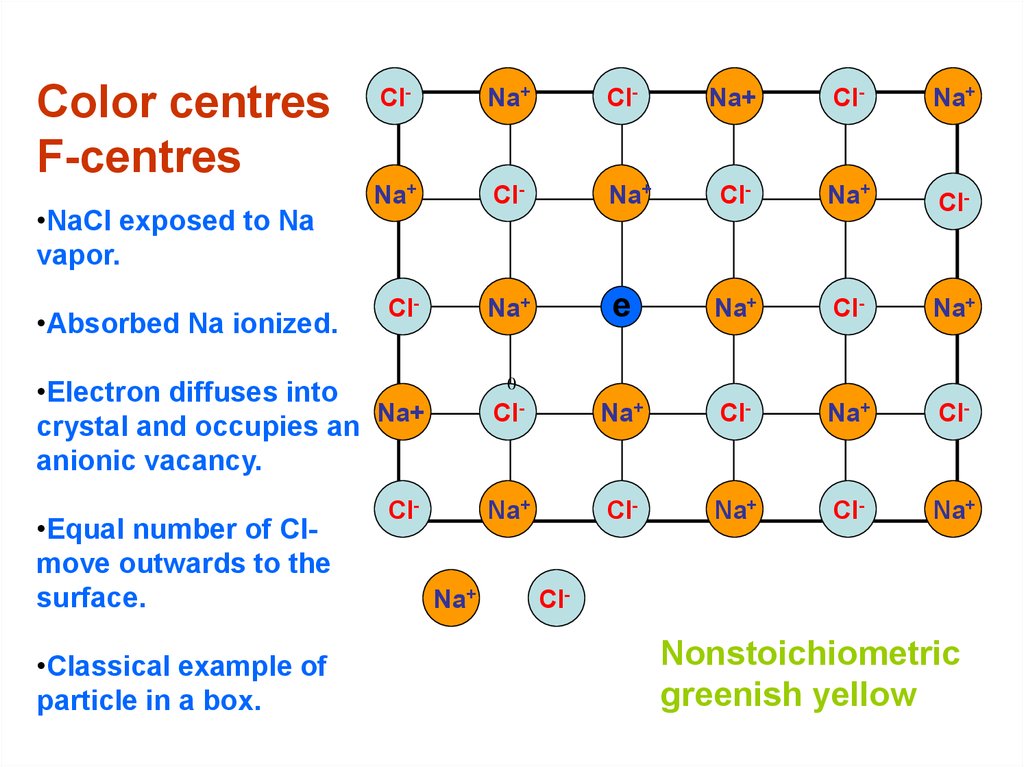
Color centresF-centres
•NaCl exposed to Na
vapor.
•Absorbed Na ionized.
Cl-
Na+
Cl-
Na+
Cl-
Na+
Na+
Cl-
Na+
Cl-
Na+
Cl-
Cl-
Na+
e
Na+
Cl-
Na+
•Electron diffuses into
crystal and occupies an Na+
anionic vacancy.
Cl-
Na+
Cl-
Na+
Cl-
Cl-
Na+
Cl-
Na+
Cl-
Na+
•Equal number of Clmove outwards to the
surface.
•Classical example of
particle in a box.
0
Na+
Cl-
Nonstoichiometric
greenish yellow
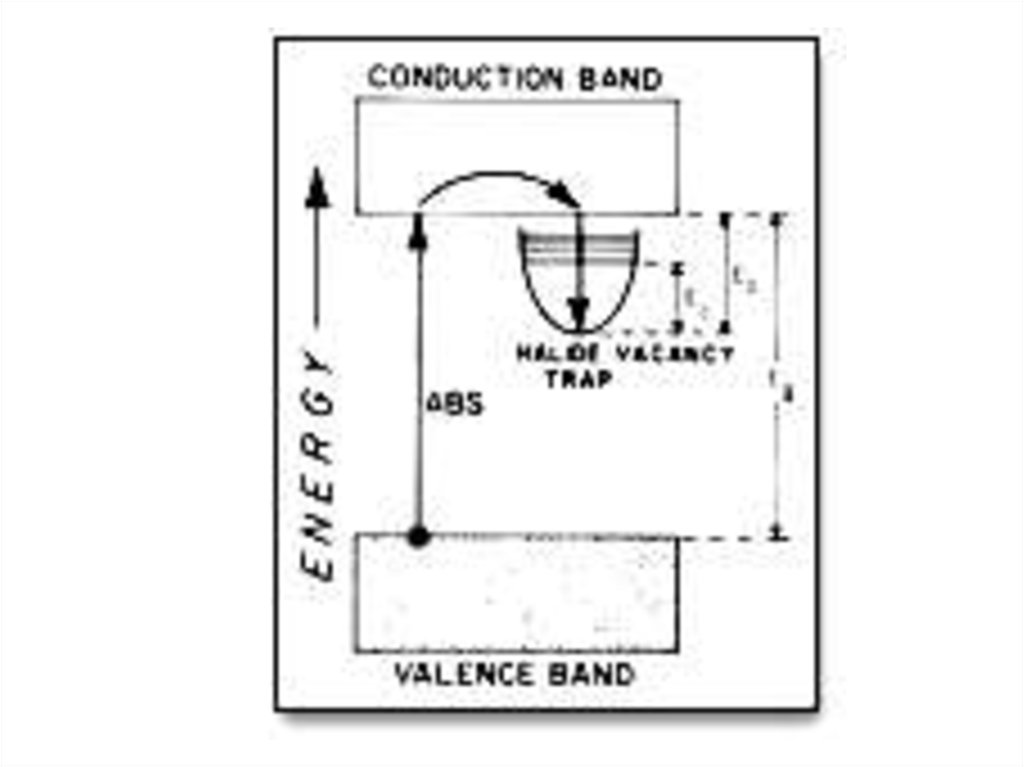
20.
• Color depends on host crystal not on nature ofvapor.
K vapors would produce the same color.
• Color centres can be investigated by ESR.
• Radiation with X-rays produce also color
centres.
Due to ionization of Cl-.
21.
22.
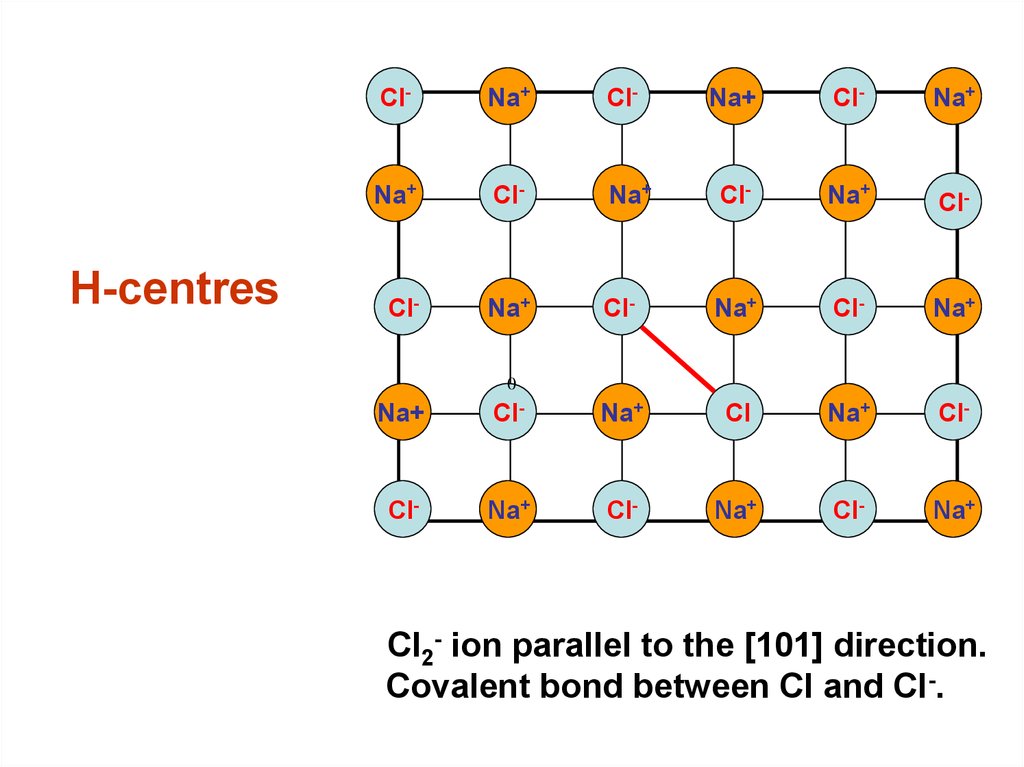
H-centresCl-
Na+
Cl-
Na+
Cl-
Na+
Na+
Cl-
Na+
Cl-
Na+
Cl-
Cl-
Na+
Cl-
Na+
Cl-
Na+
0
Na+
Cl-
Na+
Cl
Na+
Cl-
Cl-
Na+
Cl-
Na+
Cl-
Na+
Cl2- ion parallel to the [101] direction.
Covalent bond between Cl and Cl-.
23.
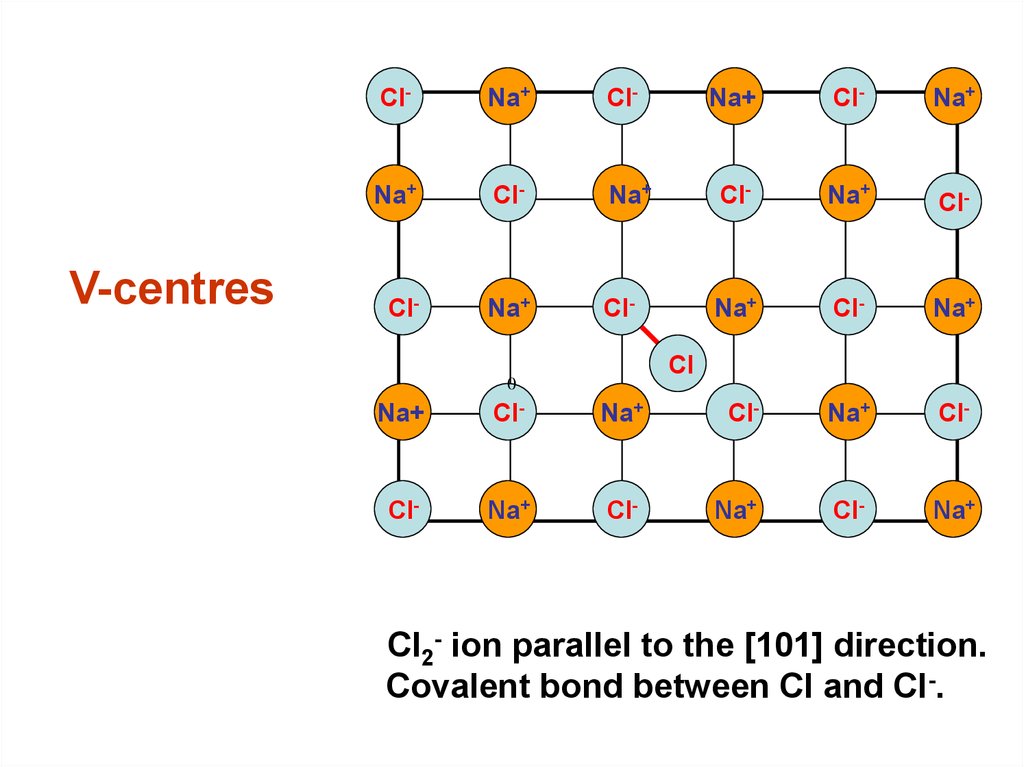
V-centresCl-
Na+
Cl-
Na+
Cl-
Na+
Na+
Cl-
Na+
Cl-
Na+
Cl-
Cl-
Na+
Cl-
Na+
Cl-
Na+
Cl
Cl
0
Na+
Cl-
Na+
Cl-
Na+
Cl-
Cl-
Na+
Cl-
Na+
Cl-
Na+
Cl2- ion parallel to the [101] direction.
Covalent bond between Cl and Cl-.
24. Different types of color centres
25. Colors in the solid state
26. Electromagnetic Radiation and the Visible Spectrum
12.4 - 3.10 eV3.10 - 2.92 eV
2.92 - 2.52 eV
2.52 - 2.15 eV
2.15 - 2.12 eV
2.12 - 1.92 eV
1.92 - 1.77 eV
1.77 - 0.12 eV
100-400 nm
UV
Rednm Violet
400-425
Violet
425-492 nm
Blue
492-575
Orange nm Green
Blue
575-585 nm Yellow
585-647 nm Orange
647-700 nm
Red
Yellow Green
10,000-700 nm Near IR
If absorbance occurs in one region of the color wheel
the material appears with the opposite (complimentary
color). For example:
a material absorbs violet light Color = Yellow –
a material absorbs green light Color = Red –
a material absorbs violet, blue & green Color = Orange- –
Red
a material absorbs red, orange & yellow Color = Blue –
E = hc/l = {(4.1357 x 10⁻¹⁵ eV-s)(2.998 x 10⁸ m/s)}/l
E (eV) = 1240/l(nm)
27. Color in Extended Inorganic Solids: absorption
Intra-tomic (Localized) excitationsCr3+ Gemstones (i.e. Cr3+ in Ruby and Emerald) –
Blue and Green Cu2+ compounds (i.e. malachite, turquoise) –
Blue Co2+ compounds (i.e. Al2CoO4, azurite) –
Charge-transfer excitations (metal-metal, anion-metal)
Fe2+ Ti4+ in sapphire –
Fe2+ Fe3+ in Prussian Blue –
O2- Cr6+ in BaCrO4 –
Valence to Conduction Band Transitions in Semiconductors
WO3 (Yellow) –
CdS (Yellow) & CdSe –
HgS (Cinnabar - Red)/ HgS (metacinnabar - Black) –
Intraband excitations in Metals
Strong absorption within a partially filled band leads to metallic –
lustre or black coloration
Most of the absorbed radiation is re-emitted from surface in the –
form of
visible light high reflectivity (0.90-0.95)
28. Gemstones
GemColorstone
Host crystal
Impurity
Ruby
Red
Aluminum oxide (Corundum)
Chromium
Emerald
Green
Beryllium aluminosilicate (Beryl)
Chromium
Garnet
Red
Calcium aluminosilicate
Iron
Topaz
Yellow
Aluminum fluorosilicate
Iron
Tourmaline
Pink-red
Calcium lithium boroaluminosilicate
Manganese
Turquoise
Blue-green
Copper phosphoaluminate
Copper
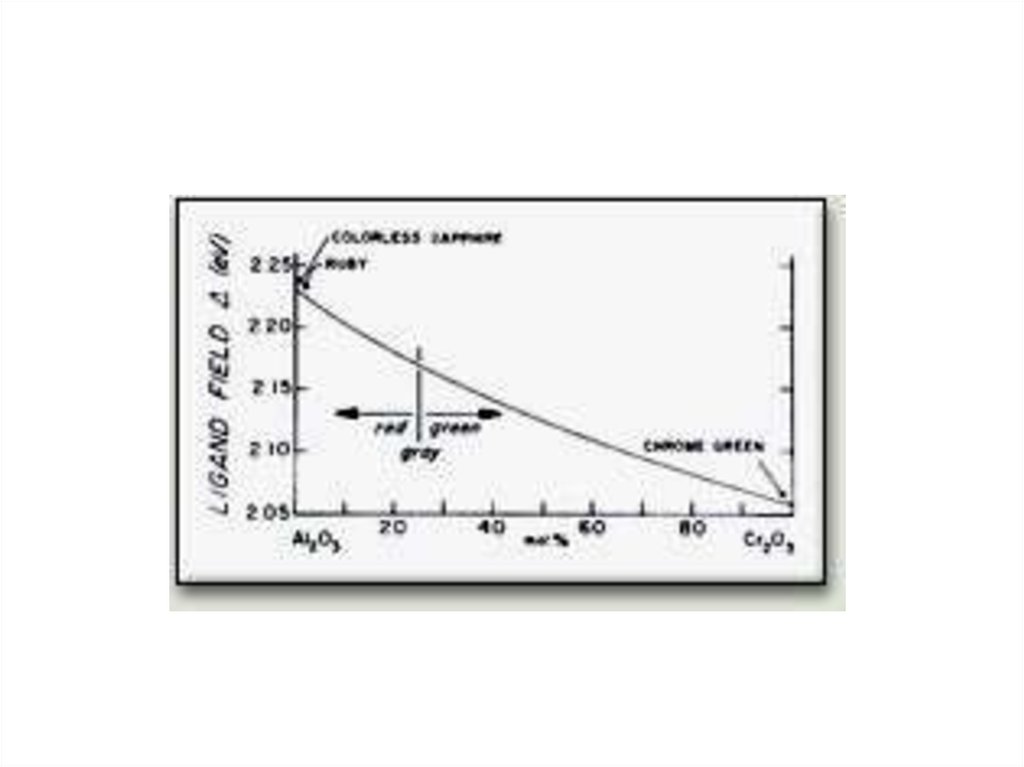
29. Cr3+ Gemstones
Excitation of an electron from one d-orbital to another d-orbital onthe same atom often gives rise to absorption in the visible region of
the spectrum. The Cr3+ ion in octahedral coordination is a very
interesting example of this. Slight changes in it’s environment lead
to changes in the splitting of the t2g and eg orbitals, which changes
the color the material. Hence, Cr3+ impurities are important in a
number of gemstones.
Ruby
Alexandrite
Emerald
Host
t2g–eg Splitting
Color
Corundum
Al2O3
Chrysoberyl
BeAl2O4
Beryl
Be3Al2Si6O18
2.23 eV
2.17 eV
2.05 eV
Red
Blue-Green
Green
30.
Red ruby. The name ruby comes from the Latin "Rubrum"meaning red. The ruby is in the Corundum group, along with the
sapphire. The brightest red and thus most valuable rubies are
usually from Burma. Violet
31.
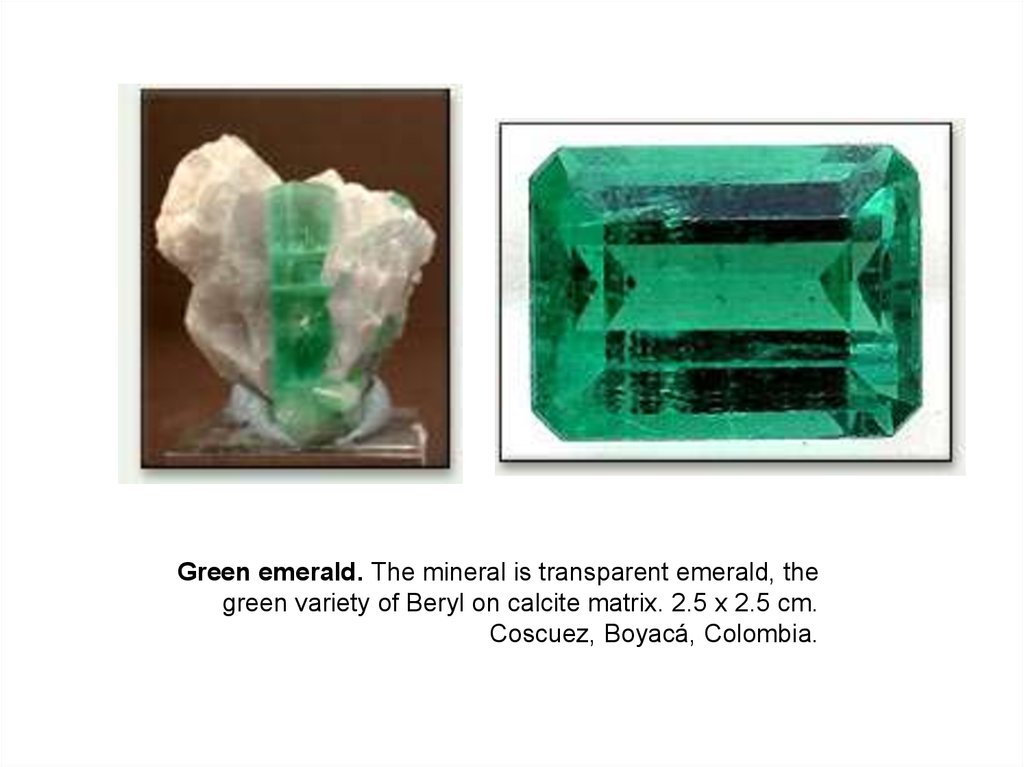
Green emerald. The mineral is transparent emerald, thegreen variety of Beryl on calcite matrix. 2.5 x 2.5 cm.
Coscuez, Boyacá, Colombia.
32. Tunabe-Sugano Diagram Cr3+
The Tunabe-Sugano diagram below shows the allowed electronicexcitations for Cr3+ in an octahedral crystal field (4A2 4T1 & 4A2 4T2).
The dotted vertical line shows the strength of the crystal field splitting for
Cr3+ in Al2O3. The 4A2 4T1 energy difference corresponds to the
splitting between t2g and eg
Spin
Allowed
Transition
eg
t2g
4T
1
eg
& 4T2 States
eg
t2g
4A Ground State
2
t2g
2E
1
State
33. Ruby Red
34. Emerald Green
35.
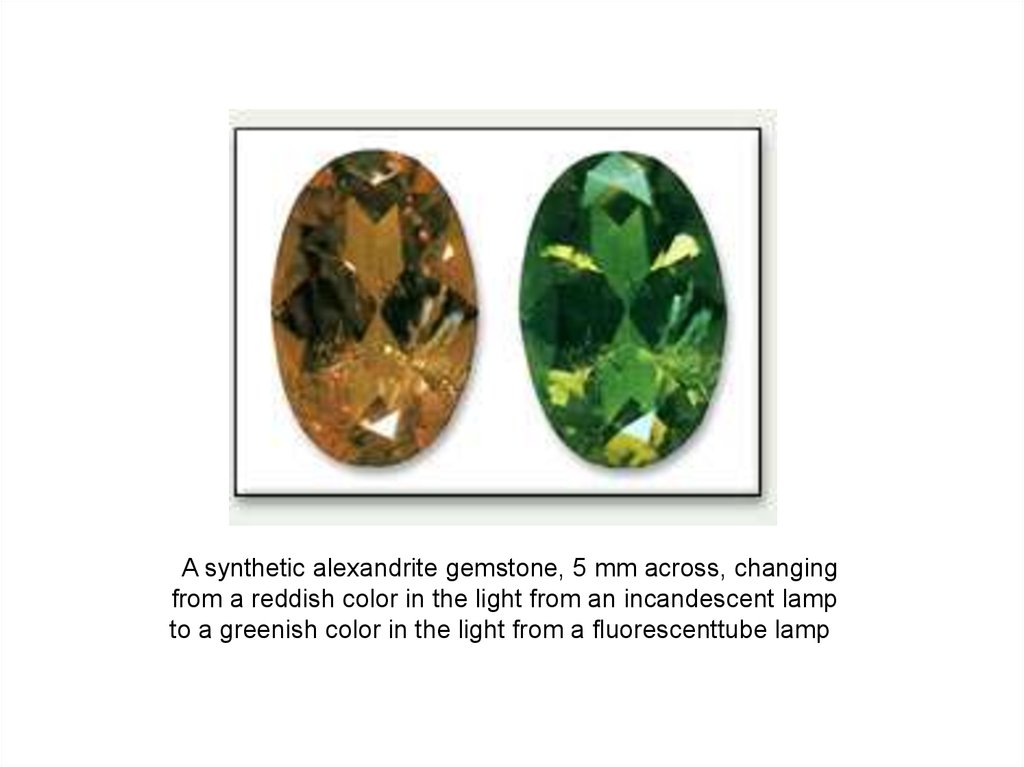
A synthetic alexandrite gemstone, 5 mm across, changingfrom a reddish color in the light from an incandescent lamp
to a greenish color in the light from a fluorescenttube lamp
36.
37.
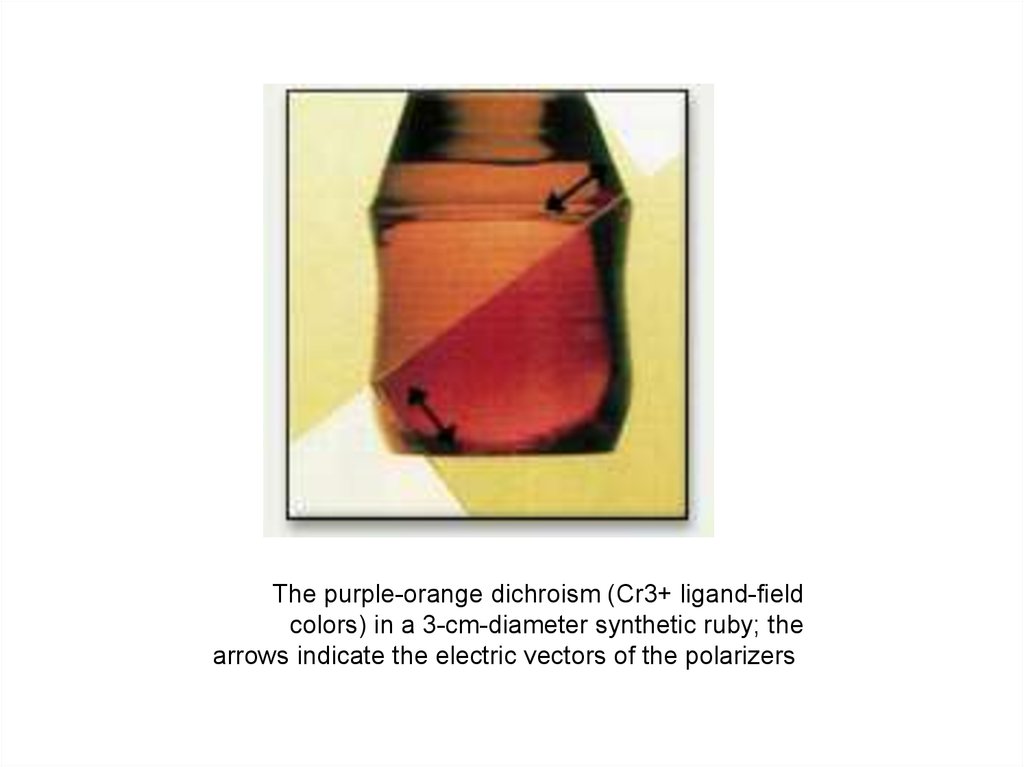
The purple-orange dichroism (Cr3+ ligand-fieldcolors) in a 3-cm-diameter synthetic ruby; the
arrows indicate the electric vectors of the polarizers
38.
Pleochroism is the ability of a mineral to absorb differentwavelengths of transmitted light depending upon its
crystallographic orientations.
39.
40. Charge Transfer in Sapphire
The deep blue color the gemstonesapphire is also based on impurity
doping into Al2O3. The color in
sapphire arises from the following
charge transfer excitation:
Fe2+ + Ti4+ Fe3+ + Ti3+
(lmax ~ 2.2
eV, 570 nm)
The transition is facilitated by the geometry of
the Al2O3 structure where the two ions share an
octahedral face, which allows for favorable
overlap of the dz2 orbitals.
Unlike the d-d transition in Ruby, the charge-
transfer excitation in sapphire is fully allowed.
Therefore, the color in sapphire requires only ~
0.01% impurities, while ~ 1% impurity level is
needed in ruby.
41.
In magnetite, the black iron oxide Fe3O4 or Fe2+O .Fe3+2O3, there is "homonuclear" charge transfer with
two valence states of the same metal in two different
sites, A and B:
FeA2+ + FeB3+ ---> FeA3+ + FeB2+
The right-hand side of this equation represents a
higher energy than the left-hand side, leading to
energy levels, light absorption, and the black color. In
sapphire this mechanism is also present, but there it
absorbs only in the infrared, as at a in Fig. 16. This
same mechanism gives the carbon-amber (beerbottle) color in glass made with iron sulfide and
charcoal, and the brilliant blue color to the pigment
potassium ferric ferrocyanide, Prussian blue Fe3+4
[Fe2+(CN)6]3. The brown-to- red colors of many rocks,
e.g., in the Painted Desert, derive from this
mechanism from traces of iron.
42. Cu2+ Transitions
The d9 configuration of Cu2+, leadsto a Jahn-Teller distortion of the
regular octahedral geometry, and
sets up a fairly low energy excitation
from dx2-y2 level to a dz2 level. If
this absorption falls in the red or
orange regions of the spectrum, a
green or blue color can result.
Some notable examples include:
Malachite (green)
Cu2CO3(OH)2
Turquoise (blue-green)
CuAl6(PO4)(OH)8*4H2O
Azurite (blue)
Cu3(CO3)2(OH)2
dx2-y2
Excited
State
dz2
Pseudo t2g
Ground
State
Pseudo t2g
dx2-y2
dz2
43. Anion to Metal Charge Transfer
Normally charge transfer transitions from an anion (i.e. O2-) to a cation fall in the UV region of the spectrum and do
not give rise to color. However, d0 cations in high
oxidation states are quite electronegative, lowering the
energy of the transition metal based LUMO. This moves
the transition into the visible region of the spectrum. The
strong covalency of the metal-oxygen bond also strongly
favors tetrahedral coordination, giving rise to a structure
containing isolated MO4n- tetrahedra. Some examples of
this are as follows:
Color = White
Color = Yellow
Color = Yellow
Color = Yellow
Color = Maroon
Ca3(VO4)2 (tetrahedral V5+)
PbCrO4 (tetrahedral Cr6+)
CaCrO4 & K2CrO4 (tetrahedral Cr6+)
PbMoO4 (tetrahedral Mo6+)
KMnO4 (tetrahedral Mn7+)