


 marketing
Similar presentations:


Multiple regression analysis demand evaluation
1.
Multiple regression analysisDemand
evaluation
1
2.
Simple linear regression is used to analyze theIn some cases, changes in demand are
relationship between one independent variable
satisfactorily explained by changes of one
affecting the demand, and the required quantity of
independent variable, such as price
goods or services
2
3.
We would like to investigatethe relationship between
demand and more than one
independent variable that
can be changed
3
4.
multipleregression
analysis
4
5.
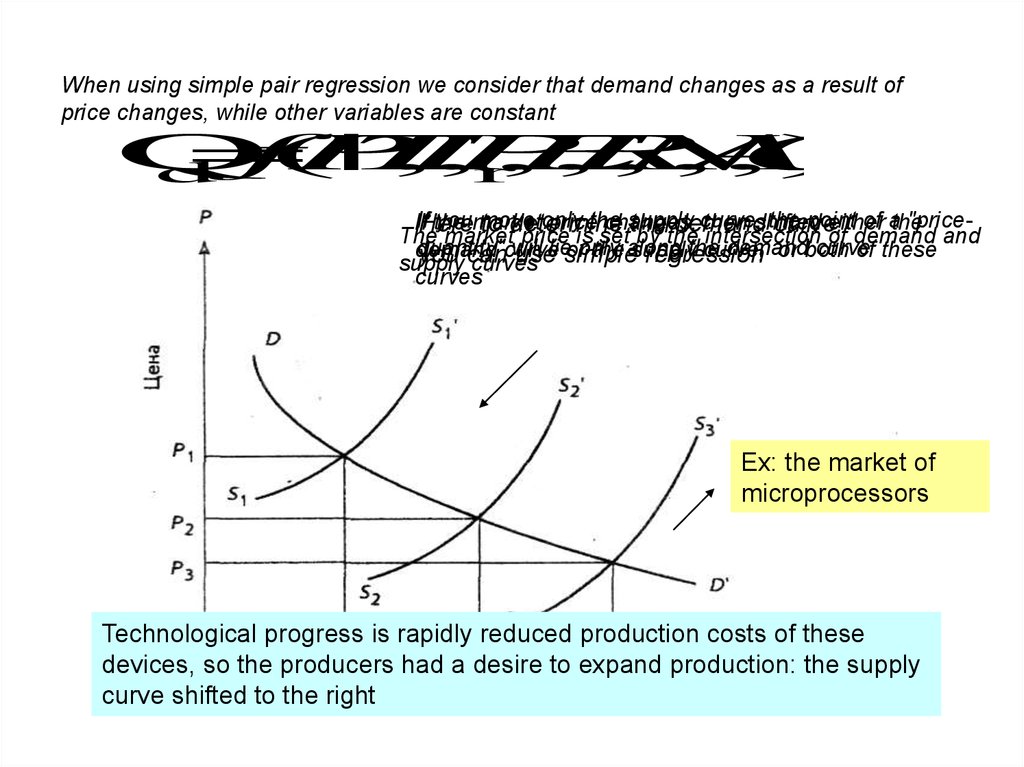
When using simple pair regression we consider that demand changes as a result ofprice changes, while other variables are constant
Q
f
(
P
|T
,
I
,
P
,
E
,
R
,
N
,
A
,
O
)
d
r
youmarket
move
only
supply
curve,
the
point
of athe
"priceIfHere
the
pricethe
changes,
then shifted
either
to determine
the
demand
curve,
The
market
price
is
set
by
the
intersection
of
demand
and
quantity"
will
lie
only
along
the
demand
curve
demand
curve
or
the
supply
curve,
or
both
of
these
you can
use simple regression
supply
curves
curves
Ех: the market of
microprocessors
Technological progress is rapidly reduced production costs of these
devices, so the producers had a desire to expand production: the supply
curve shifted to the right
5
6.
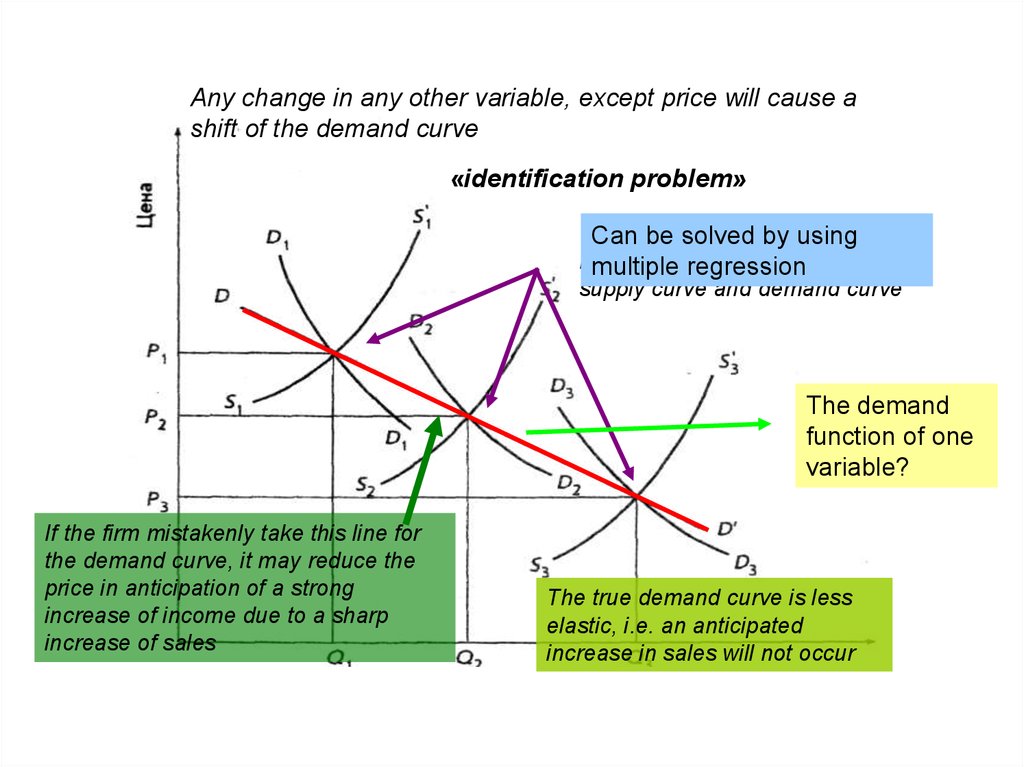
Any change in any other variable, except price will cause ashift of the demand curve
«identification problem»
Three
points
got as a
Can balance
be solved
by using
result
of displacement
multiple
regression of the
supply curve and demand curve
The demand
function of one
variable?
If the firm mistakenly take this line for
the demand curve, it may reduce the
price in anticipation of a strong
increase of income due to a sharp
increase of sales
The true demand curve is less
elastic, i.e. an anticipated
increase in sales will not occur
6
7.
Construction of multivariable demand functionTask: Reflection of the
relationship between
dependent and independent
variables
7
8.
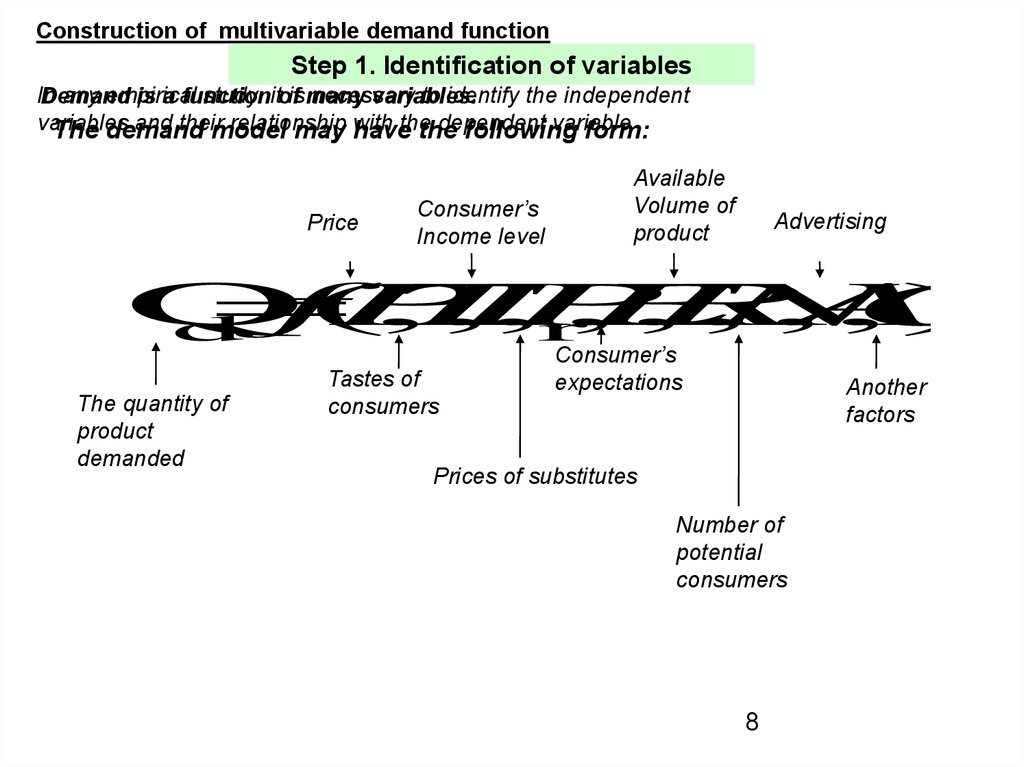
Construction of multivariable demand functionStep 1. Identification of variables
In
any empirical
study itofis many
necessary
to identify the independent
Demand
is a function
variables.
variables
and their
relationship
with the
dependent
variable
The demand
model
may have
the
following
form:
Price
Consumer’s
Income level
Available
Volume of
product
Advertising
Q
f
(
P
,
T
,
I
,
P
,
E
,
R
,
N
,
A
,
O
)
d
r
The quantity of
product
demanded
Tastes of
consumers
Consumer’s
expectations
Another
factors
Prices of substitutes
Number of
potential
consumers
8
9.
Construction of multivariable demand functionStep 1. Identification of variables
It is not enough to determine the relationship of the
demand variables with the necessary quantity of
goods
We must also determine whether the independent
variables are connected to each other
10.
Construction of multivariable demand functionStep 2. Collection and refinement of data
Consider the following aspects:
Organization of information (month, quarter, year);
The number of observations required to obtain good results
10
11.
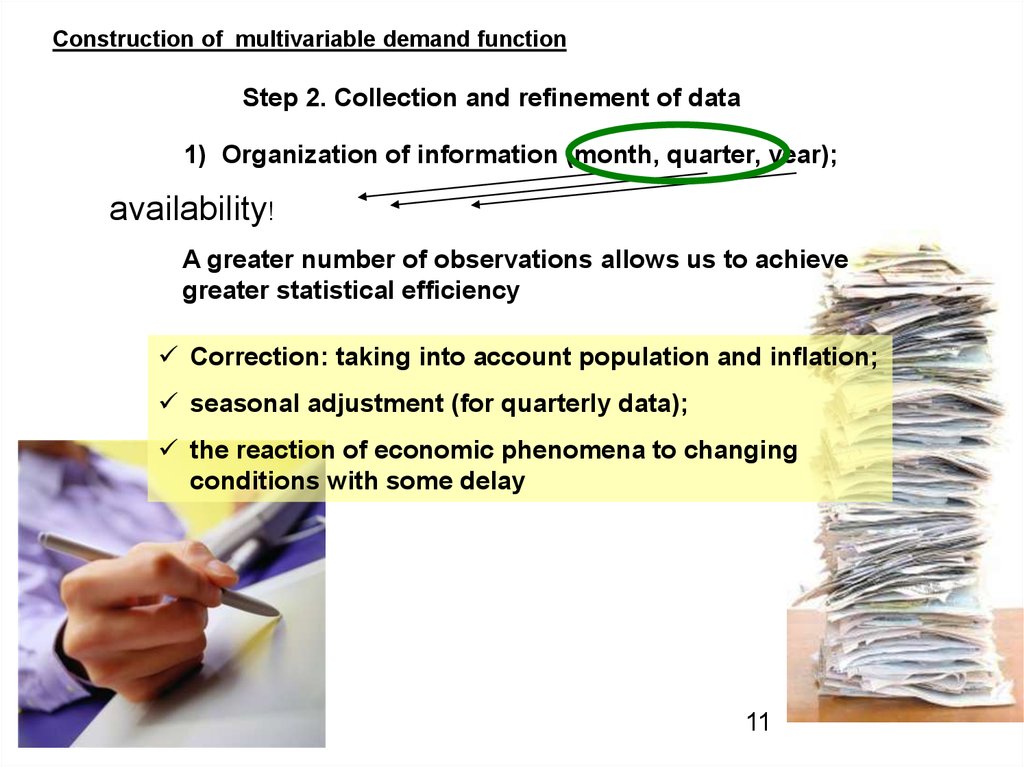
Construction of multivariable demand functionStep 2. Collection and refinement of data
1) Organization of information (month, quarter, year);
availability!
A greater number of observations allows us to achieve
greater statistical efficiency
Correction: taking into account population and inflation;
seasonal adjustment (for quarterly data);
the reaction of economic phenomena to changing
conditions with some delay
11
12.
Construction of multivariable demand functionStep 2. Collection and refinement of data
2) The number of observations required to obtain good
results
Basic rule: well-chosen model requires the number of
observations, that is at least three or four times more
than the number of independent variables
12
13.
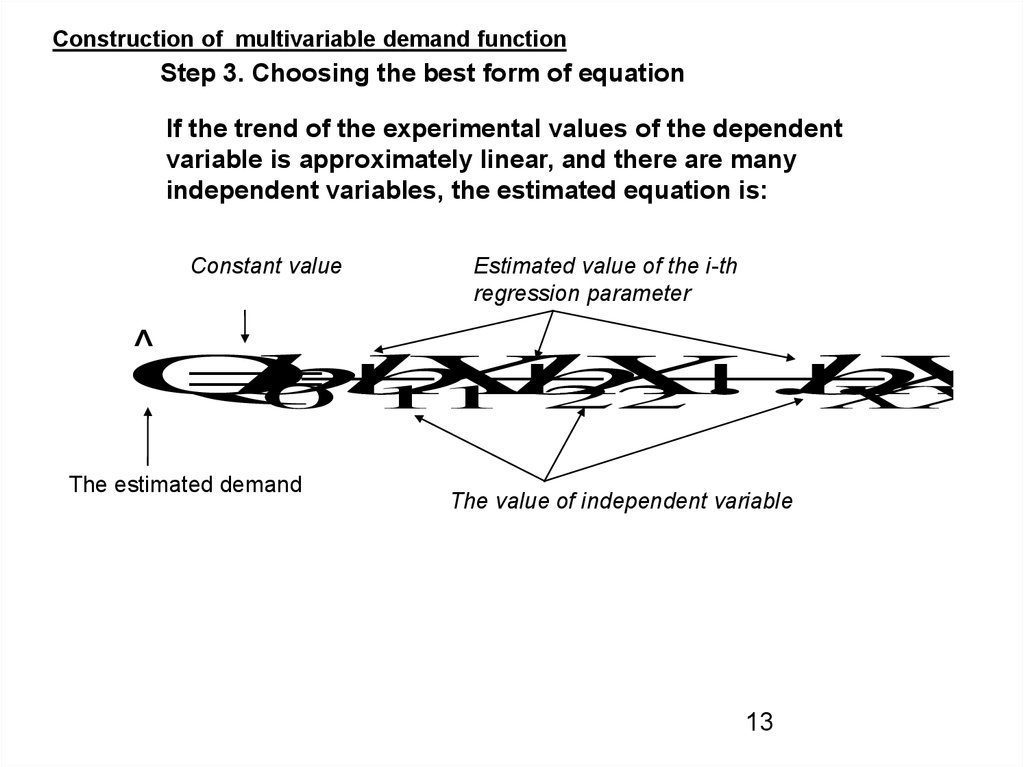
Construction of multivariable demand functionStep 3. Choosing the best form of equation
If the trend of the experimental values of the dependent
variable is approximately linear, and there are many
independent variables, the estimated equation is:
Constant value
Estimated value of the i-th
regression parameter
˄
Q
b
b
X
b
X
...
b
X
0
1
1
2
2
X
X
The estimated demand
The value of independent variable
13
14.
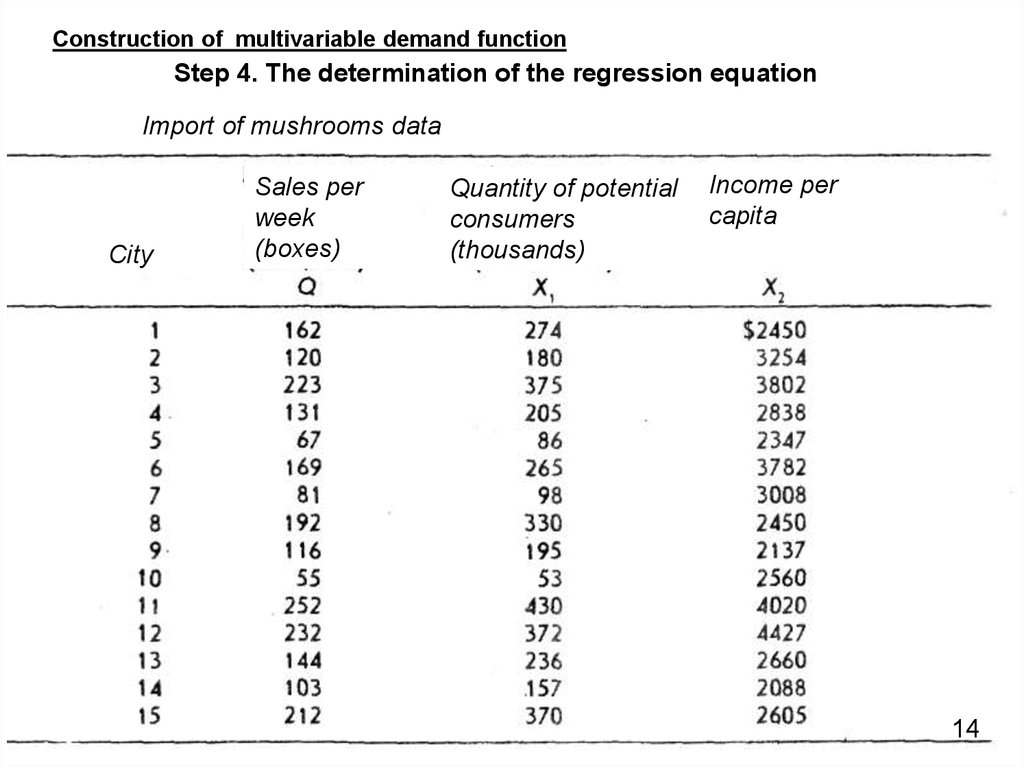
Construction of multivariable demand functionStep 4. The determination of the regression equation
Import of mushrooms data
City
Sales per
week
(boxes)
Quantity of potential
consumers
(thousands)
Income per
capita
14
15.
Construction of multivariable demand functionSales per
week
(boxes)
Step 4. The determination of the regression equation
Quantity of potential consumers (thousands)
Q
=
b
+
b
X
+
b
X
0
1
1
2
2
Sales per
week
(boxes)
Income per capita
15
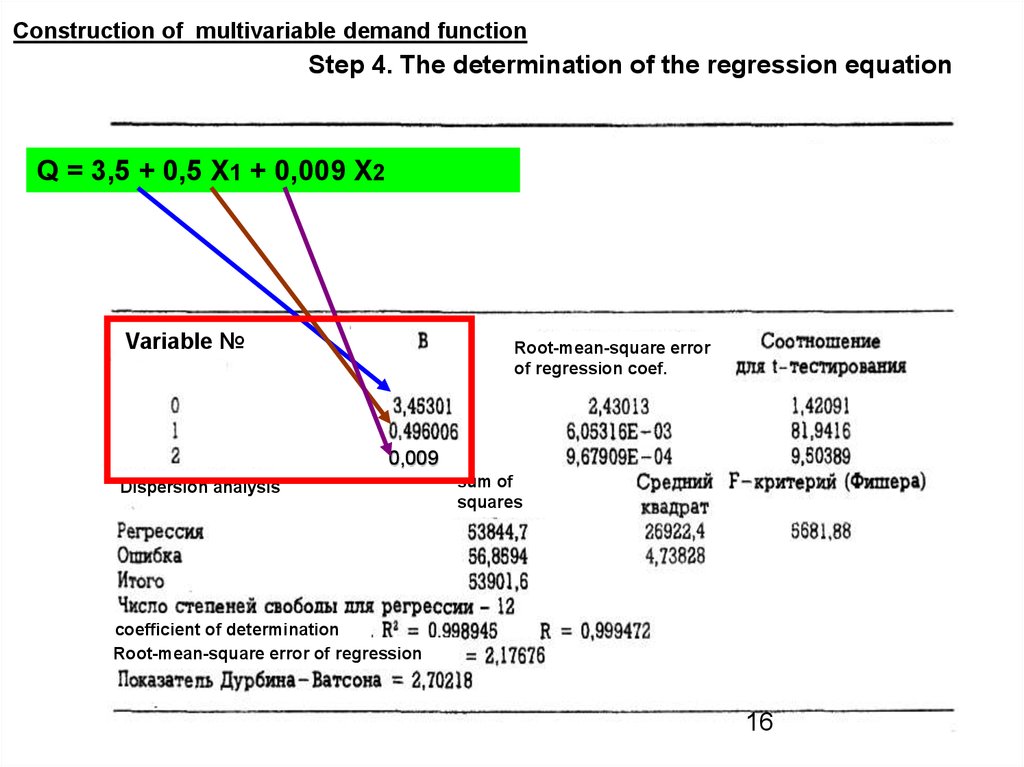
16.
Construction of multivariable demand functionStep 4. The determination of the regression equation
Q = 3,5 + 0,5 X1 + 0,009 X2
Variable №
Root-mean-square error
of regression coef.
0,009
Dispersion analysis
sum of
squares
coefficient of determination
Root-mean-square error of regression
16
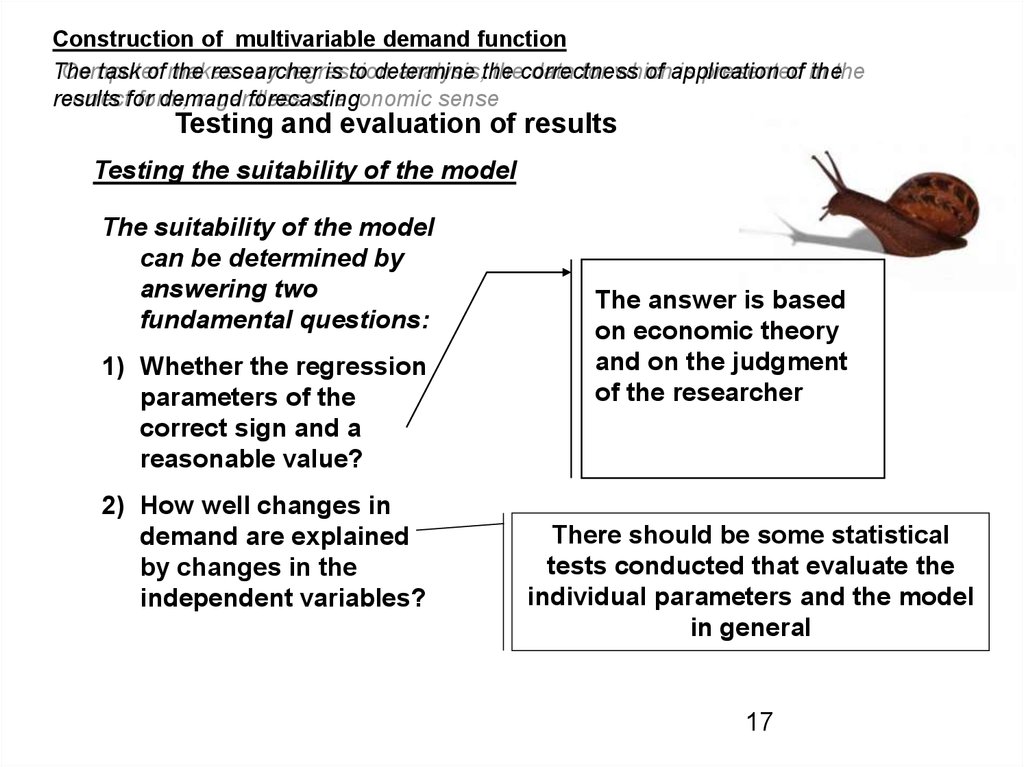
17.
Construction of multivariable demand functionThe
Computer
task of makes
the researcher
any regression
is to determine
analysis,the
thecorrectness
data for which
of application
is presented
of in
thethe
results
correctfor
form,
demand
regardless
forecasting
of economic sense
Testing and evaluation of results
Testing the suitability of the model
The suitability of the model
can be determined by
answering two
fundamental questions:
1) Whether the regression
parameters of the
correct sign and a
reasonable value?
2) How well changes in
demand are explained
by changes in the
independent variables?
The answer is based
on economic theory
and on the judgment
of the researcher
There should be some statistical
tests conducted that evaluate the
individual parameters and the model
in general
17