


")


 pedagogy
Similar presentations:
")
")


More Investigation Methods (Investigation Methods in RE)
1. More investigation methods
MORE INVESTIGATIONMETHODS
DR. CHANDRA REKA
2. OUTLINE
INTERFACE ANALYSISBPMN
WORKSHOPS
OTHERS
3. Learning Outcomes
At the end of this LESSONyou should be able to:
◦ Describe Interface Analysis
◦ Elaborate Business Process
Modelling
◦ Describe a Requirements
Elicitation Workshops
◦ Identify Various other
creative methods in RE
4. 1. Interface Analysis
1. INTERFACEANALYSIS
5. 1.1: Principles of User Interface
The FOUR “golden rules” are:Place users in control of the interface
1.Make it comfortable to interact with a
product
1.Reduce cognitive load
1.Make user interfaces consistent
6. 1.1.1 Place the user in control
◦ Define interaction modes in a way that does not force a user into unnecessary or undesired actions. Theuser should always be able to enter and exit the mode with little or no effort.
◦ Provide for flexible interaction. Because different users have different interaction preferences, choices
should be provided by using keyboard commands, mouse movements, digitizer pen or voice recognition
commands.
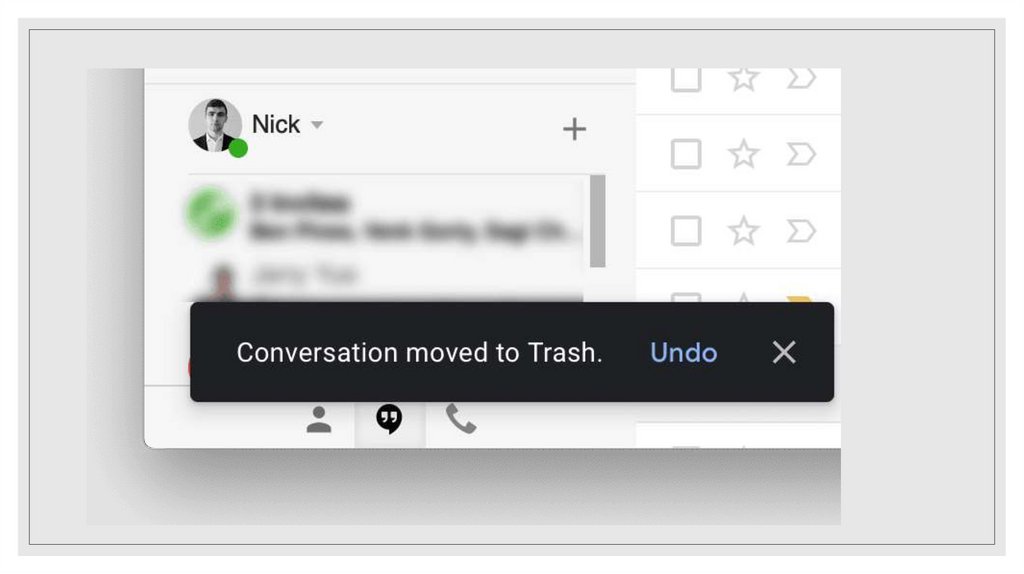
◦ Allow user interaction to be interruptible and undoable. A user should be able to interrupt a sequence of
actions to do something else without losing the work that has been done. The user should always be able
to “undo” any action.
◦ Streamline interaction as skill levels advance and allow the interaction to be customized. Allow to design a
macro if the user is to perform the same sequence of actions repeatedly.
◦ Hide technical internals from the casual user. The user interface should move the user into the virtual world
of the application. A user should never be required to type O/S commands from within application
software.
◦ Design for direct interaction with objects that appear on the screen. The user feels a sense of control when
able to manipulate the objects that are necessary to perform a task in a manner similar to what would
occur if the object were a physical thing.
7.
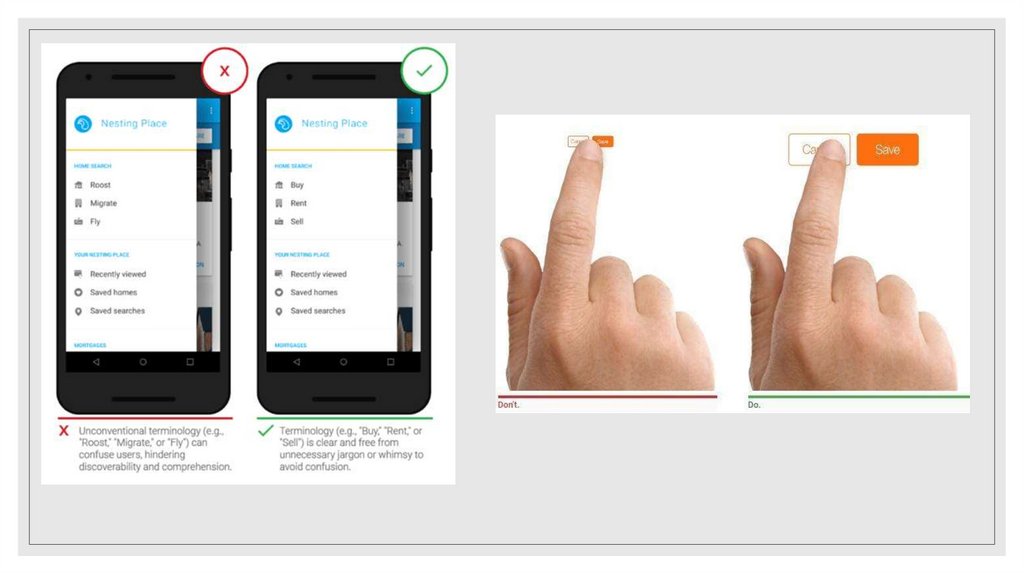
8. 1.1.2 Make it comfortable to interact with a product
◦ Eliminate all elements that are not helping your users◦ Don’t ask users for data they’ve already entered
◦ Avoid jargon and system-oriented terms
◦ Apply Fitts’s Law to interactive elements
◦ Fitts Law states that the time to acquire a target is a function of the distance to and size of the target.
This means that it’s better to design large targets for important functions (big buttons are easier to
interact with).
9.
10. 1.1.3. Reduce User’s Memory Load
◦ Whenever possible, the system should “remember” pertinent information and assist the user with an interactionscenario that assists recall.
◦ Reduce demand on short-term memory. Provide visual cues that enable a user to recognize past actions, rather
than having to recall them.
◦ Establish meaningful defaults. A user should be able to specify individual preferences; however, a reset option
should be available to enable the redefinition of original default values.
◦ Define shortcuts that are intuitive. “Example: Alt-P to print. Using easy to remember mnemonics.”
◦ The visual layout of the interface should be based on a real world metaphor. Enable the user to rely on wellunderstood visual cues, rather than remembering an arcane interaction sequence. For a bill payment system
use a check book and check register metaphor to guide the user through the process.
◦ Disclose information in a progressive fashion. The interface should be organized hierarchically. The information
should be presented at a high level of abstraction.
11.
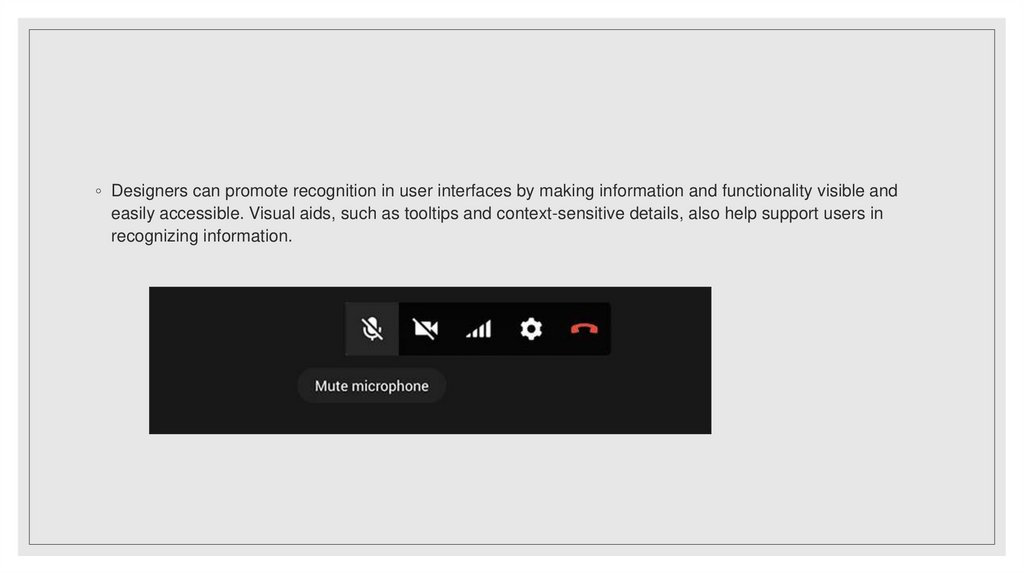
◦ Designers can promote recognition in user interfaces by making information and functionality visible andeasily accessible. Visual aids, such as tooltips and context-sensitive details, also help support users in
recognizing information.
12. 1.1.4. Make the interface Consistent
The interface should present and acquire information in a consistent manner:◦ All visual information is organized according to a design standard that is maintained throughout all
screen displays,
◦ Input mechanisms are constrained to a limited set that is used consistently throughout the application,
◦ Mechanisms for navigating from task to task are consistently defined and implemented.
13. A set of design principles that help make the interface consistent:
◦ Allow the user to put the current task into ameaningful context. The user should be able to
determine where he has come from and what
alternatives exist for a transition to a new task.
◦ Maintain consistency across a family of
applications. “MS Office Suite”
◦ If past interactive models have created user
expectations, do not make changes unless there
is a compelling reason to do so. Once a
particular interactive sequence has become a
de facto standard (Alt-S save file), the user
expects this in every application she encounters.
14. 1.2: User Interface Design Models
◦ The overall process for analyzing and designing a UI begins with the creation of models of system.◦ Four different models come into play when a user interface is to be analyzed and
designed.
1. User model: a profile of all end users of the system. Users can be categorized as:
◦ Novices: No syntactic and little semantic knowledge of the system.
◦ Knowledgeable, intermittent users: reasonable knowledge of the system.
◦ Knowledgeable, frequent users: good syntactic and semantic knowledge of the
system.
2. Design model: a design realization of the user model that incorporates data, architectural,
interface, and procedural representations of the software.
3. Mental model (system perception): the user’s mental image of what the interface
is. The user’s mental model shapes how the user perceives the interface and
whether the UI meets the user’s needs.
4. Implementation model: the interface “look and feel of the interface” coupled
with all supporting information (documentation) that describes interface syntax
and semantics.
15. 1.3: The Process
◦ The analysis and design process for UIs isiterative and can be represented using
a spiral model.
◦ The user interface analysis and design
process encompasses four distinct
framework activities:
◦ User, task and environment analysis and
modeling.
◦ Interface design
◦ Interface construction (implementation)
◦ Interface validation
16. 2. Business Process Modelling (BPMN)
2. BUSINESS PROCESSMODELLING (BPMN)
17. Business Process Modeling
◦ A business has to be kept under close monitoring throughout the year andthere are different ways to evaluate its overall performance.
◦ With a pictorial representation, it is much easier for a team to understand
the processes, backlogs, and bottlenecks that have been hindering business
growth.
◦ A BPMN Diagram uses these symbols and elements to illustrate how the logic behind a
workflow will function from start-to-finish. Like planning a route for a road trip, a BPMN
Diagram pinpoints every action information will take throughout a workflow.
◦ Simple way to create a BPMN:
https://www.youtube.com/watch?v=odhFiGcqwtw
18. Symbols & Notation of BPMN
Symbols &Notation of BPMN
◦ Flow Objects – Circles are used to represent events
in Flow objects category while rectangles with
rounded corners represent activities and diamond
shapes showcase control points.
◦ Connecting Objects – A dash, the long line is used
to represent a task has been transferred from one
point to another while dashed lines signify a
message in between two processes
◦ Swim Lanes – When two or more people have to
coordinate and share work to complete it, swim
lanes are used to represent them. Pool signifies the
task while lanes denote people or teams.
◦ Artifacts – They are used to fill in the missing
information. Dotted lines show how additional
information is added, squares outlined with dots
and dashes help group element and square
bracket supports in annotating text
19. Some BPMN Tools you can explore
Top 10 BPMN 2 Modeling Tools :Sparx Enterprise Architect
MagicDraw (No Magic)
UModel (Altova)
Visual Paradigm (Visual Paradigm)
Rational Software Architect (IBM)
Modelio (Free & Open Source)
Camunda Modeler (Camunda / Freeware)
ARIS Express (Software AG / Freeware)
20. 3. Workshops in RE
3. WORKSHOPS IN RE21. Benefits of a running a requirement gathering workshop
◦ People have to justify their views in front of a larger group ofstakeholders. This often helps with eliminating nonsense type
requirements you might get if you only do one on one interviews.
◦ Discussion of each topic refines and clarifies the requirement.
Your requirement quality is typically much higher at the end of a
workshop than a one on one interview.
◦ Workshops are a great vehicle to strengthen stakeholder ‘buy in’.
Involving people in a group set up to discuss a topic of common
interest does wonders for stakeholder support in the project.
22. Disadvantages of a running a requirement gathering workshop
◦ It takes more effort to plan, co-ordinate and prepare for.◦ You don’t always manage to get all the right people in the room
at the same time. (Idea here: Schedule more workshops and
rerun the same session multiple times!)
◦ You may need more time for requirements gathering activities
but the upside is that your requirement quality is typically higher.
23. Facilitator task to plan for a workshop…
◦ The more structure you can give a workshop the more focused your session will be. Ifyou don’t have an agenda or any pre-developed materials to run the session with you
will find that there might be a lot of ideas and activity in the session but it will most likely
be of a poor quality.
◦ Know who is coming to your workshop. This is important because everyone who is
coming will have their own ideas of what they want to get out of it. If you don’t have a
clue who they are, how will you be able to plan for meeting their expectations or ensure
their objectives are met? In an ideal world, meet everyone before the requirement
gathering workshop for a short chat and understand their views of where they see the
project going!
◦ You as the facilitator can control the flow of a workshop with so much less effort if you
are prepared and have planned the session than if you walk in blind. You will
also appear more professional, in control and your stakeholders will trust you.
24. 5. Other creative methods of RE
5. OTHER CREATIVEMETHODS OF RE
25. Wireframes
◦ Wireframes provides a blueprintof the interface of a website or
app by visualizing its navigation
and layout. It helps you
understand how the app or
website will work and identify if
there are any errors in the design.
◦ Using a wireframe template like
the one attached allows you and
your team to understand how
your system works.
26. UI Mockups
◦ A more graphic, fleshed-out version ofthe wireframe is the UI mockup. It will
not only help you get an idea about
how your application works, but also
how it will look.
◦ With Creately’s tool you can add links
to the elements of the diagram
making it navigable, so when you
click a button it will take you to the
relevant page. This will help you make
sense of the user experience of the
website.
https://creately.com/blog/diagrams/bu
siness-process-modeling-techniques/
27. Mind Maps
MIND MAPS28. Benefits of using MIND MAP
◦ Save time. Up to 95% of time can be saved by using thismethod for a number of reasons. We save time by writing
only key words and noting only the most relevant
information. As we elicit requirements and notice that
some information is relevant in more than one category,
we simply draw an association or a link from one area to
the other instead of re-writing the information.
◦ Gain clarity. By displaying your requirements all on one
page and for everyone to see, you can be assured that
everyone can capture the “big picture.”
◦ Increase learning and retention. Mind mapping increases
learning and retention up to 95% over conventional note
taking.
29. System Context Diagrams
◦ Context diagrams is one of the softwarerequirements gathering techniques that
you should use in the very beginning of
the process.
◦ System context diagrams give a highlevel view of the system in its
environment and how it interacts with
external entities such as users, other
systems etc.
30. EXERCISE – Case Study
Draw a creative context diagram for Concert Management / E-Ticketing SystemPost your diagram in the slide given. (GROUP)
BE CREATIVE!!
Sample Diagram: Online ordering System
31. TASK 1
◦ CREATE A SIMPLE BPMN USING CAWEMO◦ UPLOAD IN MOODLE
32. Reference
◦ https://www2.southeastern.edu/Academics/Faculty/galkadi/285/notes/Chapter12.doc◦ https://babokpage.wordpress.com/techniques/interface-analysis/
◦ https://www.cflowapps.com/business-process-modeling/
◦ https://www.processmaker.com/blog/bpmn-diagram-and-symbols/
◦ https://business-analysis-excellence.com/requirement-gathering/
◦ https://creately.com/blog/diagrams/requirements-gathering-techniques/