

 marketing
Similar presentations:


Annual Performance Report 2025
1.
ChihiroAnnual
Performance
R eport 2025
Innovating E very S tep, Presented By Chihiro.
2.
Our team has opened doors to newrealms, inviting exploration into the
unknown where dreams meet reality.
We achieved milestones in new markets and
technologies, deepening our impact. This was possible
due to our team's dedication, our partners' trust, and
stakeholders' support. Thank you all.
Alex Turner, CE O – 2025
3.
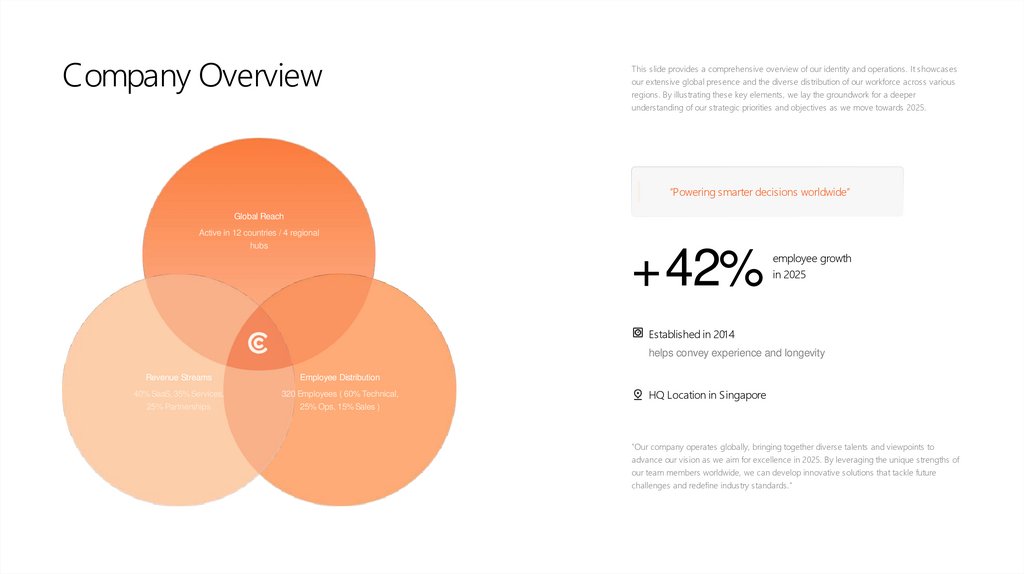
Company OverviewThis slide provides a comprehensive overview of our identity and operations. It showcases
our extensive global presence and the diverse distribution of our workforce across various
regions. By illustrating these key elements, we lay the groundwork for a deeper
understanding of our strategic priorities and objectives as we move towards 2025.
“Powering smarter decisions worldwide”
Global Reach
Active in 12 countries / 4 regional
hubs
+42%
employee growth
in 2025
Established in 2014
helps convey experience and longevity
Revenue Streams
Employee Distribution
40% SaaS, 35% Services,
320 Employees ( 60% Technical,
25% Partnerships
25% Ops, 15% Sales )
HQ Location in Singapore
"Our company operates globally, bringing together diverse talents and viewpoints to
advance our vision as we aim for excellence in 2025. By leveraging the unique strengths of
our team members worldwide, we can develop innovative solutions that tackle future
challenges and redefine industry standards."
4.
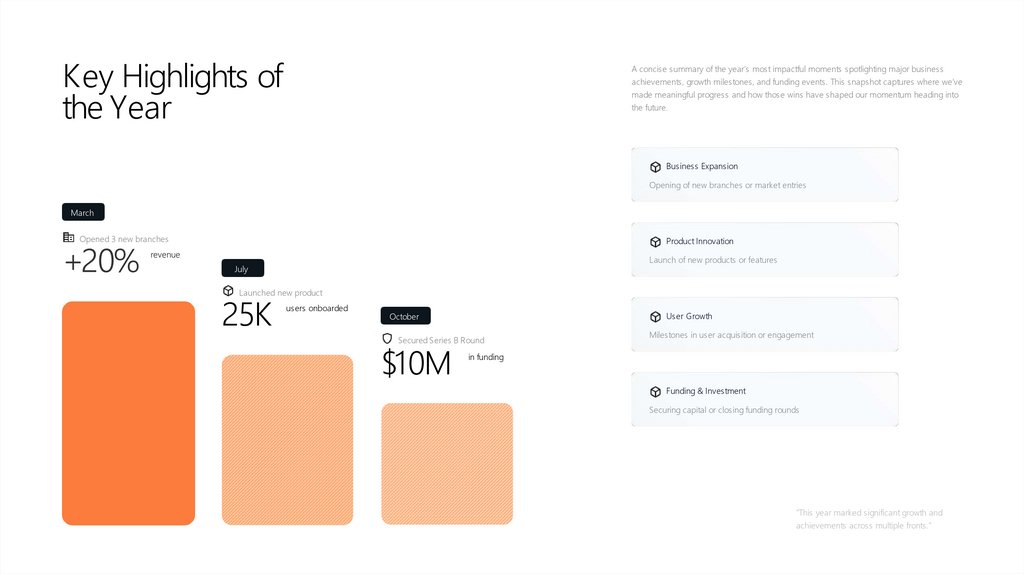
Key Highlights ofthe Year
A concise summary of the year’s most impactful moments spotlighting major business
achievements, growth milestones, and funding events. This snapshot captures where we’ve
made meaningful progress and how those wins have shaped our momentum heading into
the future.
Business Expansion
Opening of new branches or market entries
March
Opened 3 new branches
Product Innovation
Launch of new products or features
July
Launched new product
25K
users onboarded
User Growth
October
Secured Series B Round
$10M
Milestones in user acquisition or engagement
in funding
Funding & Investment
Securing capital or closing funding rounds
“This year marked significant growth and
achievements across multiple fronts.”
5.
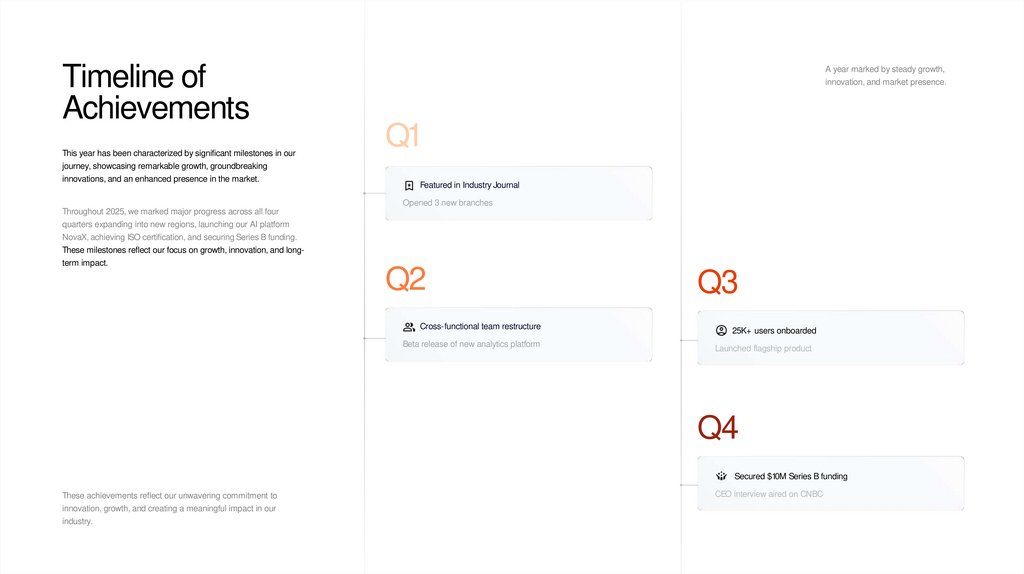
Timeline ofAchievements
This year has been characterized by significant milestones in our
A year marked by steady growth,
innovation, and market presence.
Q1
journey, showcasing remarkable growth, groundbreaking
innovations, and an enhanced presence in the market.
Featured in Industry Journal
Opened 3 new branches
Throughout 2025, we marked major progress across all four
quarters expanding into new regions, launching our AI platform
NovaX, achieving ISO certification, and securing Series B funding.
These milestones reflect our focus on growth, innovation, and longterm impact.
Q2
Cross-functional team restructure
Beta release of new analytics platform
Q3
25K+ users onboarded
Launched flagship product
Q4
Secured $10M Series B funding
These achievements reflect our unwavering commitment to
innovation, growth, and creating a meaningful impact in our
industry.
CEO interview aired on CNBC
6.
S uccess is the sum of small efforts, repeatedday in and day out.
7.
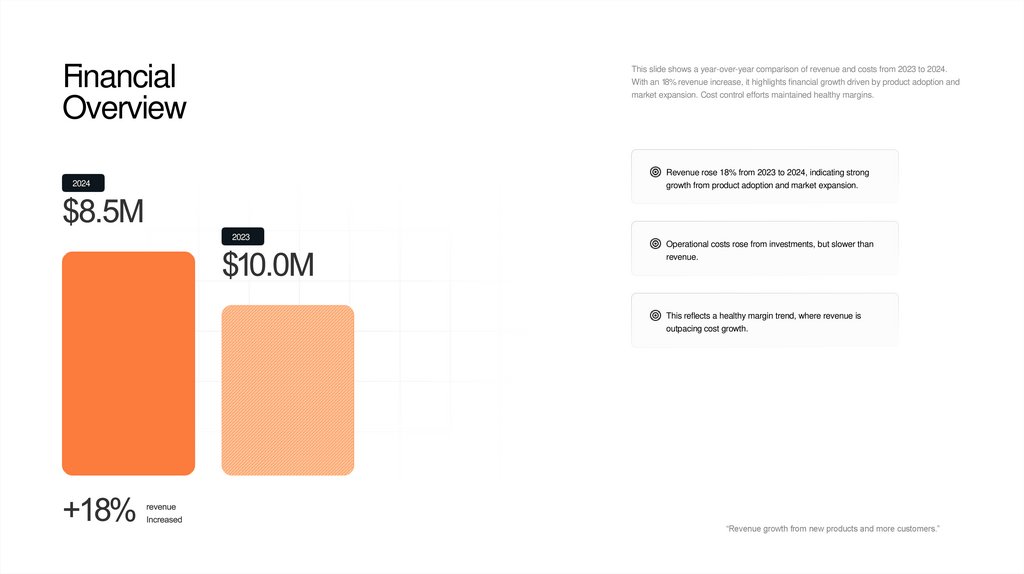
FinancialOverview
This slide shows a year-over-year comparison of revenue and costs from 2023 to 2024.
With an 18% revenue increase, it highlights financial growth driven by product adoption and
market expansion. Cost control efforts maintained healthy margins.
Revenue rose 18% from 2023 to 2024, indicating strong
2024
growth from product adoption and market expansion.
2023
Operational costs rose from investments, but slower than
revenue.
This reflects a healthy margin trend, where revenue is
outpacing cost growth.
“Revenue growth from new products and more customers.”
8.
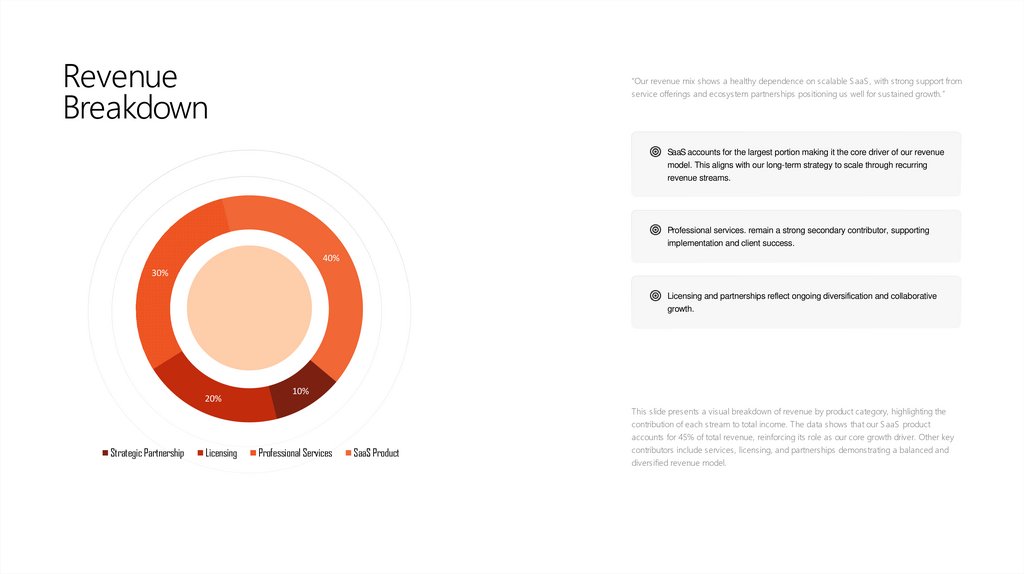
RevenueBreakdown
“Our revenue mix shows a healthy dependence on scalable SaaS , with strong support from
service offerings and ecosystem partnerships positioning us well for sustained growth.”
SaaS accounts for the largest portion making it the core driver of our revenue
model. This aligns with our long-term strategy to scale through recurring
revenue streams.
Professional services. remain a strong secondary contributor, supporting
implementation and client success.
40%
30%
Licensing and partnerships reflect ongoing diversification and collaborative
growth.
20%
10%
This slide presents a visual breakdown of revenue by product category, highlighting the
contribution of each stream to total income. The data shows that our SaaS product
accounts for 45% of total revenue, reinforcing its role as our core growth driver. Other key
Strategic Partnership
Licensing
Professional Services
SaaS Product
contributors include services, licensing, and partnerships demonstrating a balanced and
diversified revenue model.
9.
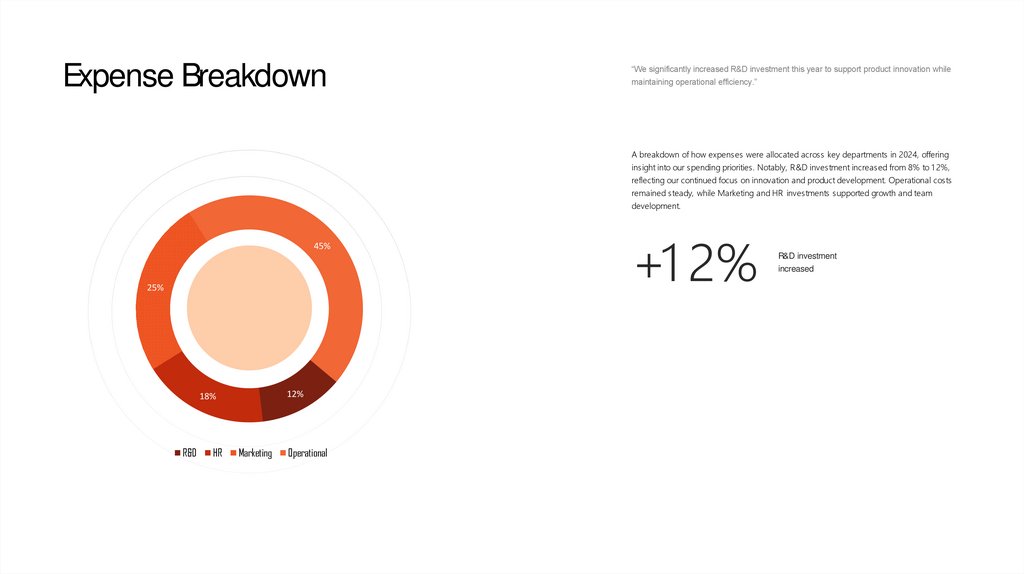
Expense Breakdown“We significantly increased R&D investment this year to support product innovation while
maintaining operational efficiency.”
A breakdown of how expenses were allocated across key departments in 2024, offering
insight into our spending priorities. Notably, R&D investment increased from 8% to 1 2%,
reflecting our continued focus on innovation and product development. Operational costs
remained steady, while Marketing and HR investments supported growth and team
development.
45%
25%
12%
18%
R&D
HR
Marketing
Operational
+1 2%
R&D investment
increased
10.
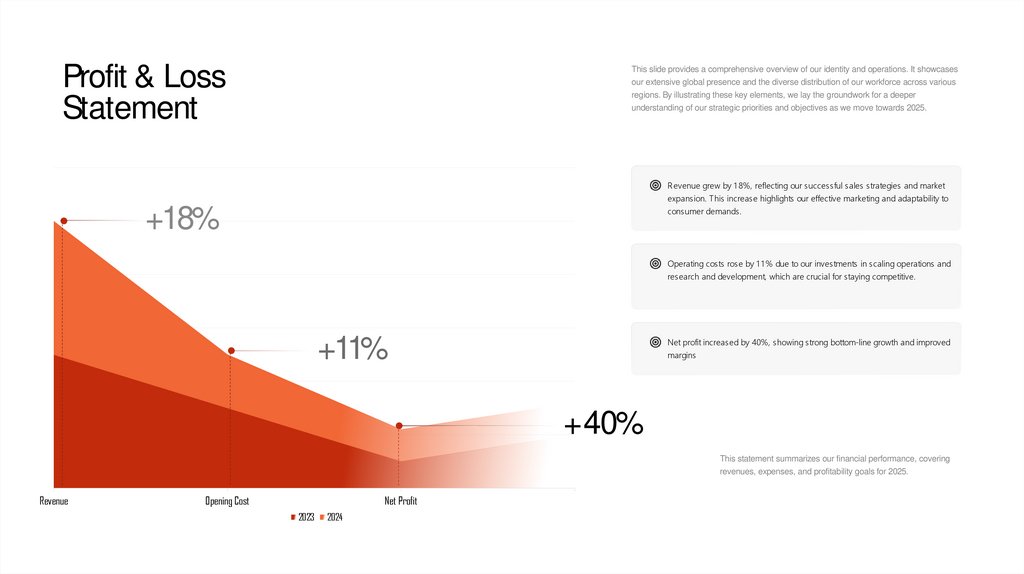
Profit & LossStatement
This slide provides a comprehensive overview of our identity and operations. It showcases
our extensive global presence and the diverse distribution of our workforce across various
regions. By illustrating these key elements, we lay the groundwork for a deeper
understanding of our strategic priorities and objectives as we move towards 2025.
R evenue grew by 1 8%, reflecting our successful sales strategies and market
expansion. This increase highlights our effective marketing and adaptability to
consumer demands.
+18%
Operating costs rose by 1 1 % due to our investments in scaling operations and
research and development, which are crucial for staying competitive.
+11%
Net profit increased by 40%, showing strong bottom-line growth and improved
margins
+40%
This statement summarizes our financial performance, covering
revenues, expenses, and profitability goals for 2025.
Revenue
Opening Cost
Net Profit
2023
2024
11.
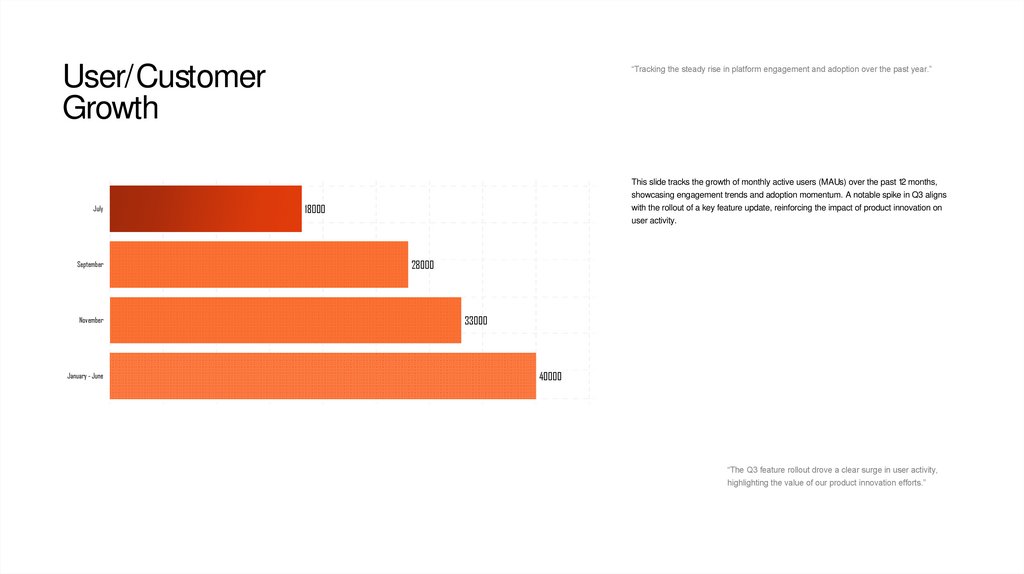
User/CustomerGrowth
“Tracking the steady rise in platform engagement and adoption over the past year.”
This slide tracks the growth of monthly active users (MAUs) over the past 12 months,
showcasing engagement trends and adoption momentum. A notable spike in Q3 aligns
July
18000
with the rollout of a key feature update, reinforcing the impact of product innovation on
user activity.
September
November
January - June
28000
33000
40000
“The Q3 feature rollout drove a clear surge in user activity,
highlighting the value of our product innovation efforts.”
12.
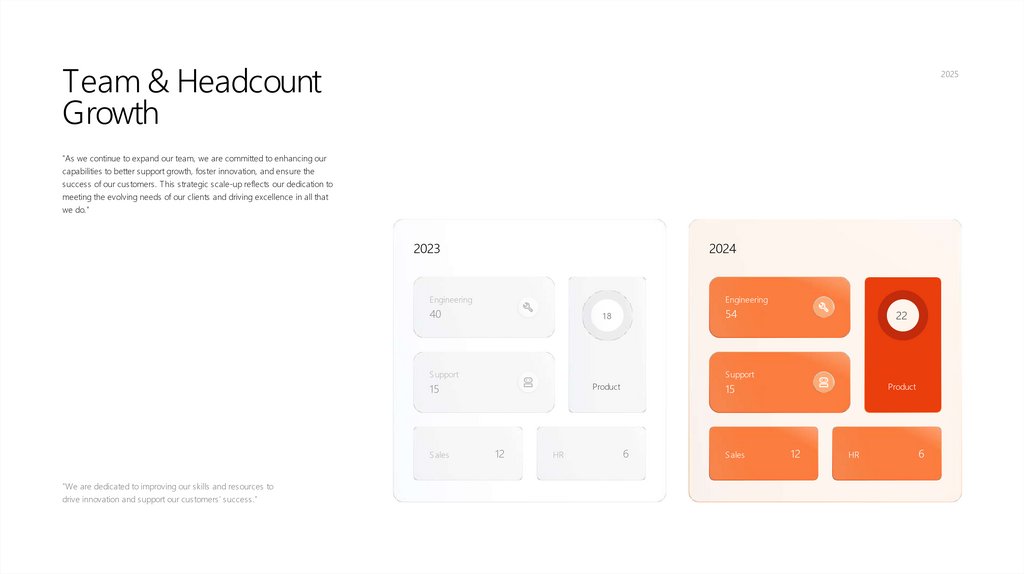
Team & HeadcountGrowth
2025
"As we continue to expand our team, we are committed to enhancing our
capabilities to better support growth, foster innovation, and ensure the
success of our customers. This strategic scale-up reflects our dedication to
meeting the evolving needs of our clients and driving excellence in all that
we do."
2023
2024
Engineering
Engineering
40
54
18
Support
Support
Product
15
Sales
"We are dedicated to improving our skills and resources to
drive innovation and support our customers' success."
22
12
HR
Product
15
6
Sales
12
HR
6
13.
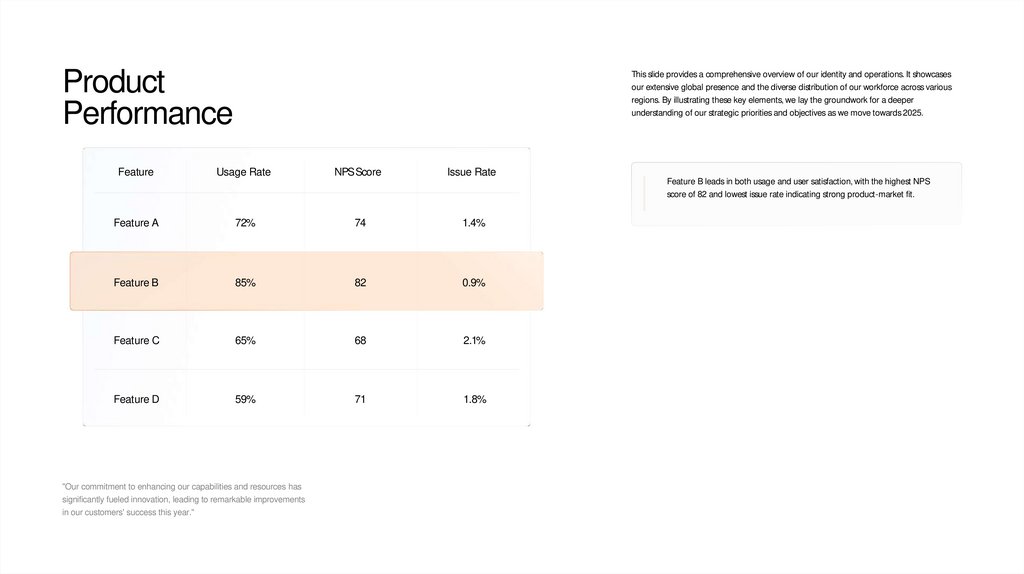
ProductPerformance
Feature
This slide provides a comprehensive overview of our identity and operations. It showcases
our extensive global presence and the diverse distribution of our workforce across various
regions. By illustrating these key elements, we lay the groundwork for a deeper
understanding of our strategic priorities and objectives as we move towards 2025.
Usage Rate
NPS Score
Issue Rate
Feature B leads in both usage and user satisfaction, with the highest NPS
score of 82 and lowest issue rate indicating strong product-market fit.
Feature A
72%
74
1.4%
Feature B
85%
82
0.9%
Feature C
65%
68
2.1%
Feature D
59%
71
1.8%
"Our commitment to enhancing our capabilities and resources has
significantly fueled innovation, leading to remarkable improvements
in our customers' success this year."
14.
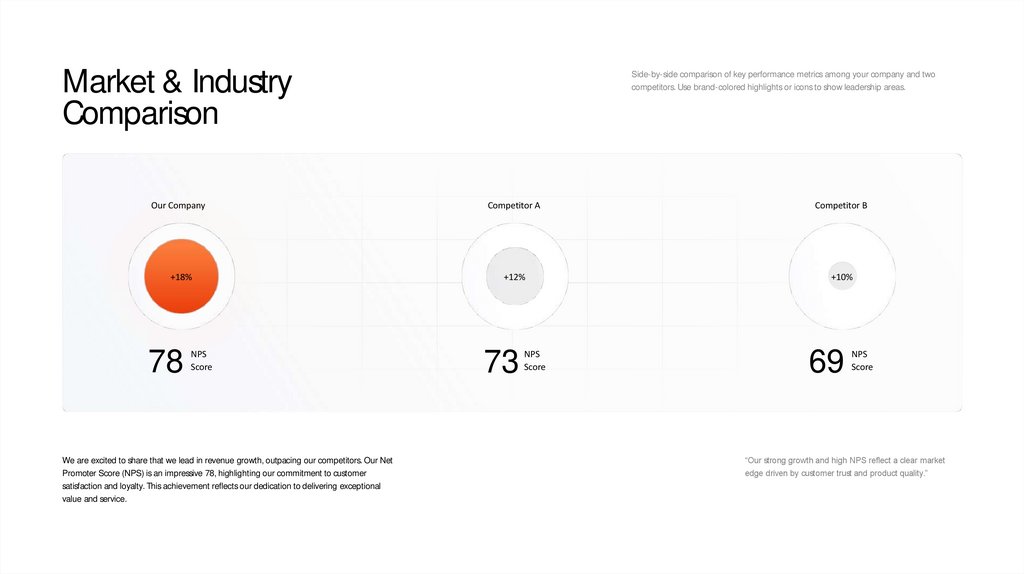
Market & IndustryComparison
Side-by-side comparison of key performance metrics among your company and two
competitors. Use brand-colored highlights or icons to show leadership areas.
Our Company
Competitor A
Competitor B
+18%
+12%
+10%
78
NPS
Score
73
NPS
Score
69
NPS
Score
We are excited to share that we lead in revenue growth, outpacing our competitors. Our Net
“Our strong growth and high NPS reflect a clear market
Promoter Score (NPS) is an impressive 78, highlighting our commitment to customer
edge driven by customer trust and product quality.”
satisfaction and loyalty. This achievement reflects our dedication to delivering exceptional
value and service.
15.
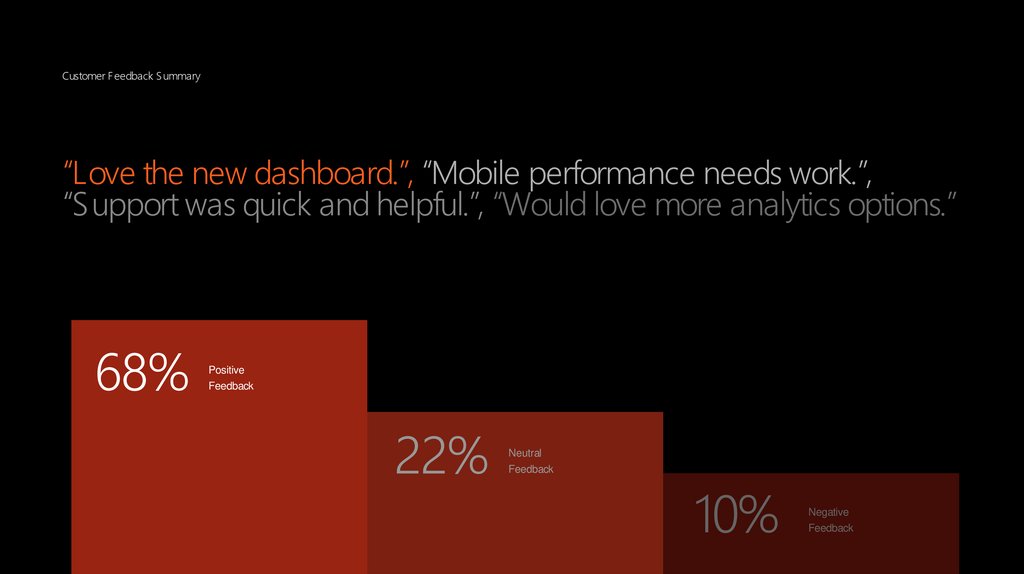
Customer F eedback S ummary“Love the new dashboard.”, “Mobile performance needs work.”,
“Support was quick and helpful.”, “Would love more analytics options.”
68%
Positive
Feedback
22%
Neutral
Feedback
10%
Negative
Feedback
16.
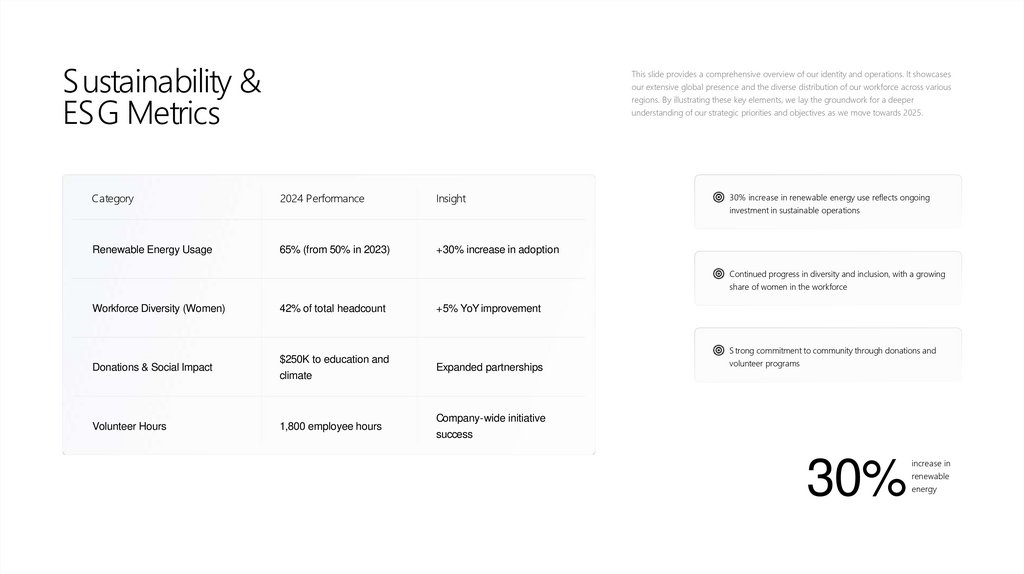
Sustainability &ESG Metrics
This slide provides a comprehensive overview of our identity and operations. It showcases
our extensive global presence and the diverse distribution of our workforce across various
regions. By illustrating these key elements, we lay the groundwork for a deeper
understanding of our strategic priorities and objectives as we move towards 2025.
Category
2024 Performance
Insight
Renewable Energy Usage
65% (from 50% in 2023)
+30% increase in adoption
30% increase in renewable energy use reflects ongoing
investment in sustainable operations
Continued progress in diversity and inclusion, with a growing
share of women in the workforce
Workforce Diversity (Women)
Donations & Social Impact
Volunteer Hours
42% of total headcount
+5% YoY improvement
S trong commitment to community through donations and
$250K to education and
climate
Expanded partnerships
1,800 employee hours
Company-wide initiative
success
volunteer programs
30%
increase in
renewable
energy
17.
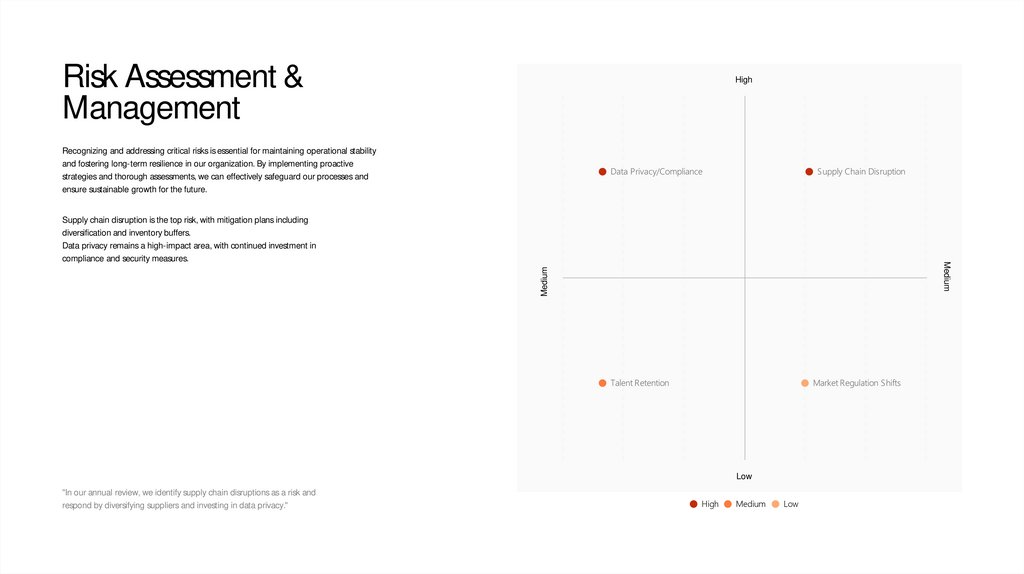
Risk Assessment &Management
High
Recognizing and addressing critical risks is essential for maintaining operational stability
and fostering long-term resilience in our organization. By implementing proactive
strategies and thorough assessments, we can effectively safeguard our processes and
ensure sustainable growth for the future.
Supply chain disruption is the top risk, with mitigation plans including
diversification and inventory buffers.
Data privacy remains a high-impact area, with continued investment in
Medium
Medium
compliance and security measures.
Low
"In our annual review, we identify supply chain disruptions as a risk and
respond by diversifying suppliers and investing in data privacy."
High
Medium
Low
18.
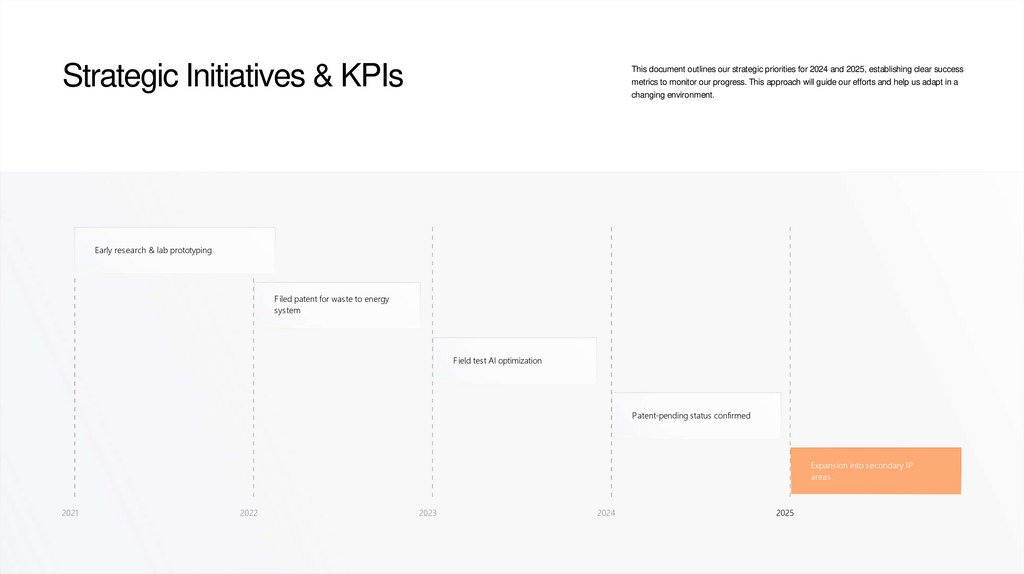
Strategic Initiatives & KPIsThis document outlines our strategic priorities for 2024 and 2025, establishing clear success
metrics to monitor our progress. This approach will guide our efforts and help us adapt in a
changing environment.
Early research & lab prototyping
Filed patent for waste to energy
system
Field test AI optimization
Patent-pending status confirmed
Expansion into secondary IP
areas.
2021
2022
2023
2024
2025
19.
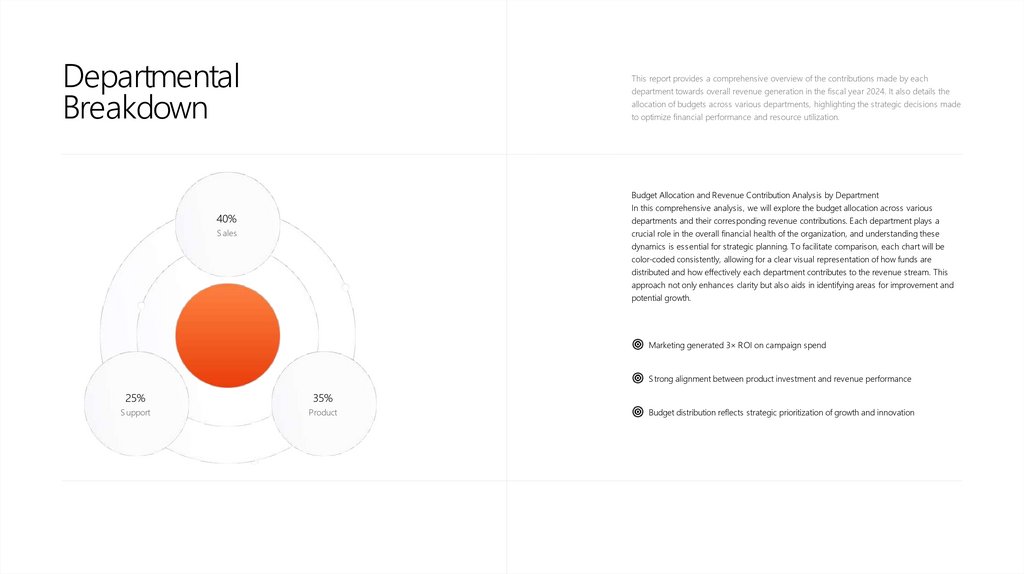
DepartmentalBreakdown
This report provides a comprehensive overview of the contributions made by each
department towards overall revenue generation in the fiscal year 2024. It also details the
allocation of budgets across various departments, highlighting the strategic decisions made
to optimize financial performance and resource utilization.
Budget Allocation and Revenue Contribution Analysis by Department
In this comprehensive analysis, we will explore the budget allocation across various
40%
departments and their corresponding revenue contributions. Each department plays a
S ales
crucial role in the overall financial health of the organization, and understanding these
dynamics is essential for strategic planning. To facilitate comparison, each chart will be
color-coded consistently, allowing for a clear visual representation of how funds are
distributed and how effectively each department contributes to the revenue stream. This
approach not only enhances clarity but also aids in identifying areas for improvement and
potential growth.
Marketing generated 3× ROI on campaign spend
S trong alignment between product investment and revenue performance
25%
35%
S upport
Product
Budget distribution reflects strategic prioritization of growth and innovation
20.
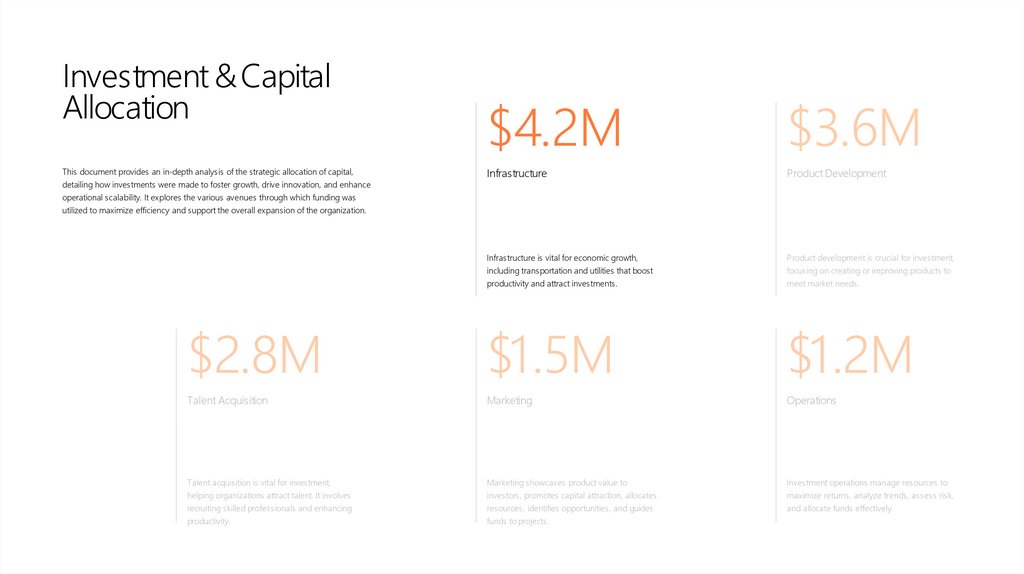
Investment & CapitalAllocation
$4.2M
$3.6M
Infrastructure
Product Development
Infrastructure is vital for economic growth,
Product development is crucial for investment,
including transportation and utilities that boost
focusing on creating or improving products to
productivity and attract investments.
meet market needs.
$2.8M
$1.5M
$1.2M
Talent Acquisition
Marketing
Operations
Talent acquisition is vital for investment,
Marketing showcases product value to
Investment operations manage resources to
helping organizations attract talent. It involves
investors, promotes capital attraction, allocates
maximize returns, analyze trends, assess risk,
recruiting skilled professionals and enhancing
resources, identifies opportunities, and guides
and allocate funds effectively.
productivity.
funds to projects.
This document provides an in-depth analysis of the strategic allocation of capital,
detailing how investments were made to foster growth, drive innovation, and enhance
operational scalability. It explores the various avenues through which funding was
utilized to maximize efficiency and support the overall expansion of the organization.
21.
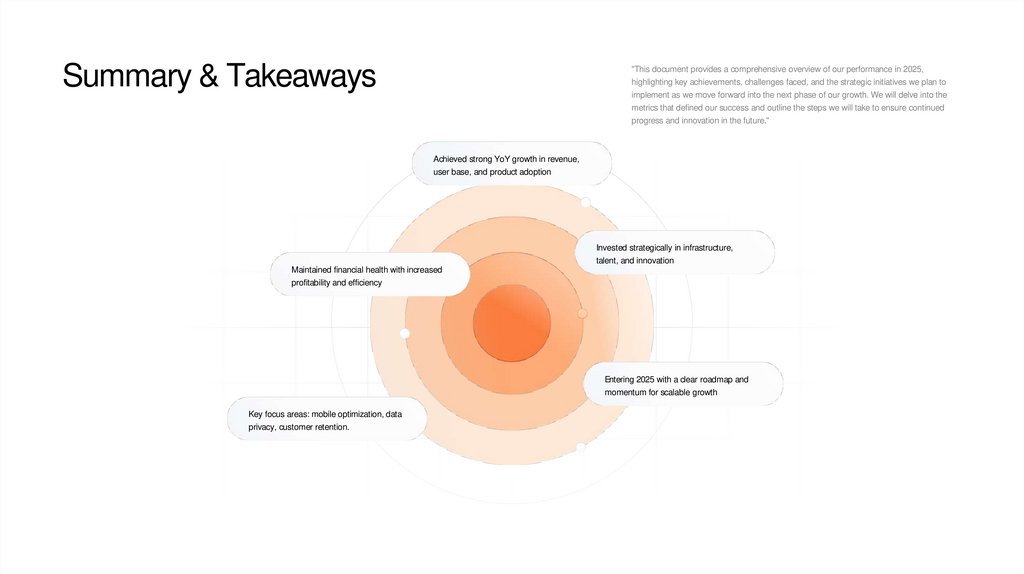
Summary & Takeaways"This document provides a comprehensive overview of our performance in 2025,
highlighting key achievements, challenges faced, and the strategic initiatives we plan to
implement as we move forward into the next phase of our growth. We will delve into the
metrics that defined our success and outline the steps we will take to ensure continued
progress and innovation in the future."
Achieved strong YoY growth in revenue,
user base, and product adoption
Invested strategically in infrastructure,
talent, and innovation
Maintained financial health with increased
profitability and efficiency
Entering 2025 with a clear roadmap and
momentum for scalable growth
Key focus areas: mobile optimization, data
privacy, customer retention.
22.
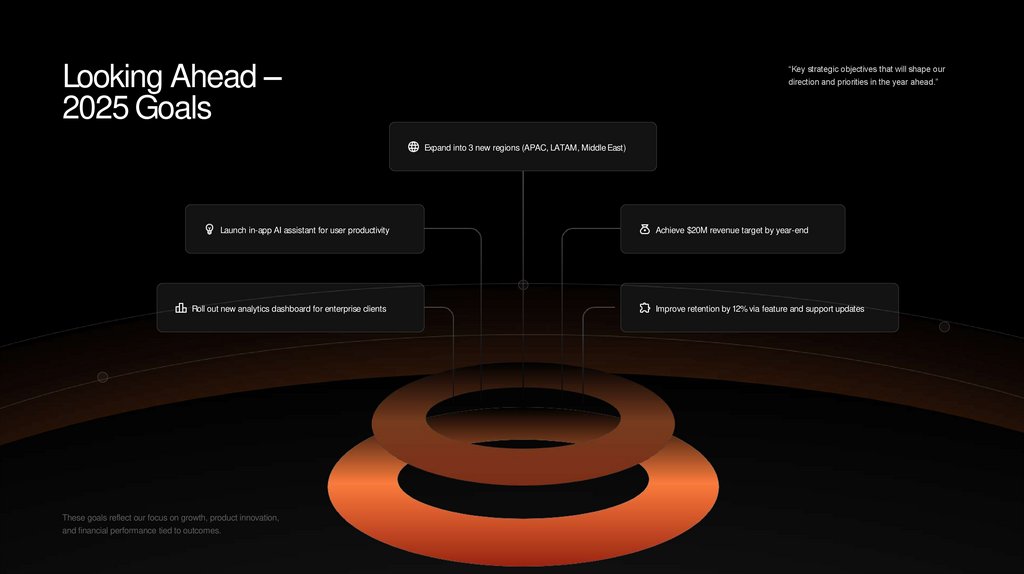
Looking Ahead –2025 Goals
“Key strategic objectives that will shape our
direction and priorities in the year ahead.”
Expand into 3 new regions (APAC, LATAM, Middle East)
Launch in-app AI assistant for user productivity
Roll out new analytics dashboard for enterprise clients
These goals reflect our focus on growth, product innovation,
and financial performance tied to outcomes.
Achieve $20M revenue target by year-end
Improve retention by 12% via feature and support updates
23.
With thanks, we raise our voice to all who stand by choice. Your faith,a guiding light, has shaped our path, made futures bright. In unity, we
find our way, together strong, come what may. Grateful hearts, we
sing this song for you, our partners!
“Your support made 2025 a year of growth, learning, and
impact. Here’s to an even brighter future together.”
24.
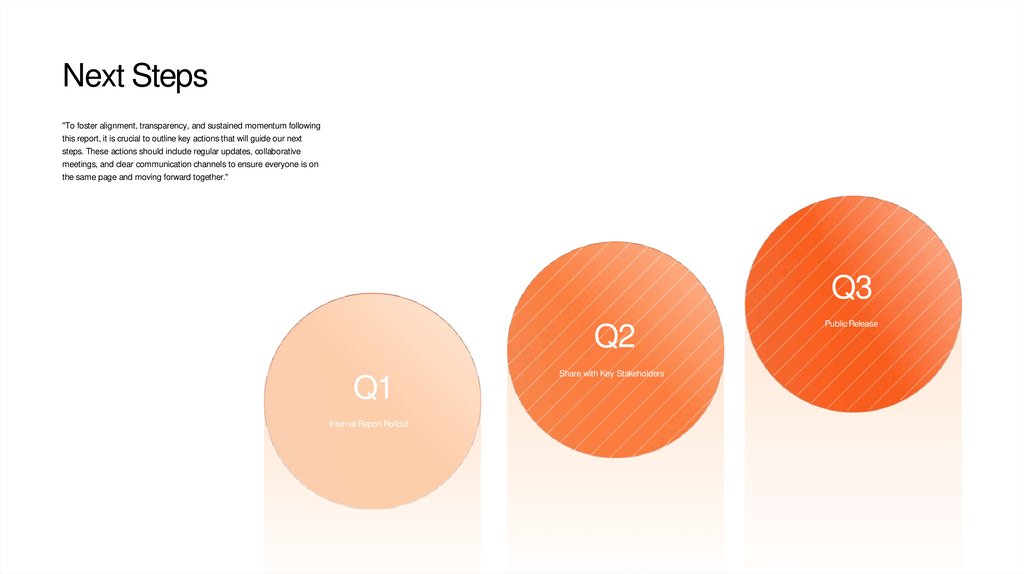
Next Steps"To foster alignment, transparency, and sustained momentum following
this report, it is crucial to outline key actions that will guide our next
steps. These actions should include regular updates, collaborative
meetings, and clear communication channels to ensure everyone is on
the same page and moving forward together."
Q3
Q2
Q1
Internal Report Rollout
Share with Key Stakeholders
Public Release
25.
Thank you for your continued support. Let’sbuild what’s next together.
Email: report@chihiro.com
Website: www.chihiro.com
Phone: +1 (666) 123-4567
HQ Address: 123 Business Ave, Raffles Place, Singapore