


 economics
Similar presentations:


")

")

Chapter Eighteen. Externalities, Open Access, and Public Goods
1.
ChapterEighteen
Externalities,
Open Access,
and Public Goods
2.
Externalities, Open Access, and PublicGoods
• In this chapter, we examine six main
topics
– Externalities
– The inefficiency of competition with
externalities
– Market structure and externalities
– Allocating property rights to reduce
externalities
– Open-access common property
– Public goods
© 2007 Pearson Addison-Wesley. All rights reserved.
3.
Externalities• Externality
– The direct effect of the actions of a
person or firm on another person’s wellbeing or a firm’s production capability
rather than an indirect effect through
changes in prices.
© 2007 Pearson Addison-Wesley. All rights reserved.
4.
Externalities• Externalities may either help or harm
others.
• An externality that harms someone is
called a negative externality.
• A positive externality benefits others.
© 2007 Pearson Addison-Wesley. All rights reserved.
5.
The inefficiency of competition withexternalities
• Competitive firms and consumers do
not have to pay for the harms of their
negative externalities, so they create
excessive amounts.
• Because producers are not
compensated for the benefits of a
positive externality, too little of such
externalities is produced.
© 2007 Pearson Addison-Wesley. All rights reserved.
6.
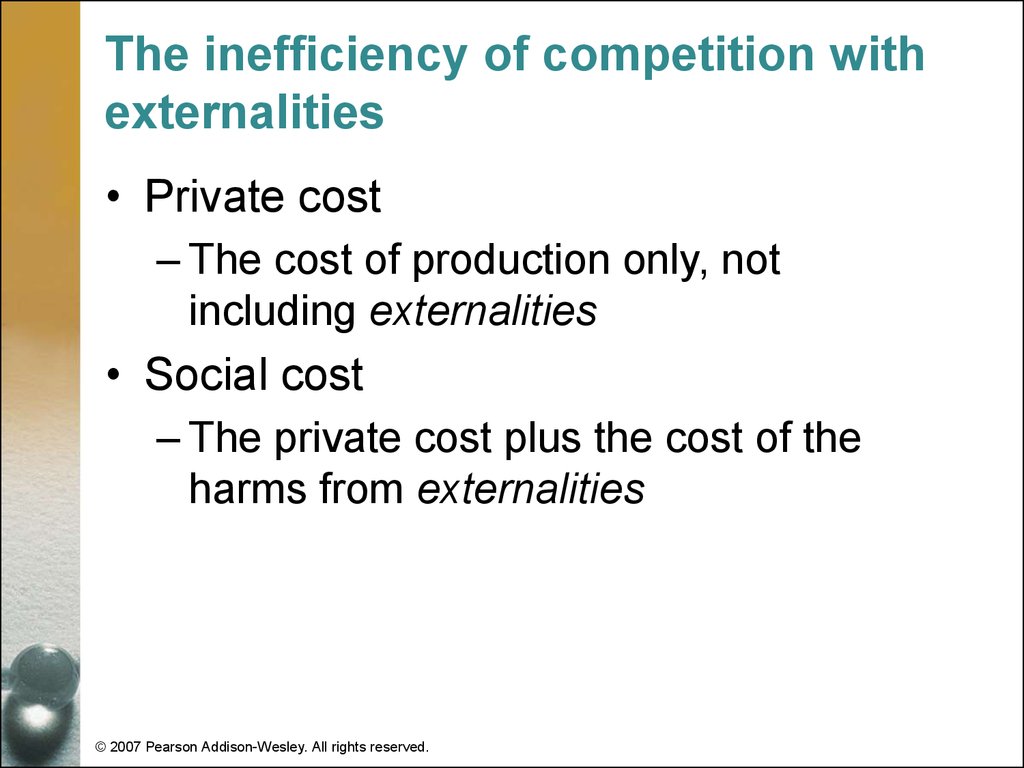
The inefficiency of competition withexternalities
• Private cost
– The cost of production only, not
including externalities
• Social cost
– The private cost plus the cost of the
harms from externalities
© 2007 Pearson Addison-Wesley. All rights reserved.
7.
Supply-and-Demand Analysis• We use a supply-and-demand diagram
to illustrate that a competitive market
produces excessive pollution because
the firms’ private cost is less than their
social cost.
© 2007 Pearson Addison-Wesley. All rights reserved.
8.
Figure 18.1 Welfare Effects ofPollution in a Competitive Market
• The competitive equilibrium, ec , is
determined by the intersection of the
demand curve and the competitive
supply or private marginal cost
curve, MC p , which ignores the cost of
pollution.
© 2007 Pearson Addison-Wesley. All rights reserved.
9.
Figure 18.1 Welfare Effects ofPollution in a Competitive Market
• The social optimum, es , is at the
intersection of the demand curve and
the social marginal cost curve,
MC s MC p MC g , where MC g is the
marginal cost of the pollution (gunk).
Private producer surplus is based on
curve, and social producer surplus is
s
MC
based on the
curve.
© 2007 Pearson Addison-Wesley. All rights reserved.
10.
Figure 18.1 Welfare Effects ofPollution in a Competitive Market
450
MC s = MC p + MC g
A
MC p
es
ps = 282
B
C D
H
pc = 240
198
F
84
E
G
ec
MC p
MC g
MC g
30
Demand
0
© 2007 Pearson Addison-Wesley. All rights reserved.
Qs = 84 Qc = 105
225
Q, Tons of paper per day
18–10
11.
Supply-and-Demand Analysis• The figure illustrates two main results
with respect to negative externalities.
• First, a competitive market produces
excessive negative externalities.
• Second, the optimal amount of pollution
is greater than zero.
© 2007 Pearson Addison-Wesley. All rights reserved.
12.
Reducing Externalities• Because competitive markets produce
too many negative externalities,
government intervention may provide a
social gain.
© 2007 Pearson Addison-Wesley. All rights reserved.
13.
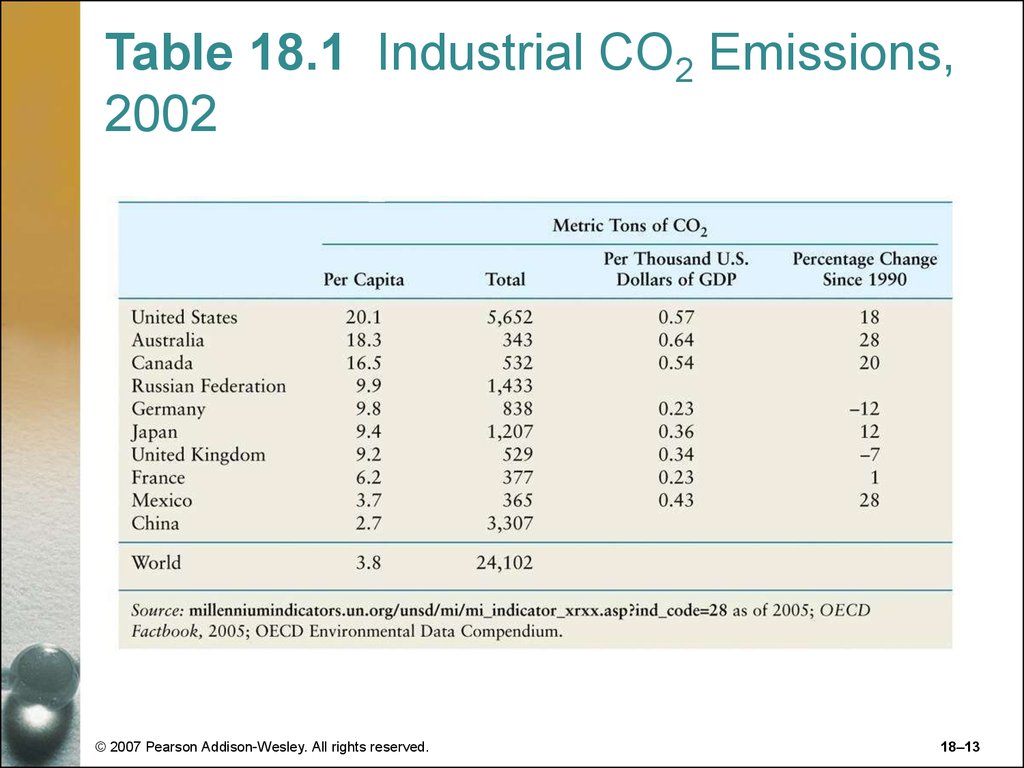
Table 18.1 Industrial CO2 Emissions,2002
© 2007 Pearson Addison-Wesley. All rights reserved.
18–13
14.
Reducing Externalities• If a government has sufficient
knowledge about pollution damage, the
demand curve, costs, and the
production technology, it can force a
competitive market to produce the
social optimum.
© 2007 Pearson Addison-Wesley. All rights reserved.
15.
Reducing Externalities• A governmental limit on the amount of
air or water pollution that may be
released is called an emission standard.
A tax on air pollution is called an
emissions fee, and a tax on discharges
into the air or waterways is an effluent
charge.
© 2007 Pearson Addison-Wesley. All rights reserved.
16.
Reducing Externalities• Internalize the externality
– To bear the cost of the harm that one
inflicts on others (or to capture the
benefit that one provides to others)
© 2007 Pearson Addison-Wesley. All rights reserved.
17.
Figure 18.2 Taxes to ControlPollution
• Placing a tax on the firms equal to the
g
harm the gunk, t (Q) MC , causes
them to internalize the externality, so
their private marginal cost is the same
s
as the social marginal cost, MC . As a
result, the competitive after-tax
equilibrium is the same as the social
optimum, es .
© 2007 Pearson Addison-Wesley. All rights reserved.
18.
Figure 18.2 Taxes to ControlPollution
• Alternatively, applying a specific tax of
$84 per ton of paper, which is the
marginal harm from the gunk at Qs 84 ,
also results in the social optimum.
© 2007 Pearson Addison-Wesley. All rights reserved.
19.
Figure 18.2 Taxes to ControlPollution
450
MC s = MC p + t (Q)
MC p +
es
ps = 282
MC p
= 84
MC p
= 198
MC g
MC g = 84
Demand
0
Qs = 84
© 2007 Pearson Addison-Wesley. All rights reserved.
225
Q, Tons of paper per day
18–19
20.
Cost-Benefit Analysis• By using a cost-benefit analysis, we
obtain another interpretation of the
pollution problem in terms of the
marginal cost and benefit of the
pollution itself.
© 2007 Pearson Addison-Wesley. All rights reserved.
21.
Cost-Benefit Analysis• Welfare is maximized by reducing
output and pollution until the marginal
benefit from less pollution equals the
marginal cost of less output.
© 2007 Pearson Addison-Wesley. All rights reserved.
22.
Figure 18.3 Cost-Benefit Analysisof Pollution
a) The benefit curve reflects the reduction in
harm from pollution as the amount of gunk
falls from the competitive level. The cost of
reducing the amount of gunk is the fall in
output, which reduces consumer surplus
and private producer surplus. Welfare is
maximized at 84 tons of paper and 84 units
of gunk, the quantities at which the
difference between the benefit and cost
curves, the net benefit, is greatest.
© 2007 Pearson Addison-Wesley. All rights reserved.
23.
Figure 18.3 Cost-Benefit Analysisof Pollution
b) The net benefit is maximized where
the marginal benefit, MB , which is the
slope of the benefit curve, equals the
marginal cost, MC , the slope of the
cost curve.
© 2007 Pearson Addison-Wesley. All rights reserved.
24.
Figure 18.3Cost-Benefit
Analysis
of Pollution
(a) Cost and Benefit
Cost: less paper
4,000
Benefit: less gunk
2,000
0
105
Maximum
net
benefit
84
63
(b) Marginal Cost and Marginal Benefit
Q, Tons of paper per day
G, Units of gunk per day
MC
105
84
MB
0
105
© 2007 Pearson Addison-Wesley. All rights reserved.
84
Q, Tons of paper per day
G, Units of gunk per day
18–24
25.
Market Structure and Externalities• Two of our main results concerning
competitive markets and negative
externalities—that too much pollution is
produced and that a tax equal to the
marginal social cost of the externality
solves the problem—do not hold for
other market structures.
© 2007 Pearson Addison-Wesley. All rights reserved.
26.
Monopoly and Externalities• Although the competitive market with an
externality always produces more
output than the social optimum, a
monopoly may produce more than, the
same as, or less than the social
optimum.
© 2007 Pearson Addison-Wesley. All rights reserved.
27.
Monopoly and Externalities• Which effect dominates depends on the
elasticity of demand for the output and
on the extent of the marginal damage
the pollution causes.
© 2007 Pearson Addison-Wesley. All rights reserved.
28.
Monopoly Versus Competitive Welfarewith Externalities
• In the absence of externalities, welfare
is greater under competition than under
an unregulated monopoly.
• However, with an externality, welfare
may be greater with monopoly than with
competition.
© 2007 Pearson Addison-Wesley. All rights reserved.
29.
Figure 18.4 Monopoly, Competition,and Social Optimum with Pollution
• At the competitive equilibrium, ec , more
is produced than at the social
optimum, es . As a result, the deadweight
loss in the competitive market is D . The
monopoly equilibrium, em , is determined
by the intersection of the marginal
revenue and the private marginal
p
cost, MC , curves.
© 2007 Pearson Addison-Wesley. All rights reserved.
30.
Figure 18.4 Monopoly, Competition,and Social Optimum with Pollution
• The social welfare (based on the
s
marginal social cost, MC , curve) under
monopoly is A B. Here the deadweight
loss of monopoly, C , is less than the
deadweight loss under competition, D .
© 2007 Pearson Addison-Wesley. All rights reserved.
31.
Figure 18.4 Monopoly, Competition,and Social Optimum with Pollution
450
MC s = MC p + MC g
et
330
310
282
em
es
A
B
MC p
D
C
ec
240
MC g
30
MR
0
60 70
© 2007 Pearson Addison-Wesley. All rights reserved.
84
105
Demand
225
Q, Tons of paper per day
18–31
32.
Taxing Externalities in NoncompetitiveMarkets
• Trying to solve a negative externality
problem is more complex in a
noncompetitive market than in a
competitive market.
© 2007 Pearson Addison-Wesley. All rights reserved.
33.
Taxing Externalities in NoncompetitiveMarkets
• To achieve a social optimum in a
competitive market, the government
only has to reduce the externality,
possibly by decreasing output.
• In a noncompetitive market, the
government must eliminate problems
arising from both externalities and the
exercise of market power.
© 2007 Pearson Addison-Wesley. All rights reserved.
34.
Allocating Property Rights to ReduceExternalities
• Instead of controlling externalities
directly through emissions fees and
emissions standards, the government
may take an indirect approach by
assigning a property right: an
exclusive privilege to use an asset.
© 2007 Pearson Addison-Wesley. All rights reserved.
35.
Allocating Property Rights to ReduceExternalities
• If no one holds a property right for a
good or a bad, the good or bad is
unlikely to have a price.
© 2007 Pearson Addison-Wesley. All rights reserved.
36.
Allocating Property Rights to ReduceExternalities
• For many bads, such as pollution, and
for some goods, property rights are not
clearly defined. No one has exclusive
property rights to the sir we breathe.
Because of this lack of a price, a
polluter’s private marginal cost of
production is less than the full social
marginal cost.
© 2007 Pearson Addison-Wesley. All rights reserved.
37.
Coase Theorem• According to the Coase Theorem
(Coase, 1960), the optimal levels of
pollution and output can result from
bargaining between polluters and their
victims if property rights are clearly
defined.
© 2007 Pearson Addison-Wesley. All rights reserved.
38.
Table 18.2 (a,b) Property Rights andBargaining
© 2007 Pearson Addison-Wesley. All rights reserved.
18–38
39.
Table 18.2 (c) Property Rights andBargaining
© 2007 Pearson Addison-Wesley. All rights reserved.
18–39
40.
Coase TheoremIf there are no impediments to
bargaining, assigning property rights
results in the efficient outcome at which
joint profits are maximized.
Efficiency is achieved regardless of who
receives the property rights.
© 2007 Pearson Addison-Wesley. All rights reserved.
41.
Coase TheoremWho gets the property rights affects the
income distribution. The property rights
are valuable. The party with the
property rights may be compensated by
the other party.
© 2007 Pearson Addison-Wesley. All rights reserved.
42.
Problems with the Coase Approach• First, if transaction costs are very high,
it might not pay for the two sides to
meet.
• Second, if firms engage in strategic
bargaining behavior, an agreement may
not be reached.
• Third, if either side lacks information
about the costs or benefits or reducing
pollution, a nonefficient outcome may
occur.
© 2007 Pearson Addison-Wesley. All rights reserved.
43.
Markets for Pollution• If high transaction costs preclude
bargaining, we may be able to
overcome this problem by using a
market, which facilitates exchanges
between individuals.
© 2007 Pearson Addison-Wesley. All rights reserved.
44.
Markets for Pollution• Under this cap and trade system, the
government gives firms permits, each of
which confers the right to create a
certain amount of pollution. Each firm
may use its permits or sell them to other
firms.
© 2007 Pearson Addison-Wesley. All rights reserved.
45.
Markets for Pollution• Bu using a market, the government
does not have to collect this type of
detailed information to achieve
efficiency. Its only decision concerns
what total amount of pollution to allow.
© 2007 Pearson Addison-Wesley. All rights reserved.
46.
Open-Access Common Property• Open-Access Common Property
– Resources to which everyone has free
access
© 2007 Pearson Addison-Wesley. All rights reserved.
47.
Overuse of Open-Access CommonProperty
Because people do not have to pay to
use open-access common property
resources, they are overused.
e.g. 1. Common Pools.
2. The Internet.
3. Roads
4. Fisheries.
© 2007 Pearson Addison-Wesley. All rights reserved.
48.
Solving the Commons Problem• Government Regulation of Commons
– Overuse of a common resource occurs
because individuals do not bear the full
social cost. However, by applying a tax
or fee equal to the externality harm that
each individual imposes on others, a
government forces each person to
internalize the externality.
© 2007 Pearson Addison-Wesley. All rights reserved.
49.
Solving the Commons Problem• Government Regulation of Commons
– Alternatively, the government can
restrict access to the commons. One
typical approach is to grant access on a
first-come, first-served basis.
© 2007 Pearson Addison-Wesley. All rights reserved.
50.
Solving the Commons Problem• Assigning Property Rights
– An alternative approach to resolving the
commons problem is to assign private
property rights.
© 2007 Pearson Addison-Wesley. All rights reserved.
51.
Public Goods• Public Good
– A commodity or service whose
consumption by one person does not
preclude others from also consuming it
© 2007 Pearson Addison-Wesley. All rights reserved.
52.
Types of GoodsTable 18.3 Rivalry and Exclusion
© 2007 Pearson Addison-Wesley. All rights reserved.
18–52
53.
Markets for Public Goods• Markets for public goods exist only if
nonpurchasers can be excluded from
consuming them.
• Markets do not exist for nonexclusive
public goods.
• If the government does not provide a
nonexclusive public good, no one
provides it.
© 2007 Pearson Addison-Wesley. All rights reserved.
54.
Demand for Public Goods• Because a public good lacks rivalry,
many people can get pleasure from the
same unit of output. As a consequence,
the social demand curve or willingnessto-pay curve for a public good is the
vertical sum of the demand curves of
each individual.
© 2007 Pearson Addison-Wesley. All rights reserved.
55.
Figure 18.5 Inadequate Provision ofa Public Good
• Security guards protect both tenants of
the mall. If each guard costs $10 per
hour, the television store, with
demand D1, is willing to hire four guards
per hour. The ice-cream parlor, with
2
D
demand , is not willing to hire any
guards.
© 2007 Pearson Addison-Wesley. All rights reserved.
56.
Figure 18.5 Inadequate Provision ofa Public Good
• Thus if everyone acts independently,
the equilibrium is e p . The social
demand for this public good is the
vertical sum of the individual demand
curves, D . Thus the social optimum is es,
at which five guards are hired.
© 2007 Pearson Addison-Wesley. All rights reserved.
57.
Figure 18.5 Inadequate Provision ofa Public Good
25
D
18
D1
13
ep
es
Supply, MC
10
8
7
D2
3
2
0
© 2007 Pearson Addison-Wesley. All rights reserved.
4
5
7
9
Guards per hour
18–57
58.
Free Riding• Many people are unwilling to pay for
their share of a public good. They try to
get others to pay for it, so they can free
ride: benefit from the actions of others
without paying.
© 2007 Pearson Addison-Wesley. All rights reserved.
59.
Table 18.4 Private Payments for aPublic Good
© 2007 Pearson Addison-Wesley. All rights reserved.
18–59
60.
Free Riding• In each of these games, the Nash
equilibrium is for neither store to hire a
guard because of free riding. The
nonoptimal outcome occurs for the
same reason as in other prisoners’
dilemma games: The stores don’t do
what is best for them collectively when
they act independently.
© 2007 Pearson Addison-Wesley. All rights reserved.
61.
Reducing Free Riding• Governmental or other collective actions
can reduce free riding.
• Methods that may be used include
social pressure, merges, compulsion,
and privatization.
© 2007 Pearson Addison-Wesley. All rights reserved.
62.
Valuing Public Goods• To ensure that a nonexclusive public
good is provided, a government usually
produces it or compels others to do so.
Issues that a government faces in
providing such a public good include
whether to provide it at all and, if so,
how much to provide.
© 2007 Pearson Addison-Wesley. All rights reserved.
63.
Table 18.5 Voting on $300 Traffic Signals© 2007 Pearson Addison-Wesley. All rights reserved.
18–63
64.
Valuing Public Goods• The problem with yes-no votes is that
they ignore the intensity of preferences.
• Thus such majority voting fails to value
the public good fully and hence does
not guarantee that it is efficiently
provided.
© 2007 Pearson Addison-Wesley. All rights reserved.