
 industry
Similar presentations:


")


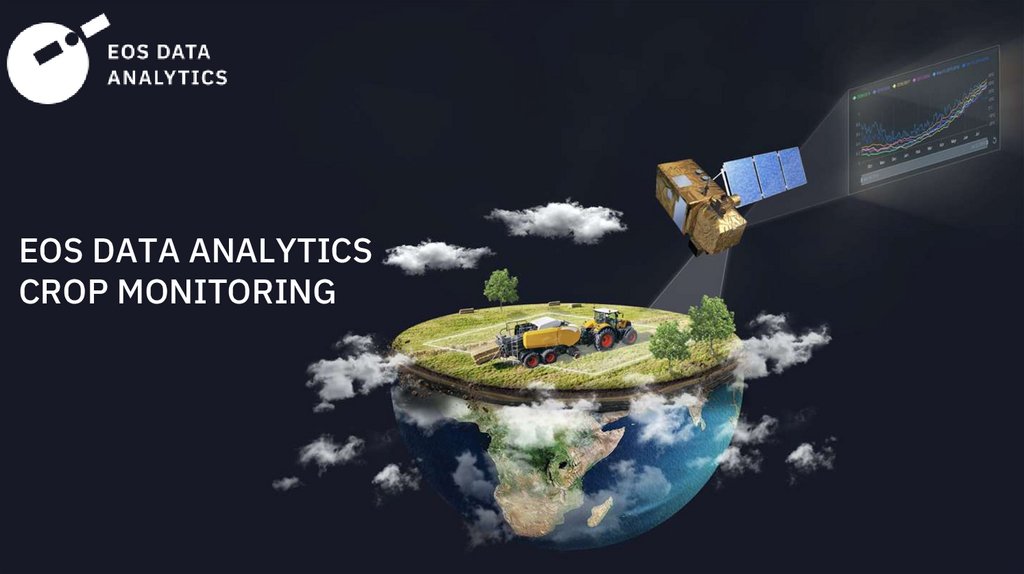
Eos data analytics. Crop monitoring
1.
EOS DATA ANALYTICSCROP MONITORING
2.
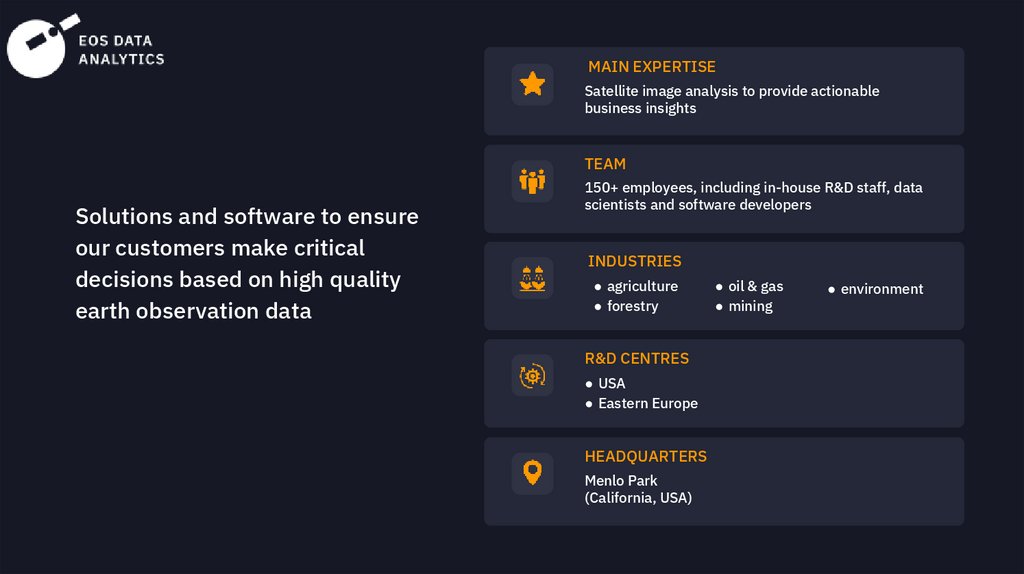
MAIN EXPERTISESatellite image analysis to provide actionable
business insights
TEAM
Solutions and software to ensure
our customers make critical
decisions based on high quality
earth observation data
150+ employees, including in-house R&D staff, data
scientists and software developers
INDUSTRIES
● agriculture
● forestry
R&D CENTRES
● USA
● Eastern Europe
HEADQUARTERS
Menlo Park
(California, USA)
● oil & gas
● mining
● environment
3.
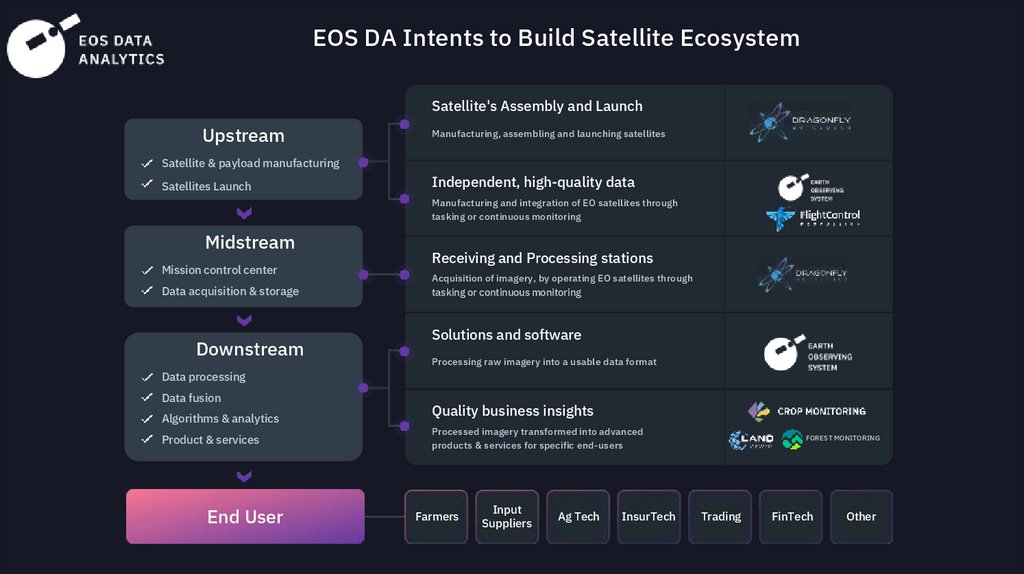
EOS DA Intents to Build Satellite EcosystemSatellite's Assembly and Launch
Upstream
Manufacturing, assembling and launching satellites
Satellite & payload manufacturing
Satellites Launch
Independent, high-quality data
Manufacturing and integration of EO satellites through
tasking or continuous monitoring
Midstream
Mission control center
Data acquisition & storage
Downstream
Receiving and Processing stations
Acquisition of imagery, by operating EO satellites through
tasking or continuous monitoring
Solutions and software
Processing raw imagery into a usable data format
Data processing
Data fusion
Algorithms & analytics
Product & services
End User
Quality business insights
Processed imagery transformed into advanced
products & services for specific end-users
Farmers
Input
Suppliers
Ag Tech
InsurTech
FOREST MONITORING
Trading
FinTech
Other
4.
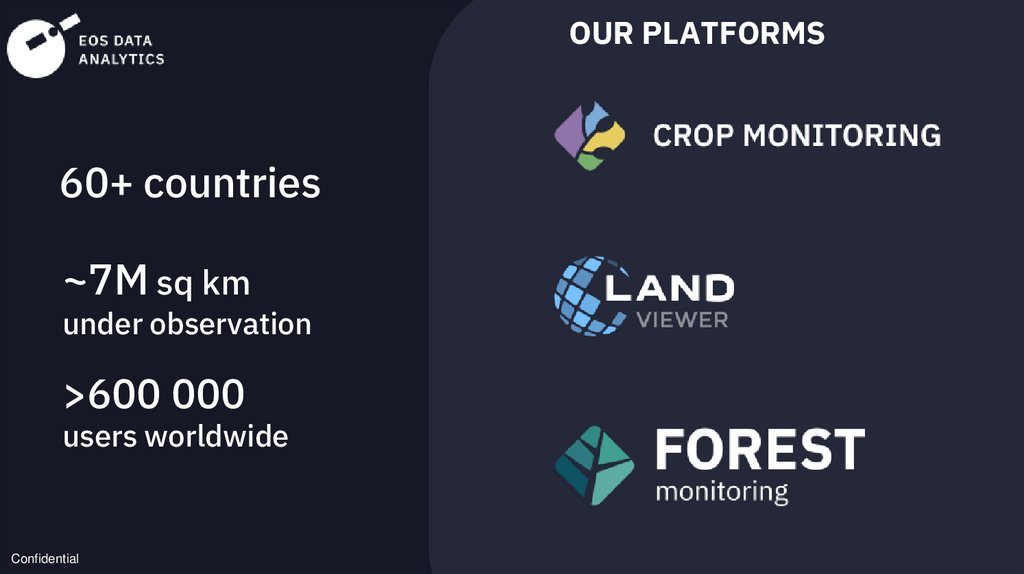
OUR PLATFORMS60+ countries
~7M sq km
under observation
>600 000
users worldwide
Confidential
5.
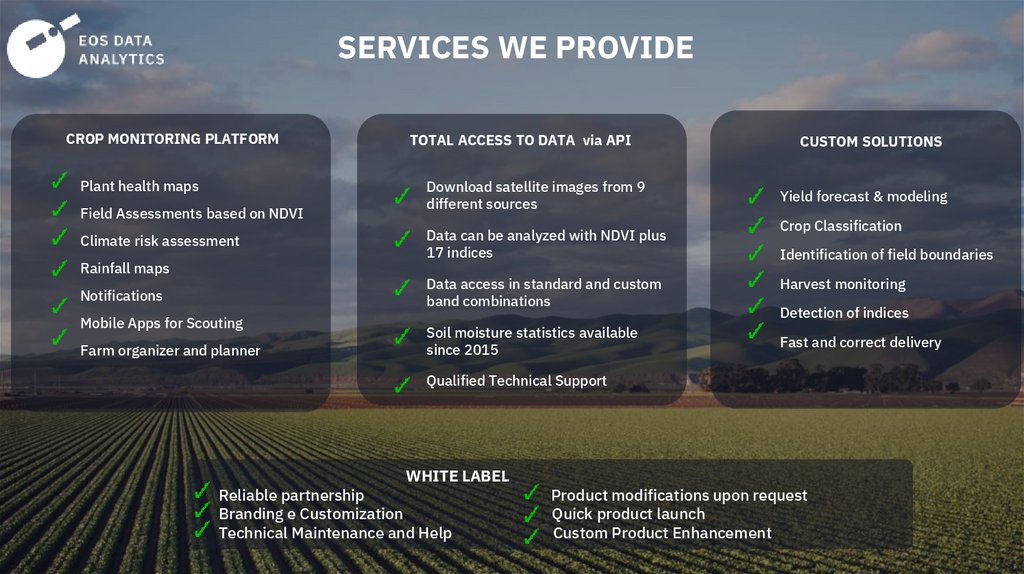
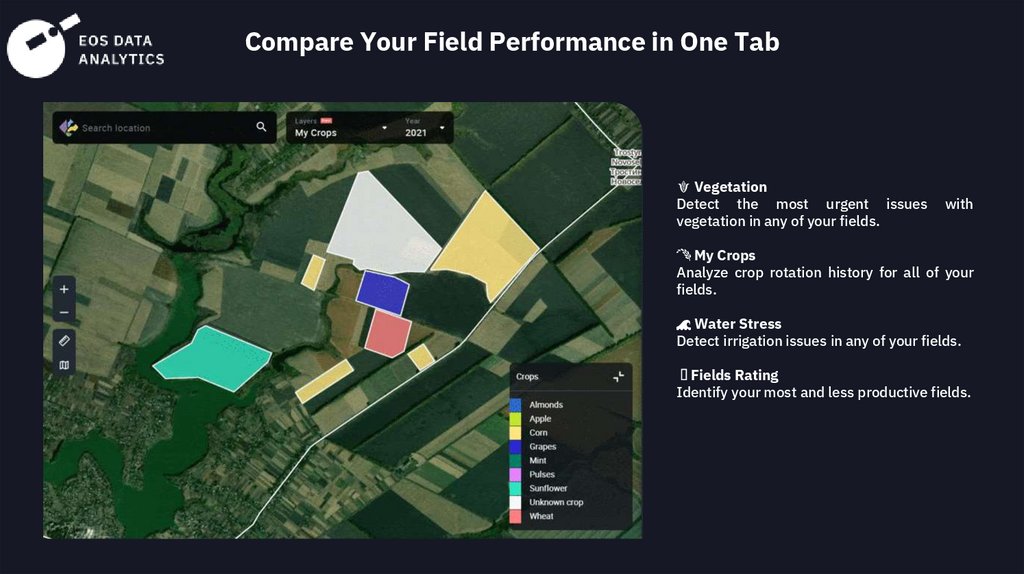
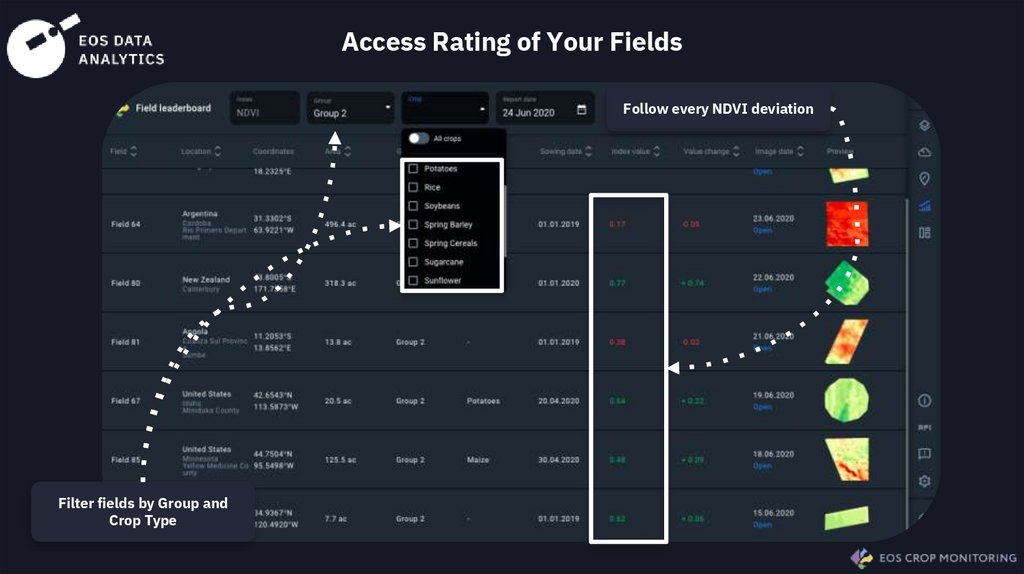
SERVICES WE PROVIDECROP MONITORING PLATFORM
Plant health maps
Field Assessments based on NDVI
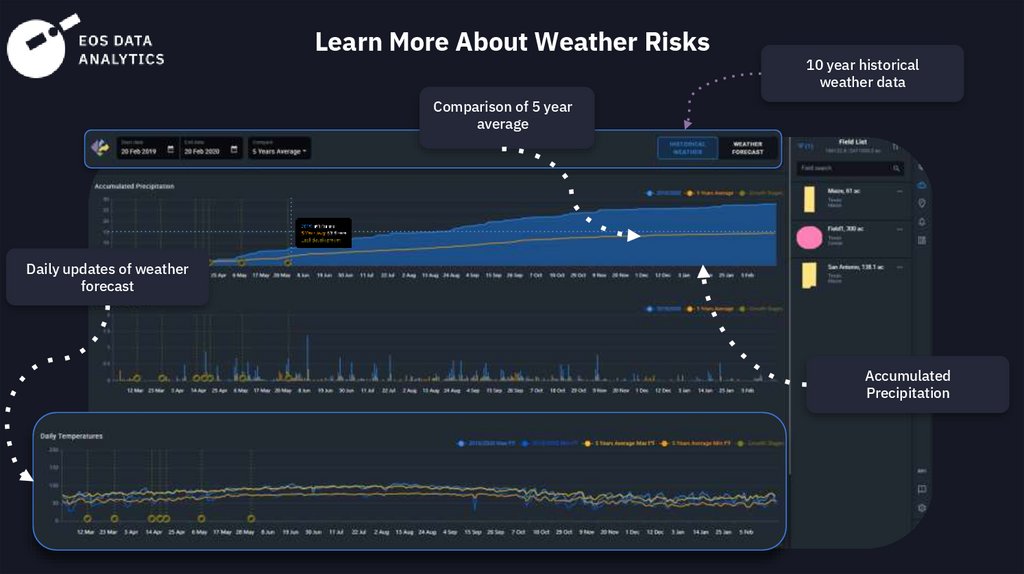
Climate risk assessment
Rainfall maps
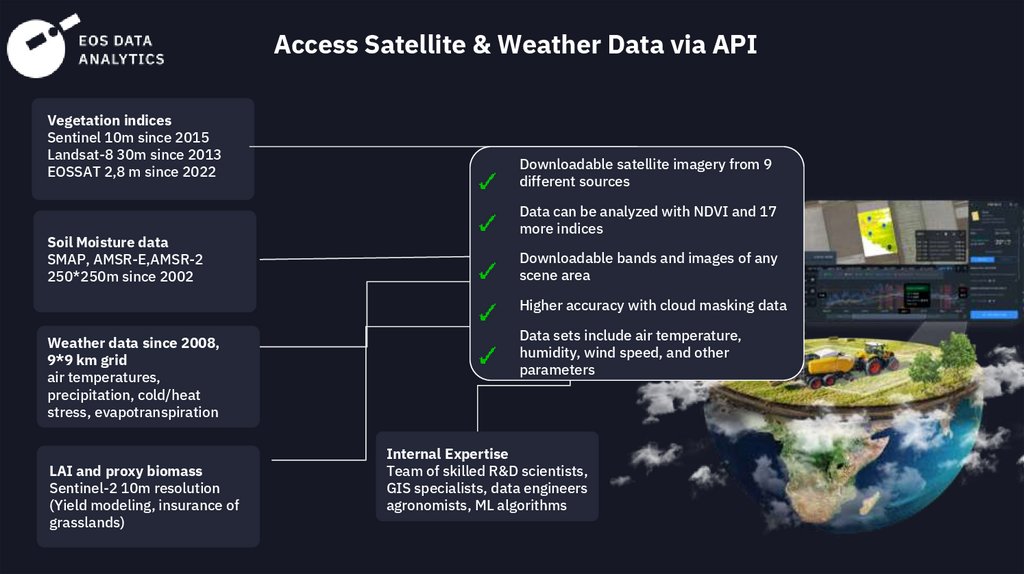
TOTAL ACCESS TO DATA via API
Download satellite images from 9
different sources
Data can be analyzed with NDVI plus
17 indices
Data access in standard and custom
band combinations
Notifications
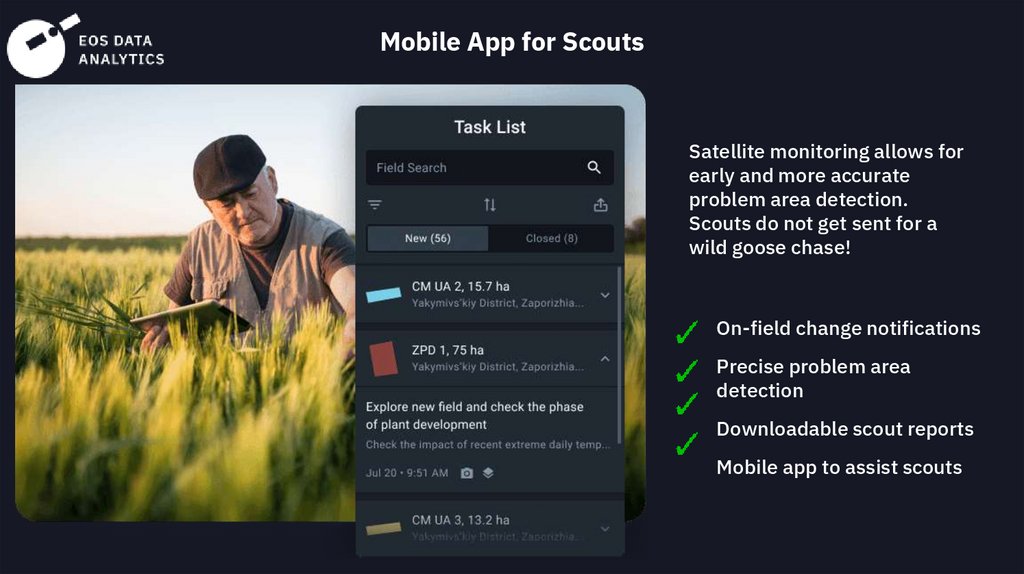
Mobile Apps for Scouting
Farm organizer and planner
Soil moisture statistics available
since 2015
CUSTOM SOLUTIONS
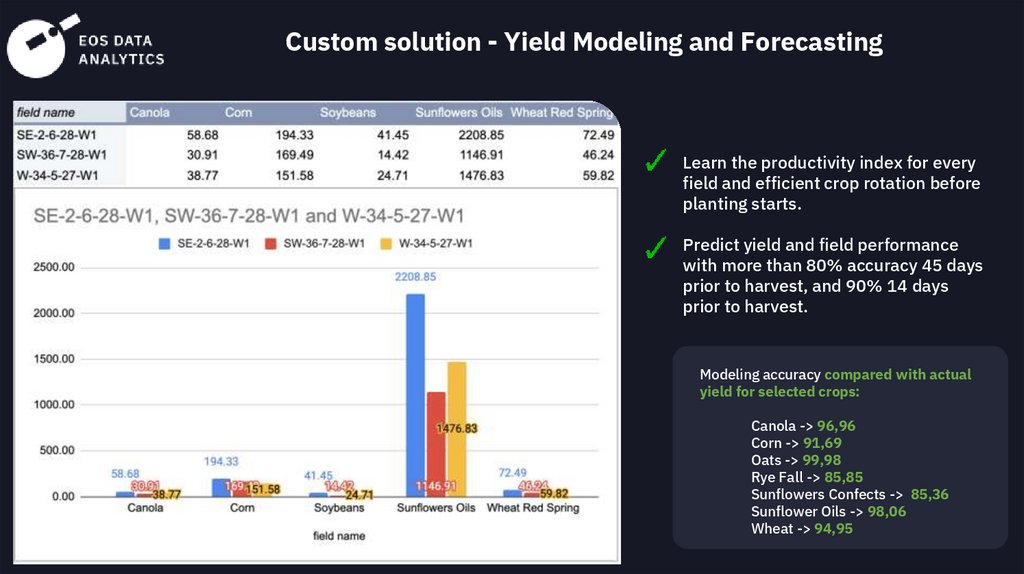
Yield forecast & modeling
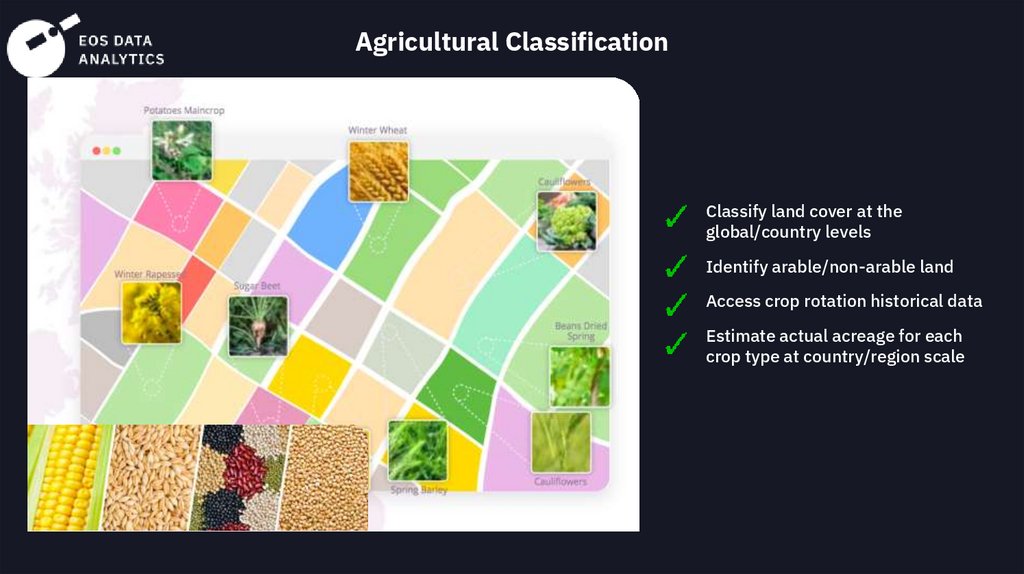
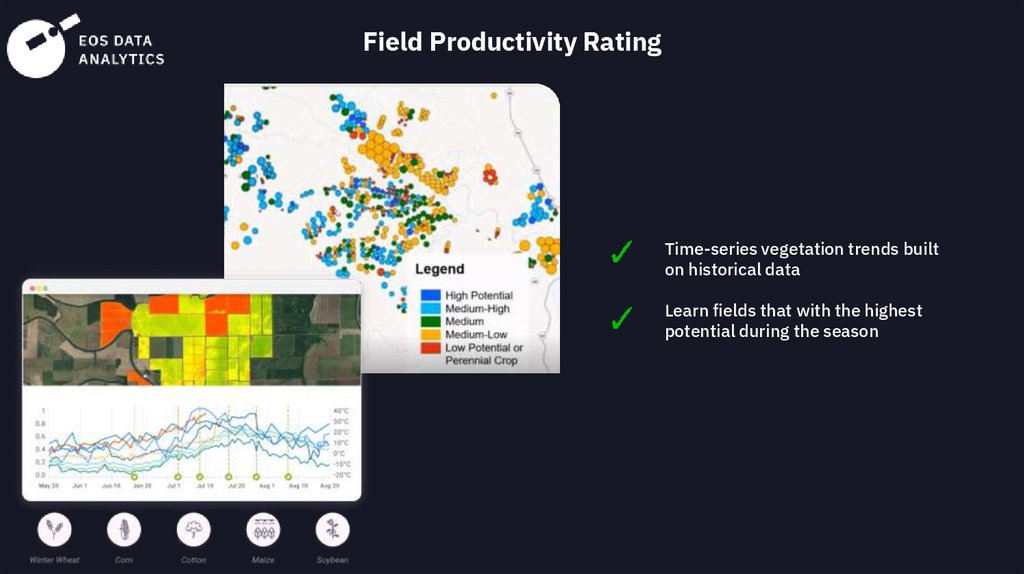
Crop Classification
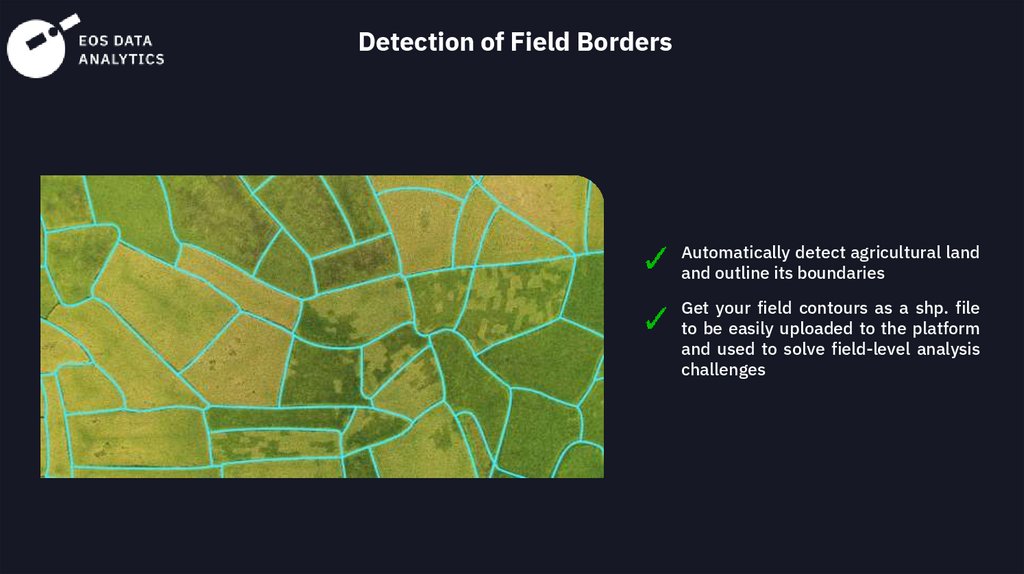
Identification of field boundaries
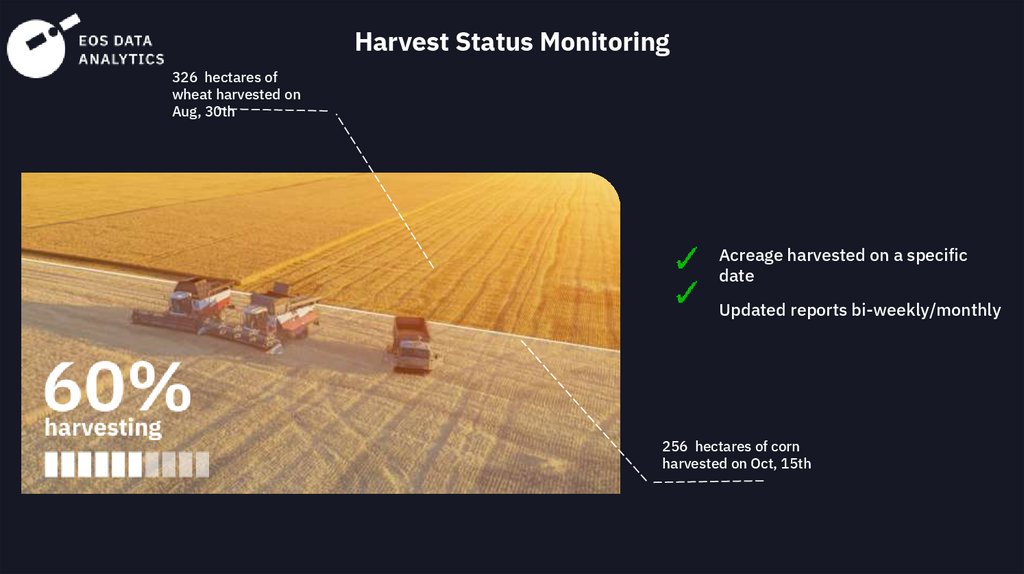
Harvest monitoring
Detection of indices
Fast and correct delivery
Qualified Technical Support
WHITE LABEL
Reliable partnership
Branding e Customization
Technical Maintenance and Help
Product modifications upon request
Quick product launch
Custom Product Enhancement
6.
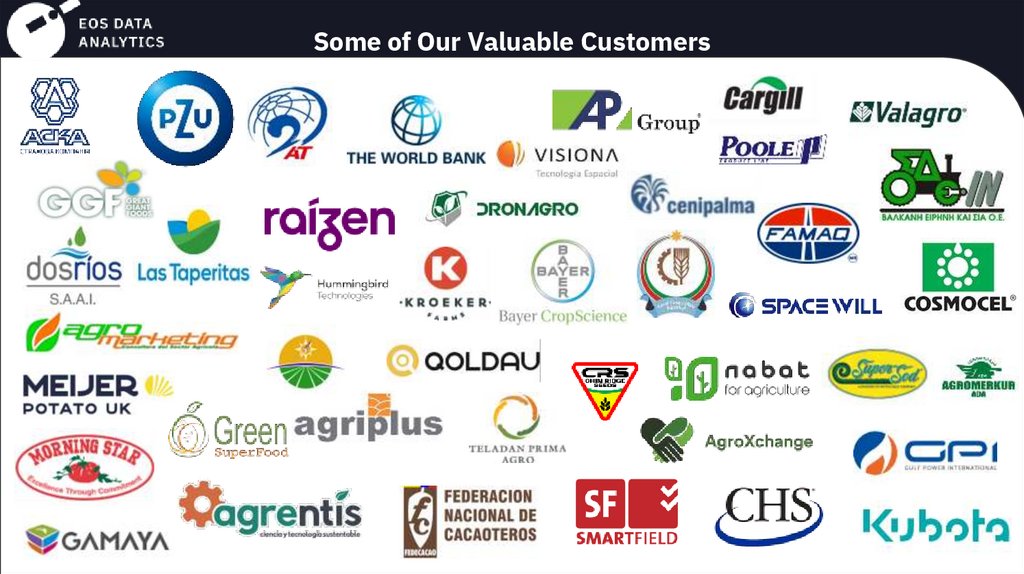
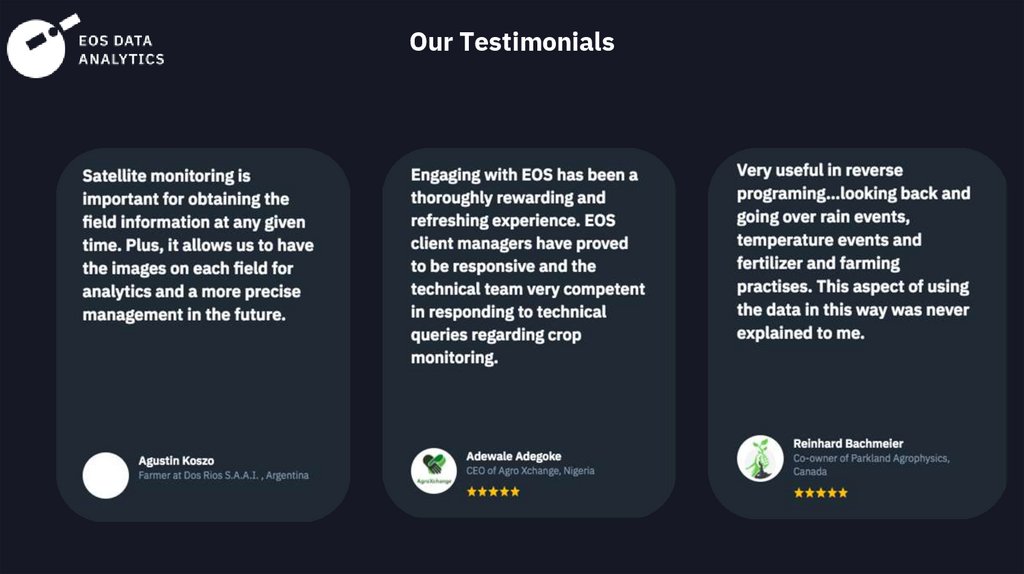
Some of Our Valuable CustomersExperiencia científica
7.
INSIDE SATELLITECROP MONITORING
PLATFORM
8.
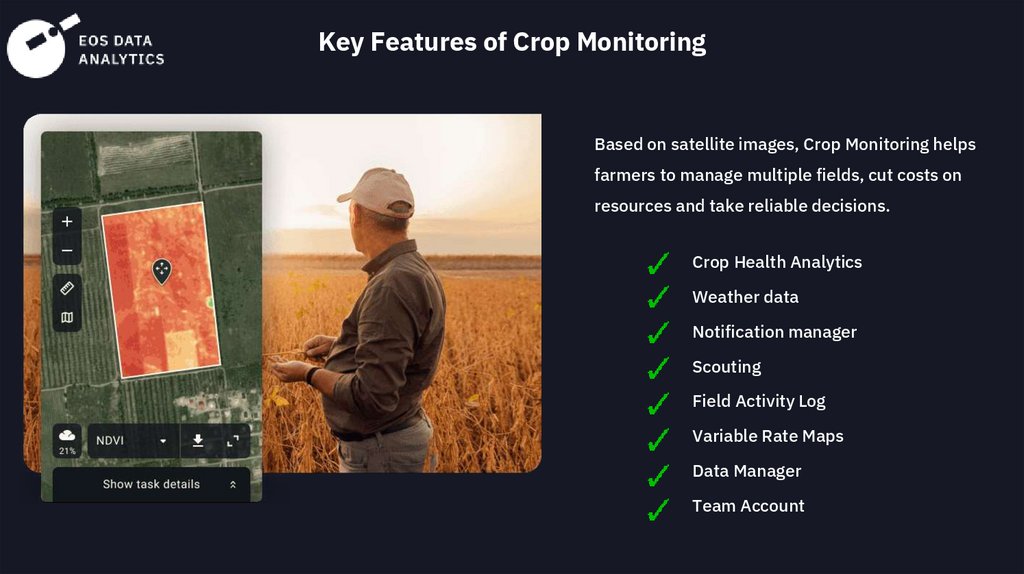
Key Features of Crop MonitoringBased on satellite images, Crop Monitoring helps
farmers to manage multiple fields, cut costs on
resources and take reliable decisions.
Crop Health Analytics
Weather data
Notification manager
Scouting
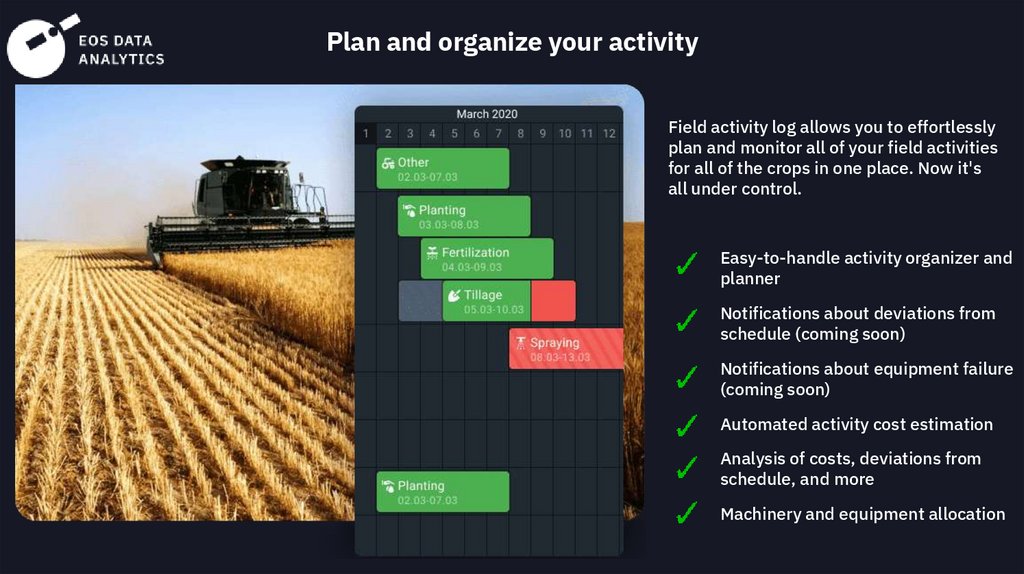
Field Activity Log
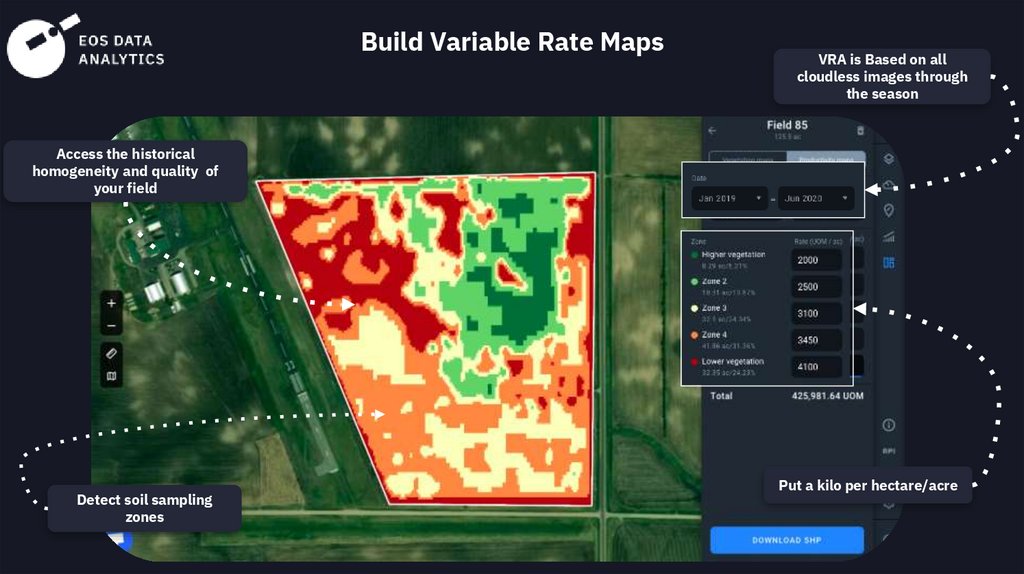
Variable Rate Maps
Data Manager
Team Account
9.
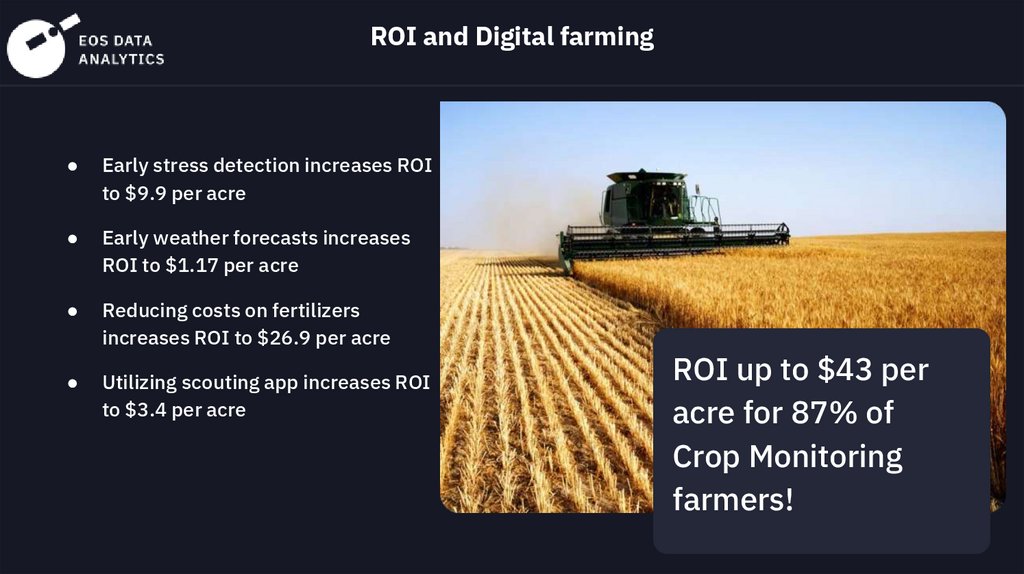
ROI and Digital farmingEarly stress detection increases ROI
to $9.9 per acre
Early weather forecasts increases
ROI to $1.17 per acre
Reducing costs on fertilizers
increases ROI to $26.9 per acre
Utilizing scouting app increases ROI
to $3.4 per acre
ROI up to $43 per
acre for 87% of
Crop Monitoring
farmers!
10.
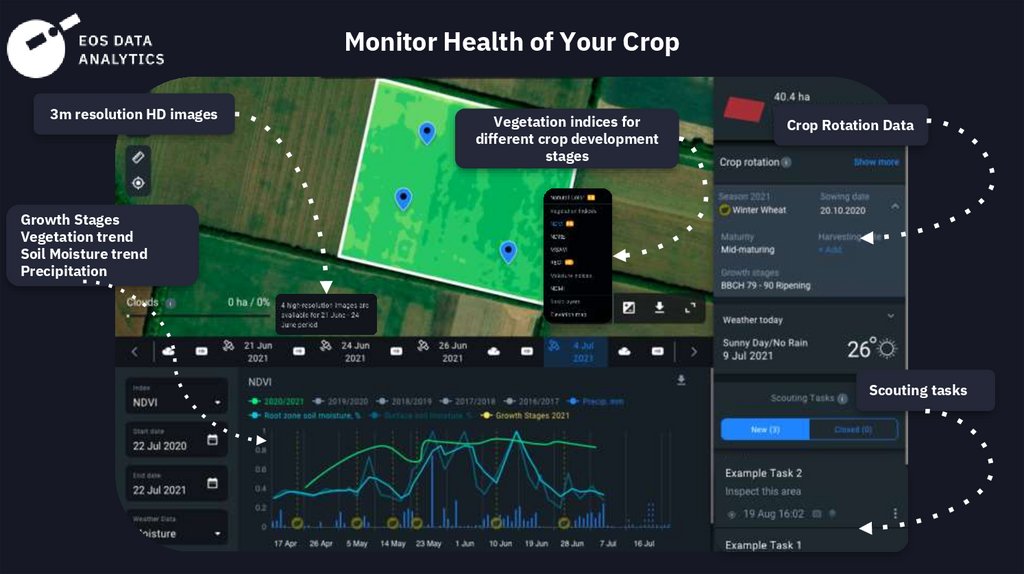
Monitor Health of Your Crop3m resolution HD images
Vegetation indices for
different crop development
stages
Crop Rotation Data
Growth Stages
Vegetation trend
Soil Moisture trend
Precipitation
Scouting tasks
11.
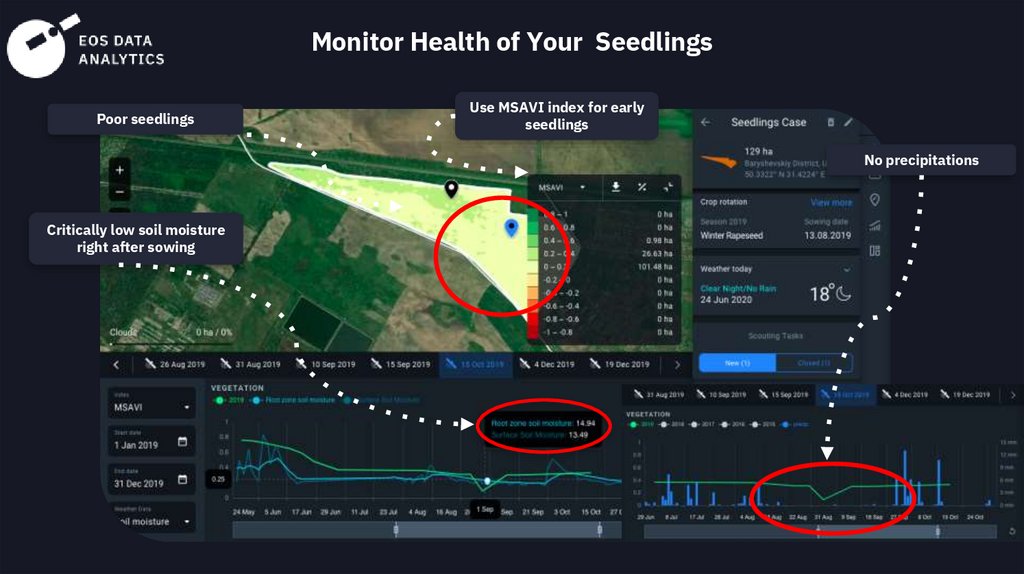
Monitor Health of Your SeedlingsPoor seedlings
Use MSAVI index for early
seedlings
No precipitations
Critically low soil moisture
right after sowing