


 biology
Similar presentations:


Medical Depression Treatment Breakthrough
1.
MedicalDepression
Treatment
Breakthrough
Here is where your presentation begins
2.
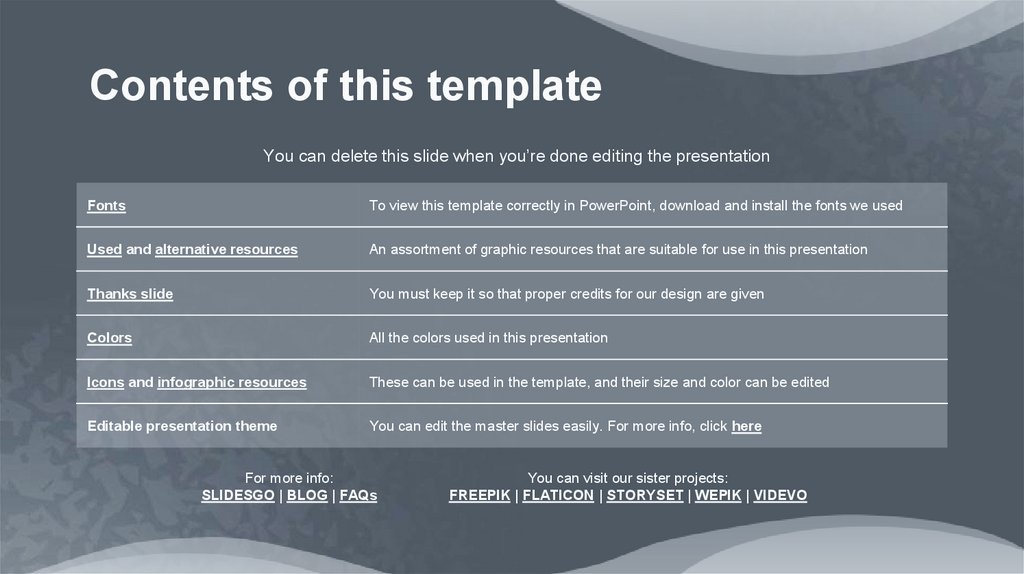
Contents of this templateYou can delete this slide when you’re done editing the presentation
Fonts
To view this template correctly in PowerPoint, download and install the fonts we used
Used and alternative resources
An assortment of graphic resources that are suitable for use in this presentation
Thanks slide
You must keep it so that proper credits for our design are given
Colors
All the colors used in this presentation
Icons and infographic resources
These can be used in the template, and their size and color can be edited
Editable presentation theme
You can edit the master slides easily. For more info, click here
For more info:
SLIDESGO | BLOG | FAQs
You can visit our sister projects:
FREEPIK | FLATICON | STORYSET | WEPIK | VIDEVO
3.
Table of contents01
02
03
Introduction
Background
Methodology
04
05
06
Results
Discussion
Conclusion
4.
01Introduction
5.
What is a medicalbreakthrough?
A medical breakthrough:
Represents a significant advancement in the field of
medicine
Challenges conventional medical practices
and beliefs
Holds the potential to revolutionize treatments, improve
patient outcomes and save lives
In summary, a medical breakthrough can revolutionize medical
care and improve patient lives
6.
IntroductionProblem statement
Context
Clearly state the specific problem or
challenge in the medical field.
Emphasize its significance and
impact, highlighting gaps or
limitations in current knowledge or
approaches that motivate the need
for a breakthrough
Provide context and emphasize the
importance of addressing the
identified challenge. Discuss existing
knowledge or approaches,
emphasizing the gaps or limitations
that hinder progress and drive the
need for innovative solutions
7.
BackgroundCurrent landscape
Highlight the current challenges and limitations in the medical field
that require a breakthrough. Describe the healthcare problems,
diseases or conditions that need innovative solutions
Breakthrough vision
Outline a visionary goal for the breakthrough, such as curing a
disease or revolutionizing procedures. Highlight the broader impact
on healthcare and global quality of life
Emerging trends
Focus on emerging medical trends, technologies, or scientific
discoveries that present an opportunity for a breakthrough. Discuss
the potential benefits, such as more accurate diagnostics or
preventive measures
8.
MethodologyStudy design
Data collection
Outline the research design for the medical
breakthrough. Describe the type of study,
sample size, inclusion criteria and ethical
considerations
Explain the methods and tools used for data
collection, including patient records or
examinations. Emphasize data accuracy and
patient privacy
Data analysis
Results validation
Describe the approach for analyzing the
collected data. Explain the statistical methods
or qualitative analysis techniques used to
derive meaningful insights
Discuss the steps taken to validate the
results. Explain how the findings will be
reviewed, confirmed or peer-reviewed for
scientific rigor
9.
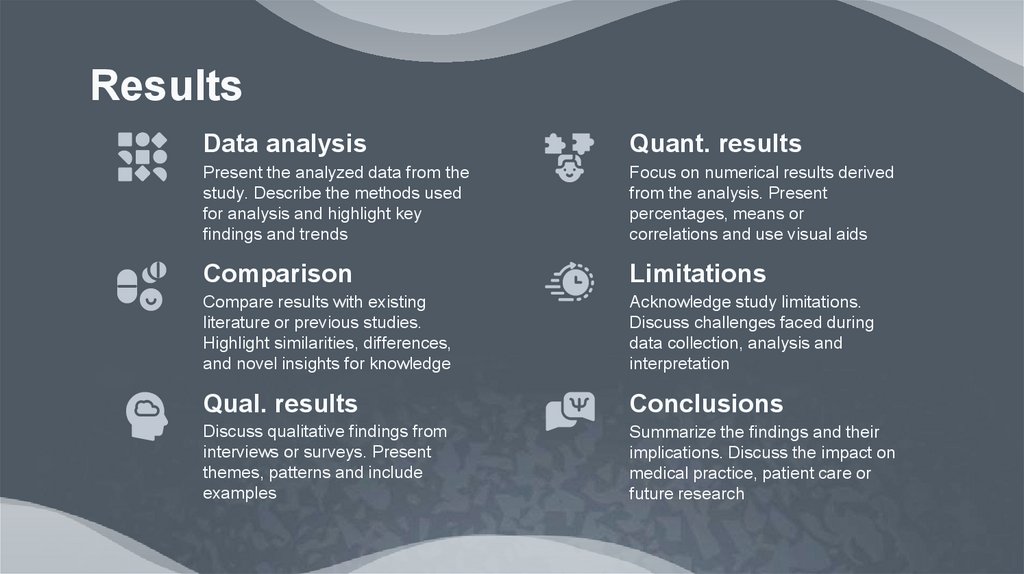
ResultsData analysis
Quant. results
Present the analyzed data from the
study. Describe the methods used
for analysis and highlight key
findings and trends
Focus on numerical results derived
from the analysis. Present
percentages, means or
correlations and use visual aids
Comparison
Limitations
Compare results with existing
literature or previous studies.
Highlight similarities, differences,
and novel insights for knowledge
Acknowledge study limitations.
Discuss challenges faced during
data collection, analysis and
interpretation
Qual. results
Conclusions
Discuss qualitative findings from
interviews or surveys. Present
themes, patterns and include
examples
Summarize the findings and their
implications. Discuss the impact on
medical practice, patient care or
future research
10.
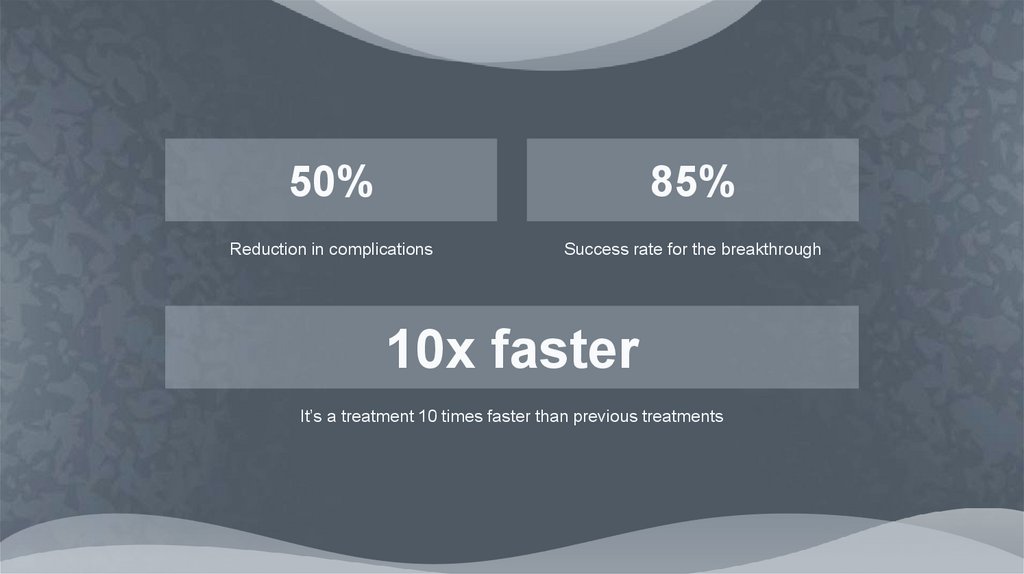
50%85%
Reduction in complications
Success rate for the breakthrough
10x faster
It’s a treatment 10 times faster than previous treatments
11.
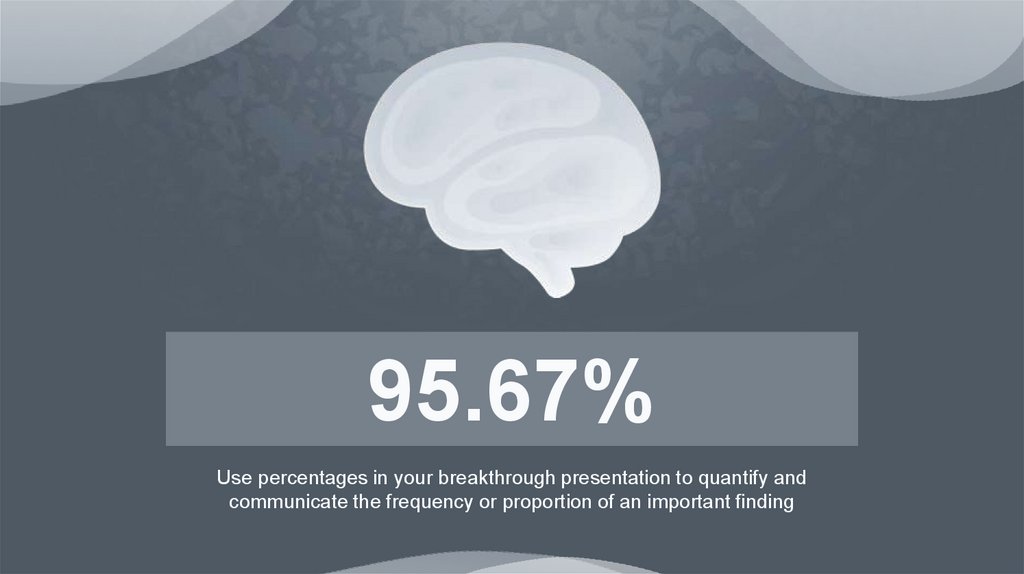
95.67%Use percentages in your breakthrough presentation to quantify and
communicate the frequency or proportion of an important finding
12.
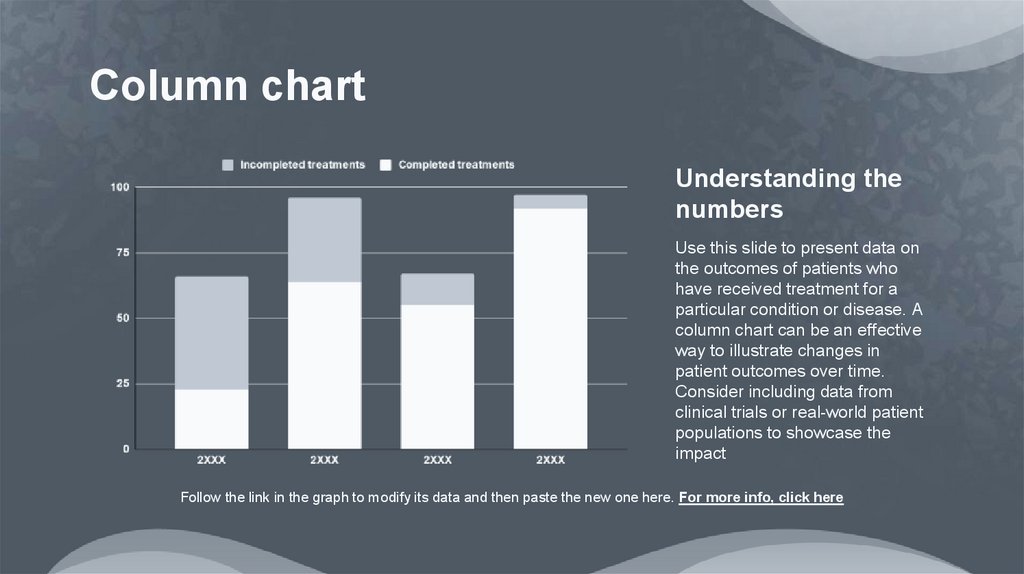
Column chartUnderstanding the
numbers
Use this slide to present data on
the outcomes of patients who
have received treatment for a
particular condition or disease. A
column chart can be an effective
way to illustrate changes in
patient outcomes over time.
Consider including data from
clinical trials or real-world patient
populations to showcase the
impact
Follow the link in the graph to modify its data and then paste the new one here. For more info, click here
13.
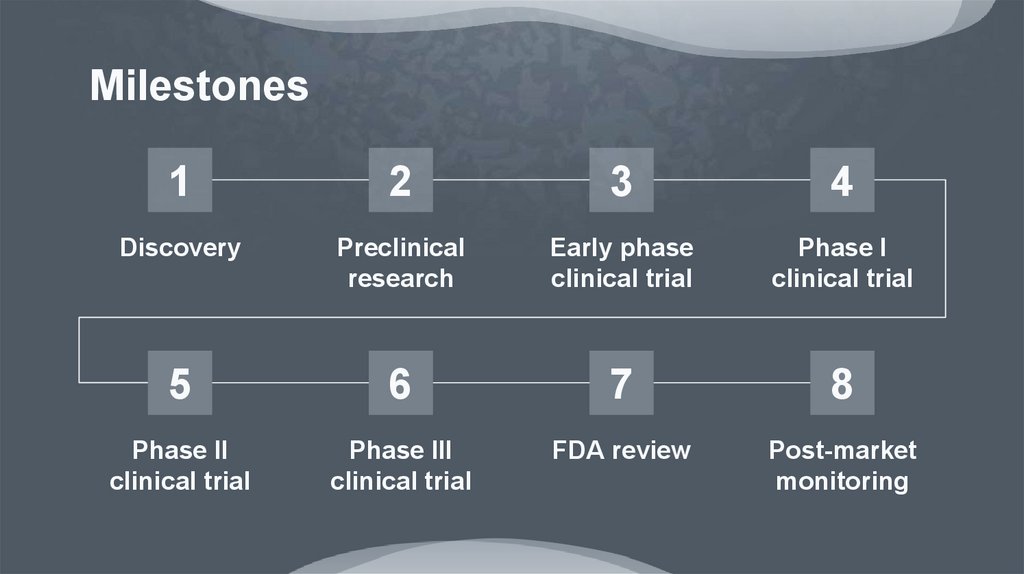
Milestones1
2
3
4
Discovery
Preclinical
research
Early phase
clinical trial
Phase I
clinical trial
5
6
7
8
Phase II
clinical trial
Phase III
clinical trial
FDA review
Post-market
monitoring
14.
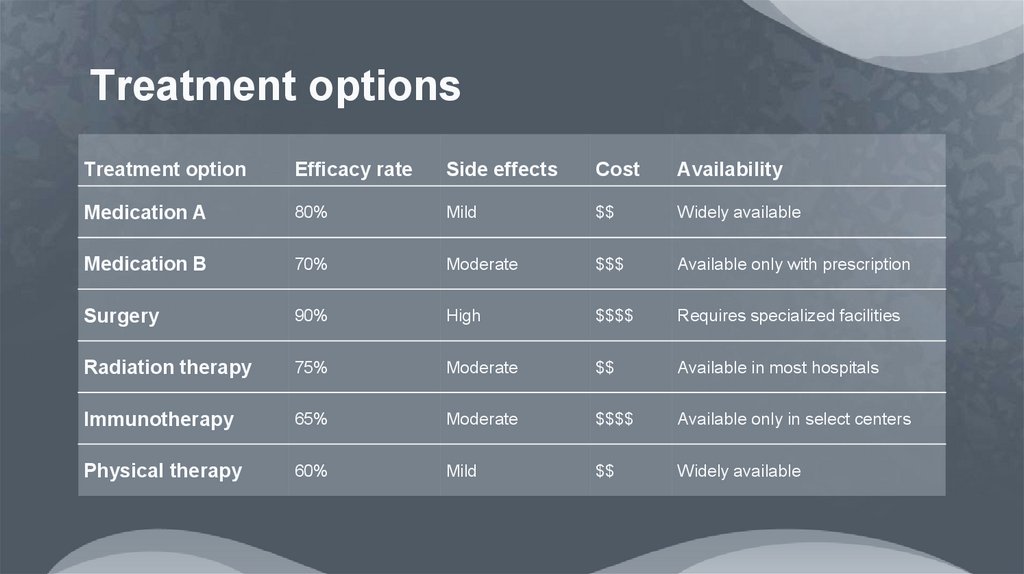
Treatment optionsTreatment option
Efficacy rate
Side effects
Cost
Availability
Medication A
80%
Mild
$$
Widely available
Medication B
70%
Moderate
$$$
Available only with prescription
Surgery
90%
High
$$$$
Requires specialized facilities
Radiation therapy
75%
Moderate
$$
Available in most hospitals
Immunotherapy
65%
Moderate
$$$$
Available only in select centers
Physical therapy
60%
Mild
$$
Widely available
15.
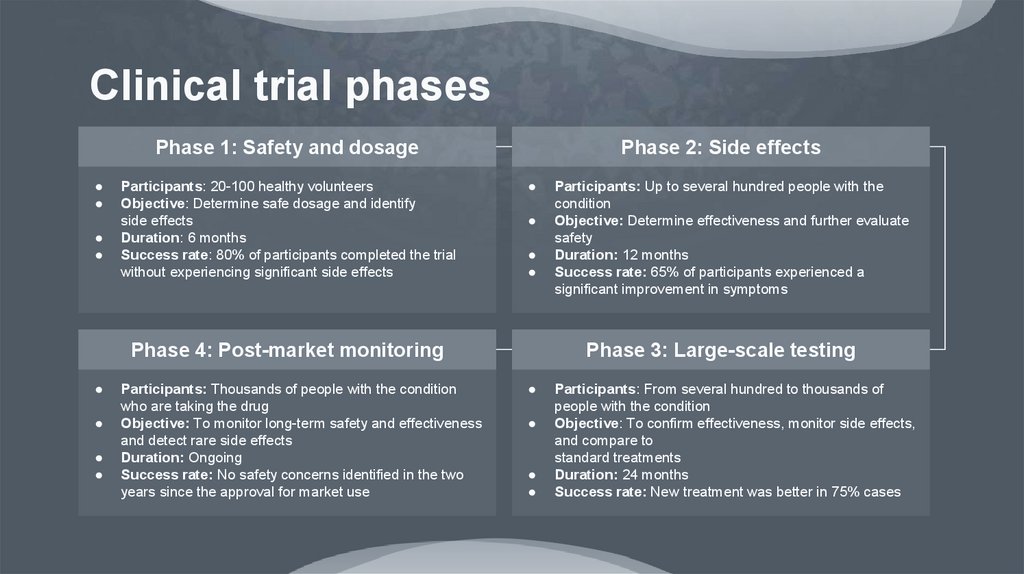
Clinical trial phasesPhase 1: Safety and dosage
Participants: 20-100 healthy volunteers
Objective: Determine safe dosage and identify
side effects
Duration: 6 months
Success rate: 80% of participants completed the trial
without experiencing significant side effects
Phase 2: Side effects
Phase 4: Post-market monitoring
Participants: Thousands of people with the condition
who are taking the drug
Objective: To monitor long-term safety and effectiveness
and detect rare side effects
Duration: Ongoing
Success rate: No safety concerns identified in the two
years since the approval for market use
Participants: Up to several hundred people with the
condition
Objective: Determine effectiveness and further evaluate
safety
Duration: 12 months
Success rate: 65% of participants experienced a
significant improvement in symptoms
Phase 3: Large-scale testing
Participants: From several hundred to thousands of
people with the condition
Objective: To confirm effectiveness, monitor side effects,
and compare to
standard treatments
Duration: 24 months
Success rate: New treatment was better in 75% cases
16.
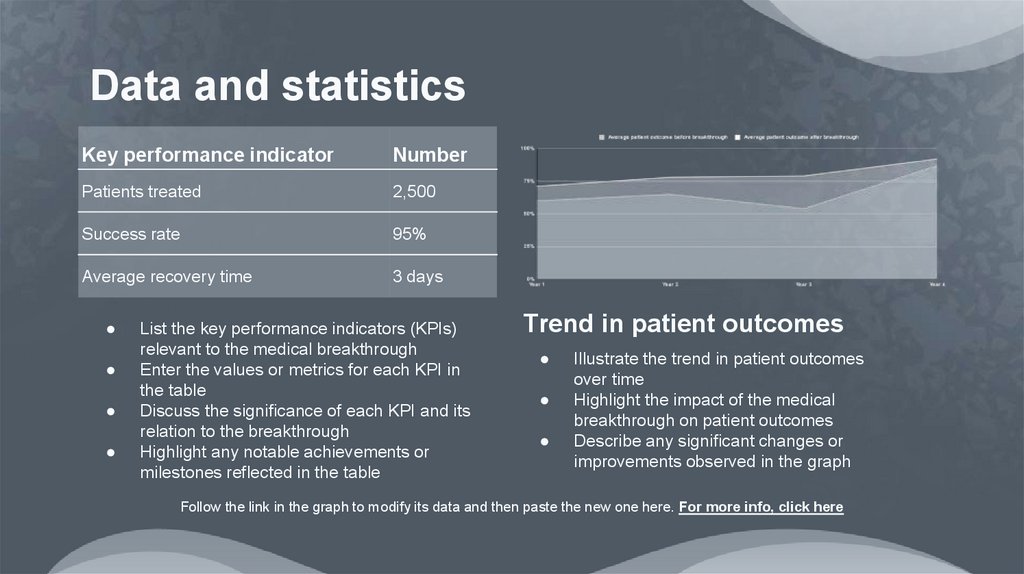
Data and statisticsKey performance indicator
Number
Patients treated
2,500
Success rate
95%
Average recovery time
3 days
List the key performance indicators (KPIs)
relevant to the medical breakthrough
Enter the values or metrics for each KPI in
the table
Discuss the significance of each KPI and its
relation to the breakthrough
Highlight any notable achievements or
milestones reflected in the table
Trend in patient outcomes
Illustrate the trend in patient outcomes
over time
Highlight the impact of the medical
breakthrough on patient outcomes
Describe any significant changes or
improvements observed in the graph
Follow the link in the graph to modify its data and then paste the new one here. For more info, click here
17.
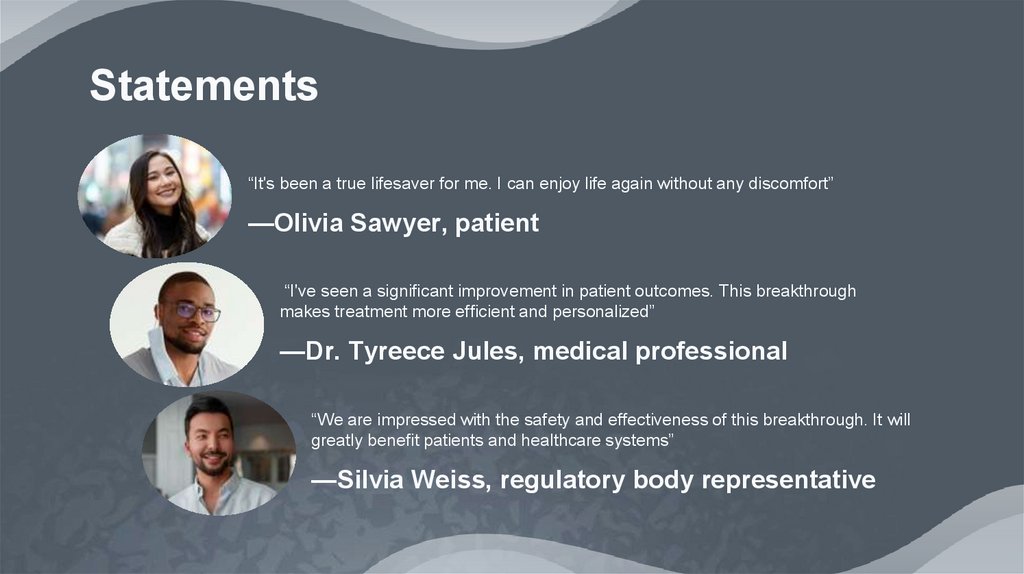
Statements“It's been a true lifesaver for me. I can enjoy life again without any discomfort”
—Olivia Sawyer, patient
“I've seen a significant improvement in patient outcomes. This breakthrough
makes treatment more efficient and personalized”
—Dr. Tyreece Jules, medical professional
“We are impressed with the safety and effectiveness of this breakthrough. It will
greatly benefit patients and healthcare systems”
—Silvia Weiss, regulatory body representative
18.
Key membersJenna Jones
Sarah James
Use a sentence that describe their job
Use a sentence that describe their job
Role: Lead researcher
Role: Clinical trial manager
Contributions:
● You can enter a description of the
contributions here
● You can enter a description of the
contributions here
Contributions:
● You can enter a description of the
contributions here
● You can enter a description of the
contributions here
19.
Results and conclusionsBackground
Briefly introduce the context of the investigation, such as the medical
condition or problem being addressed and the goals
Study design
Describe the design of the study, such as whether it was a
randomized controlled trial or observational study, the sample size
and the inclusion and exclusion criteria
Findings
Summarize the main findings of the investigation, including
statistical results and any important trends or patterns observed
Impact
Discuss the implications of the findings for patients, healthcare
providers and other stakeholders. You could also mention any
potential limitations of the study or areas for future research
Conclusions
1
2
Briefly summarize the main
findings of the study or analysis
Discuss the implications of the
findings and how they relate to the
original research question
References
Include a reference page with the sources used
in your presentation. List the sources in
alphabetical order and include the author's name,
the title of the source, the publication date and
the publisher or URL
20.
ThanksDo you have any questions?
youremail@freepik.com
+91 620 421 838
yourwebsite.com
CREDITS: This presentation template was created by
Slidesgo, and includes icons by Flaticon and infographics
& images by Freepik
Please keep this slide for attribution
21.
Icon pack22.
Alternative resourcesHere’s an assortment of alternative resources whose style fits the one of this template:
Vectors
● Gradient mental health facebook post
● Hand drawn flat january horizontal banners set
● Mental health logos collection
23.
ResourcesDid you like the resources in this template? Get them
for free at our other websites:
Vectors
● Colorful flat infographic template of brain
● Gradient mental health facebook cover I
● Gradient mental health facebook cover II
● Gradient mental health facebook post
● Hand drawn flat january horizontal banners set
● Modern mental health concept with flat design
Icons
● Filled therapy icon pack
Photos
● Close up on health worker
● Person of indian origin having fun
● Front view smiley doctor at clinic
● Depression collage concept
● Japan teenager person having fun in the city
● Side view smiley doctor at work
24.
Instructions for useIf you have a free account, in order to use this template, you must credit Slidesgo by keeping the Thanks slide. Please
refer to the next slide to read the instructions for premium users.
As a Free user, you are allowed to:
Modify this template.
Use it for both personal and commercial projects.
You are not allowed to:
Sublicense, sell or rent any of Slidesgo Content (or a modified version of Slidesgo Content).
Distribute Slidesgo Content unless it has been expressly authorized by Slidesgo.
Include Slidesgo Content in an online or offline database or file.
Offer Slidesgo templates (or modified versions of Slidesgo templates) for download.
Acquire the copyright of Slidesgo Content.
For more information about editing slides, please read our FAQs or visit our blog:
https://slidesgo.com/faqs and https://slidesgo.com/slidesgo-school
25.
Instructions for use (premium users)As a Premium user, you can use this template without attributing Slidesgo or keeping the "Thanks" slide.
You are allowed to:
Modify this template.
Use it for both personal and commercial purposes.
Hide or delete the “Thanks” slide and the mention to Slidesgo in the credits.
Share this template in an editable format with people who are not part of your team.
You are not allowed to:
Sublicense, sell or rent this Slidesgo Template (or a modified version of this Slidesgo Template).
Distribute this Slidesgo Template (or a modified version of this Slidesgo Template) or include it in a database or in
any other product or service that offers downloadable images, icons or presentations that may be subject to
distribution or resale.
Use any of the elements that are part of this Slidesgo Template in an isolated and separated way from this
Template.
Register any of the elements that are part of this template as a trademark or logo, or register it as a work in an
intellectual property registry or similar.
For more information about editing slides, please read our FAQs or visit our blog:
https://slidesgo.com/faqs and https://slidesgo.com/slidesgo-school
26.
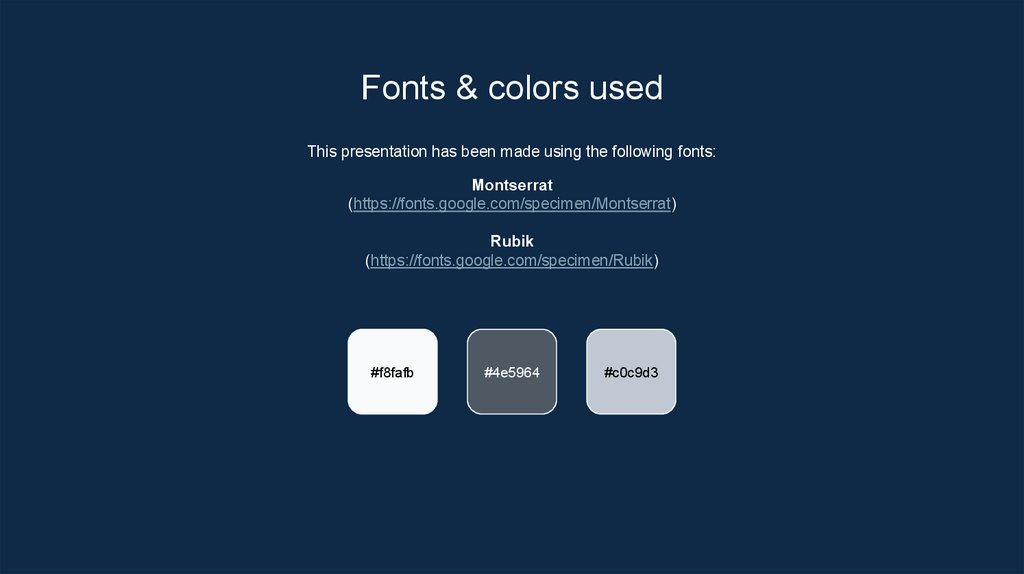
Fonts & colors usedThis presentation has been made using the following fonts:
Montserrat
(https://fonts.google.com/specimen/Montserrat)
Rubik
(https://fonts.google.com/specimen/Rubik)
#f8fafb
#4e5964
#c0c9d3
27.
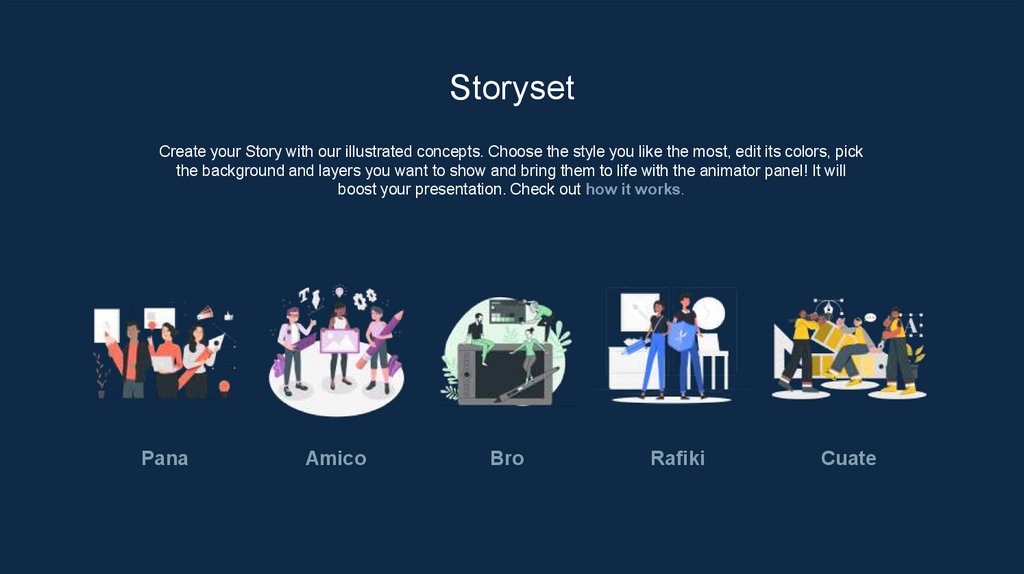
StorysetCreate your Story with our illustrated concepts. Choose the style you like the most, edit its colors, pick
the background and layers you want to show and bring them to life with the animator panel! It will
boost your presentation. Check out how it works.
Pana
Amico
Bro
Rafiki
Cuate
28.
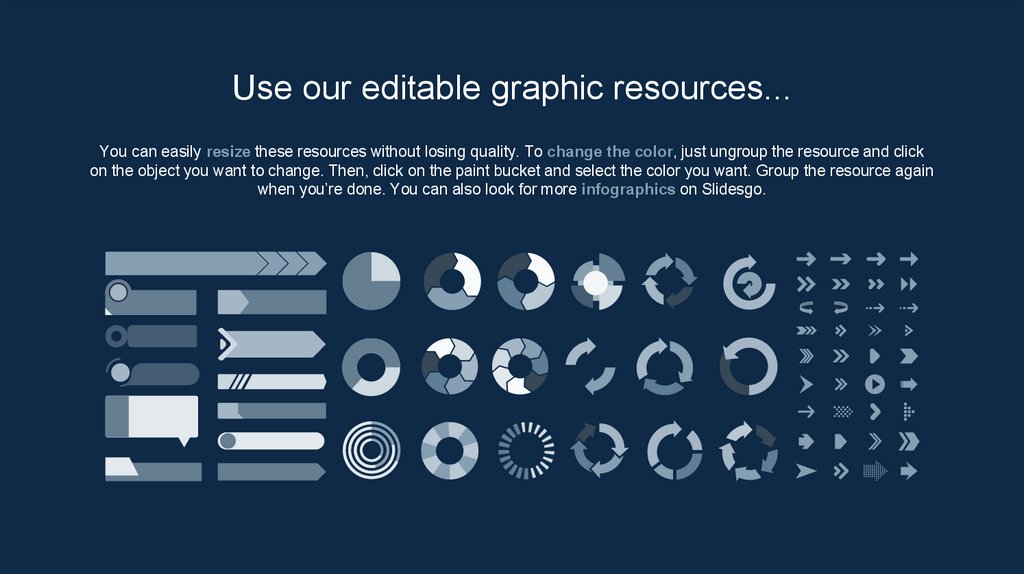
Use our editable graphic resources...You can easily resize these resources without losing quality. To change the color, just ungroup the resource and click
on the object you want to change. Then, click on the paint bucket and select the color you want. Group the resource again
when you’re done. You can also look for more infographics on Slidesgo.
29.
30.
31.
JANUARYFEBRUARY
MARCH
APRIL
MAY
JUNE
PHASE 1
Task 1
Task 2
PHASE 2
Task 1
Task 2
JANUARY
PHASE 1
Task 1
Task 2
FEBRUARY
MARCH
APRIL
32.
33.
34.
...and our sets of editable iconsYou can resize these icons without losing quality.
You can change the stroke and fill color; just select the icon and click on the paint bucket/pen.
In Google Slides, you can also use Flaticon’s extension, allowing you to customize and add even more icons.
35.
Educational IconsMedical Icons
36.
Business IconsTeamwork Icons
37.
Help & Support IconsAvatar Icons
38.
Creative Process IconsPerforming Arts Icons