


 english
Similar presentations:


Today’s Agenda
1.
Today’s Agenda1. MU Key Concepts
2. The standard MU reports
3. Basic of Production Execution
4. Specific MU Business cases
5. Resources for further study
2.
Today’s Agenda1. MU Key Concepts
2. The standard MU reports
3. Basic of production Execution
4. Specific MU Business cases
5. Resources for further study
3.
What is MU?1) MU is the abbreviation for Material Utilisation
2) It is a Product Supply Measure to track the efficiency of
material usage in Manufacturing Plants*
3) It uses an IWS Approach to identify losses versus an Ideal
State.
4) MU can be reported as both Percent % and Monetary Value
5) MU is obtained directly out of SAP, via the ZD28 report
6) MU can be calculated at material level or any level of aggregation
7) MU is NOT an account or a cost center !
4.
What is MU?The MU Measure is obtained by comparing:
Value of materials
that should have
been used*:
98 $M
versus
Value of
materials
actually used :
100$M
MU% = 98% (Theoretical Usage* divided by Total Actual Usage)
MU Loss = 2 $M (Total Actual Usage less Theoretical Usage)
*The theoretical usage does not include the scrap factor!
5.
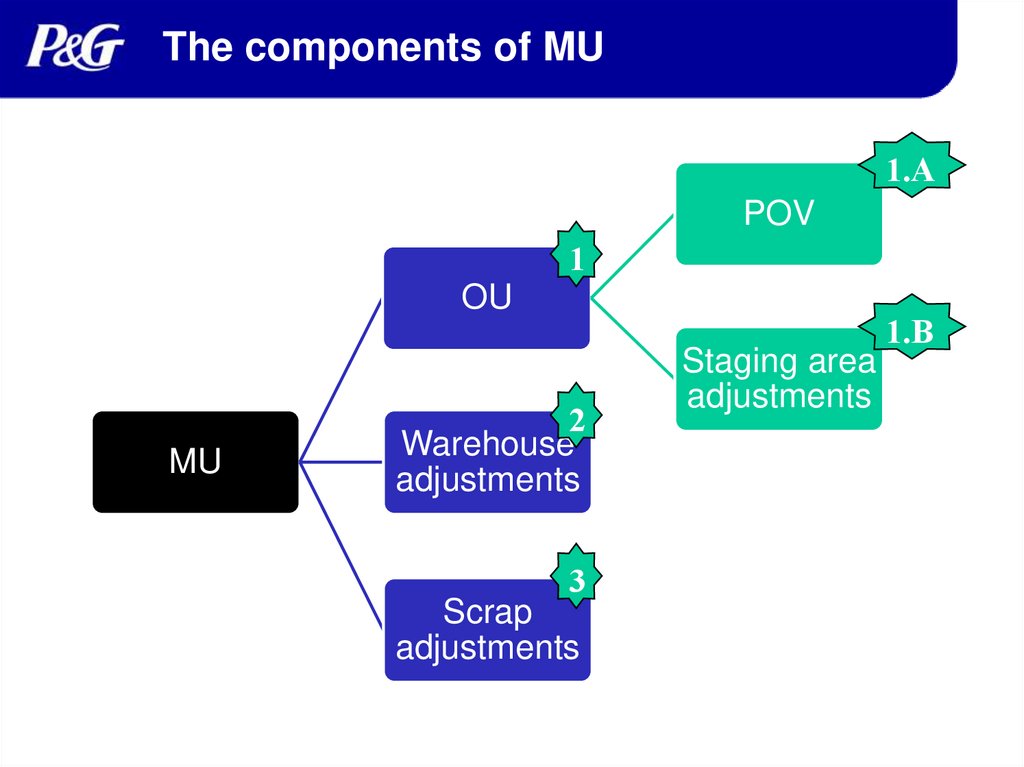
The components of MU1.A
POV
1
OU
MU
2
Warehouse
adjustments
3
Scrap
adjustments
Staging area
adjustments
1.B
6.
1. Definitions: OU• Operational Utilization is an analysis of POV
and staging area adjustments.
• This considers only materials with planned
and unplanned goods issues on the PO’s
which meet the selection criteria.
• Mathematically for a given material it is
calculated as follows:
Planned Usage w/o Scrap
Actual Production Usage + Staging Adjustments
• The plant total OU is weighted by price and
the ideal state is 100%
7.
1.A Process Order Variance (POV)• Process Order Variance is an analysis of net usage to PO’s
versus the planned usage. This considers only materials
with planned and unplanned goods issues on the PrO’s
which meet the selection criteria. The target is 0%.
• Mathematically it is represented as follows:
Quantity Variance w/o Scrap x 100
Planned Usage
• Quantity Variance = Actual Production Usage minus Planned Usage
• This is the only report that allows aggregation by Production
Line. Other reports do not since they include metrics not
linked to individual production lines in the system.
8.
1.B Staging Area Adjustment• Difference between the actual inventory
counted and the inventory quantity on record in
the system in the Staging Area
• Staging area = Small inventory quantities in
locations close to where production resources
will consume the material normally on or near
the production resources. A plant can have any
number of staging areas
• Production movement type: 931/932
9.
Role of Staging Locations• Small inventory quantities in locations close to where
production resources will consume the material.
• Only material with unrestricted quality status is allowed
be in the staging area
• Activity is strictly controlled and measured
• Staging areas are not managed by WMS’s (e.g., RTCIS).
• To separate warehouse activity from production activity
losses.
• Materials in staging areas are in constant use and
reconciled frequently with Staging area adjustments.
10.
2. Warehouse Adjustment• Difference between the actual inventory counted and
the inventory quantity on record in the system prior to
reaching the Staging Area.
• Warehouse adjustments can be done for any type of
materials (RPM, intermediates or FP)
• Only active materials are taken into account
• Part of GMC/GLC, shows under the inventory variance
GL account
• Production movement type: 700 series
11.
Role of Warehouse Storage Locations• Warehouse is the location where materials are received
and stored until they are needed for production, shipment
or scrap so materials could be in any quality status
• Store large amounts of inventory
• Normally physically separated from production resources
• All activity strictly controlled and measured
• Accurate balance at any time. Warehouse areas are
reconciled as needed (min 1x/month) with Warehouse
adjustment movements (70X)
12.
3. Scrap Adjustment• Inventory adjustments for scrap of materials,
only for active materials
• Active materials = materials that have been
consumed or manufactured during the
period
• Part of TDC under IDE
• Production movement type: 55Xseries
13.
Knowledge checkCan we measure MU by production
asset (e.g. line level)?
14.
Knowledge checkWhat can cause MU to be above 100% ?
15.
Knowledge checkCan a site reduce it’s reported MU loss
by increasing their scrap factors?
16.
What is MUV ?• MUV = The difference between the actuals
losses (expressed as OU) vs the scrap factors
included in the finance BOMs
• MUV is a financial variance used by the CCT to
prepare the materials forecast updates
• This measure is not used by PS and has no
practical value in understanding the plant losses. It
is only relevant in the RBU TDC forecasting
process.
17.
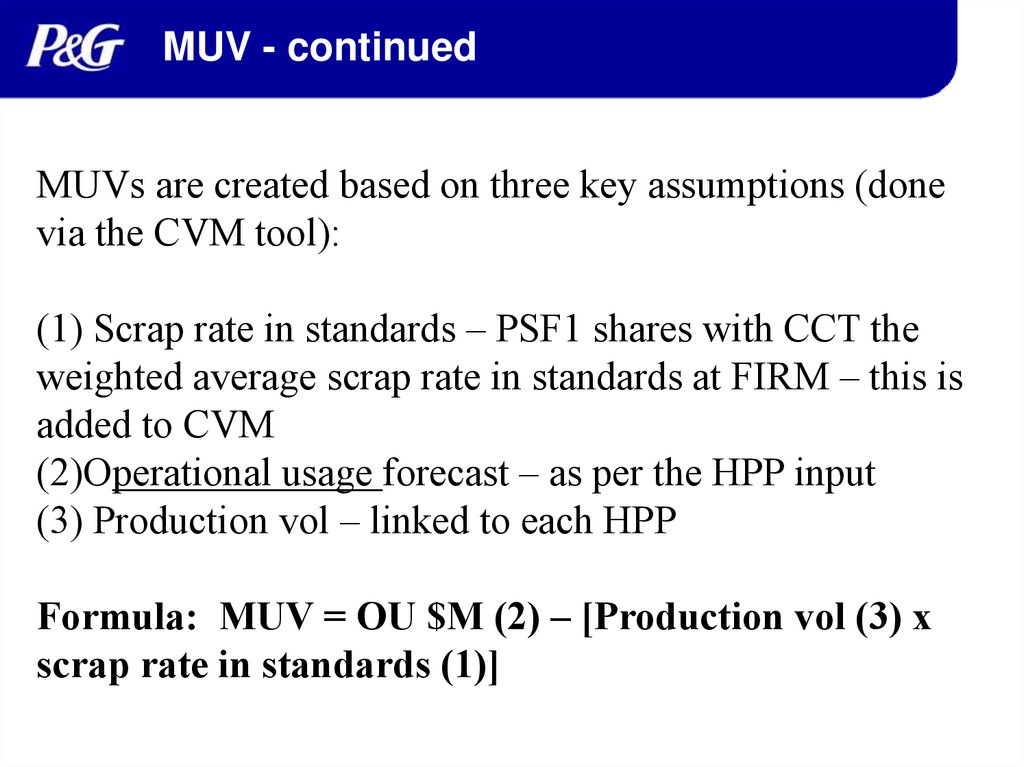
MUV - continuedMUVs are created based on three key assumptions (done
via the CVM tool):
(1) Scrap rate in standards – PSF1 shares with CCT the
weighted average scrap rate in standards at FIRM – this is
added to CVM
(2)Operational usage forecast – as per the HPP input
(3) Production vol – linked to each HPP
Formula: MUV = OU $M (2) – [Production vol (3) x
scrap rate in standards (1)]
18.
MU vs MUV – Simplified comparisonActual
usage
Actual
usage
vs.
vs.
Production
BOM
MU
Material
Utilization
Finance
BOM
MUV
Material Usage
Variance
MU = difference between Actual Usage vs. Production BOM (w/o
scrap) -> loss elimination tool
MU Variance = difference between OU vs. Finance BOM scrap
factor -> forecast tool
19.
MU accountingZD28 element
Accounting Entry
P&L impact
OU
(Process Order
Variance and
Staging Adjustment)
RPM and FP Staging/Variance
accounts
As per the VHP
GMC Adjustments
(warehouse
adjustment)
IDE Adjustments
(scrap adjustment)
(e.g. 58120100 Stg Area Var PM Std)
GMC Variance accounts
(e.g. 58510100 Inv Var RM Std
58520100 Inv Var PM Std )
IDE accounts
(e.g. 58710100 Disp St RM Std
58720100 Disp St PM Std )
Reconciled in MUV
June release*
(peg rate)
Reconciled in
GMC/GLC
As incurred
Reconciled in IDE
* Part of the GMC adjustment could be captured in the Peg Rate if forecasted at FIRM
20.
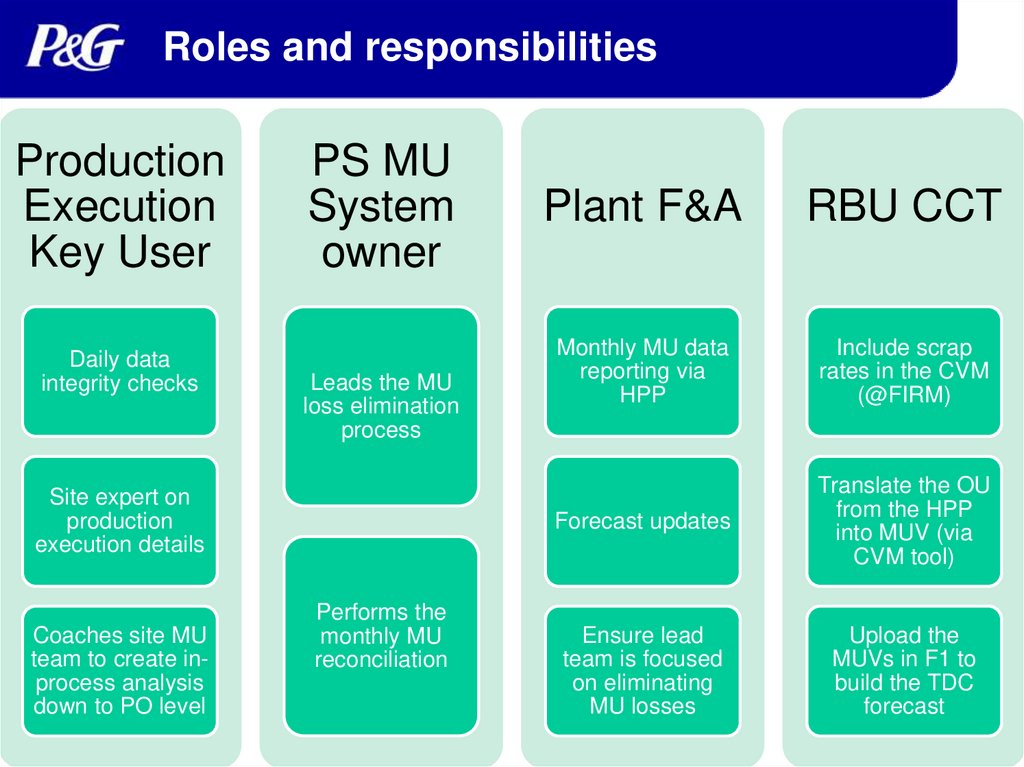
Roles and responsibilitiesProduction
Execution
Key User
Daily data
integrity checks
PS MU
System
owner
Leads the MU
loss elimination
process
Site expert on
production
execution details
Coaches site MU
team to create inprocess analysis
down to PO level
Performs the
monthly MU
reconciliation
Plant F&A
RBU CCT
Monthly MU data
reporting via
HPP
Include scrap
rates in the CVM
(@FIRM)
Forecast updates
Translate the OU
from the HPP
into MUV (via
CVM tool)
Ensure lead
team is focused
on eliminating
MU losses
Upload the
MUVs in F1 to
build the TDC
forecast
21.
Today’s Agenda1. MU Key Concepts
2. The standard MU reports
3. Basic of production Execution
4. Specific MU Business cases
5. Resources for further study
22.
Set of 3 standard MU reportsPlant MU Report
Users: Plant-based teams, PLT, Plant
F&A, MU leader
Global Category Dashboard
Users: GBU/RBU PS and PS F&A
23.
How to use MU reportsMU performance of the Plant
Preliminary diagnosis
Origin groups, Materials driving top losses;
Enable x-plant/category benchmarking
Basis for HPP – Plant Cost Forecast
It does NOT enable full Loss Analysis and
Elimination actions
PS will continue to use additional systems (Prophicy) and
processes (on-the-floor studies and measurements)
24.
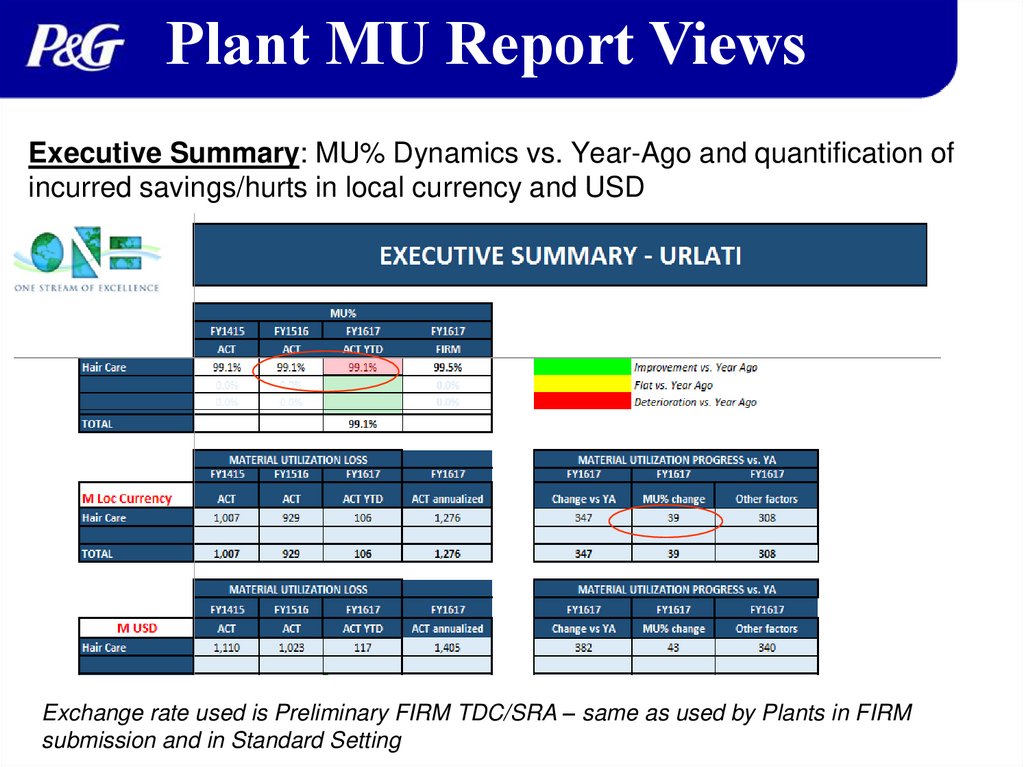
Plant MU Report ViewsExecutive Summary: MU% Dynamics vs. Year-Ago and quantification of
incurred savings/hurts in local currency and USD
Exchange rate used is Preliminary FIRM TDC/SRA – same as used by Plants in FIRM
submission and in Standard Setting
25.
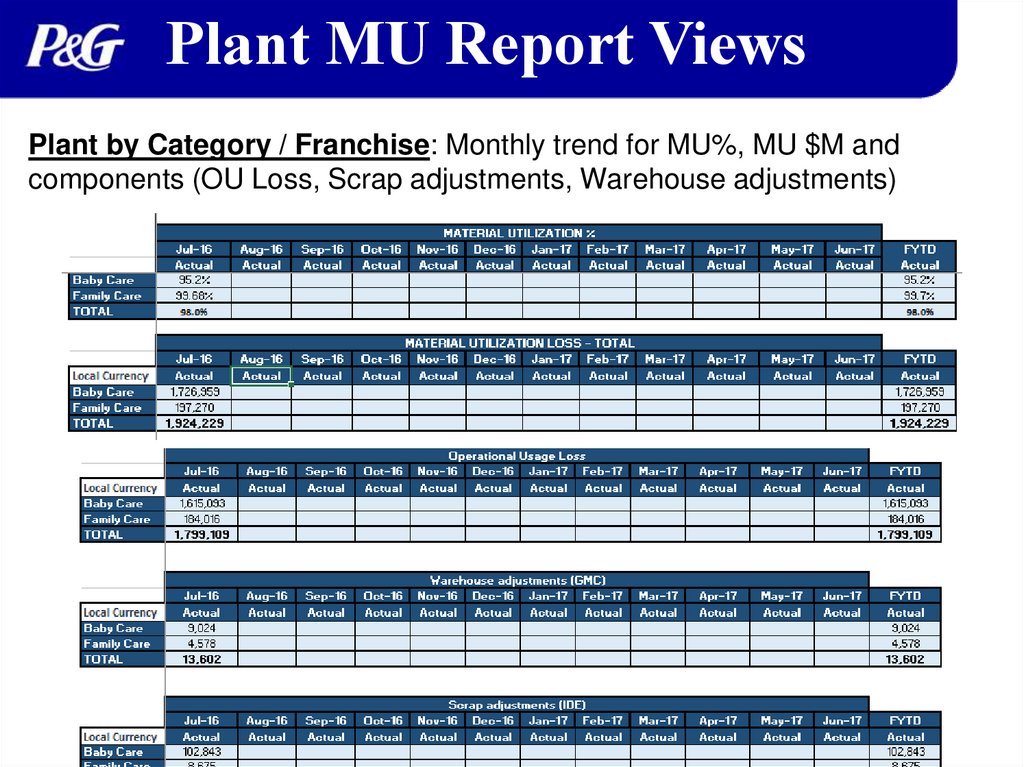
Plant MU Report ViewsPlant by Category / Franchise: Monthly trend for MU%, MU $M and
components (OU Loss, Scrap adjustments, Warehouse adjustments)
26.
Plant MU Report ViewsOrigin Group: Summarized MU (and components) monthly progression by
key groupings of materials (SAP origin groups) at plant level
27.
Plant MU Report ViewsMU Output: The material line item database (ZD28) on which the entire
report is built. It can be used for other pivots/summaries as need by the plant
(i.e. Top 5 losses, Staging Area analysis)
28.
Category/region MU DashboardCategory / Region MU Dashboard is targeted for high level reviews
(GBU view across global plants, or regional GTM reviews)
Similarly to Plant Reports, the
Regional Scorecard shows MU%
Dynamics vs. Year-Ago and
quantification of incurred
savings/hurts in USD
29.
Category/Region MU DashboardContains monthly progression for Key Measures (MU% and MU loss $) as
well as OU loss $M progression useful for unplanned variance proofing
Contains capability for benchmarking at origin group level
30.
Where to find the reportsMaking OPT teamspace:
https://pgone.sharepoint.com/sites/shcmakingopt/SitePages/MaterialUtilization.aspx
31.
Today’s Agenda1. MU Key Concepts
2. The standard MU reports
3. Basic of production Execution
4. Specific MU Business cases
5. Resources for further study
32.
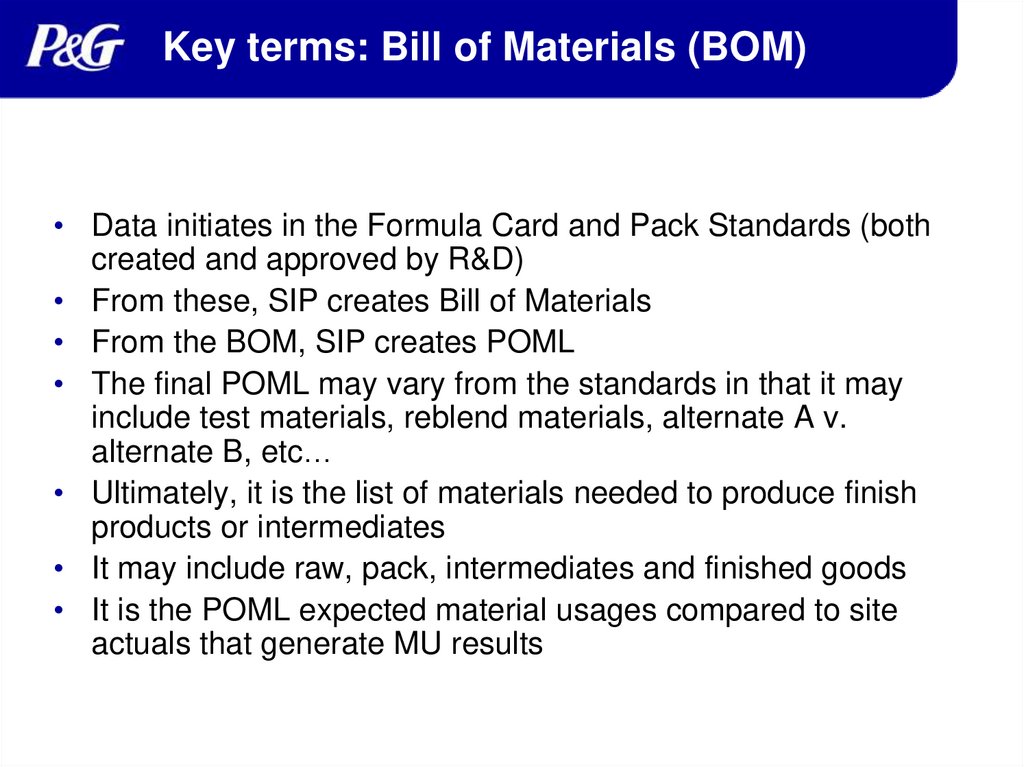
Key terms: Bill of Materials (BOM)• Data initiates in the Formula Card and Pack Standards (both
created and approved by R&D)
• From these, SIP creates Bill of Materials
• From the BOM, SIP creates POML
• The final POML may vary from the standards in that it may
include test materials, reblend materials, alternate A v.
alternate B, etc…
• Ultimately, it is the list of materials needed to produce finish
products or intermediates
• It may include raw, pack, intermediates and finished goods
• It is the POML expected material usages compared to site
actuals that generate MU results
33.
Key terms: Scrap Factor• Planned, additional quantity of material that has to be added
to base formula in order to cover material losses in
production process
– 2 ways to set-up scrap factors: in BOM or in Material Master
– Incurred in the end to end production area
• Usually based on historical material usage
• Used as a planning tool to ensure enough materials are
available for production at the time needed
• It is not possible to have a negative scrap factor, i.e., a gain.
Gains reflect inaccurate planning or data integrity issues and
should be corrected – not planned for.
• Scrap factors represent known losses which should be
planned for but also have loss elimination action
plans/forecasts when right for the business. Often business
will create scrap factor tolerances to identify which losses to
target.
34.
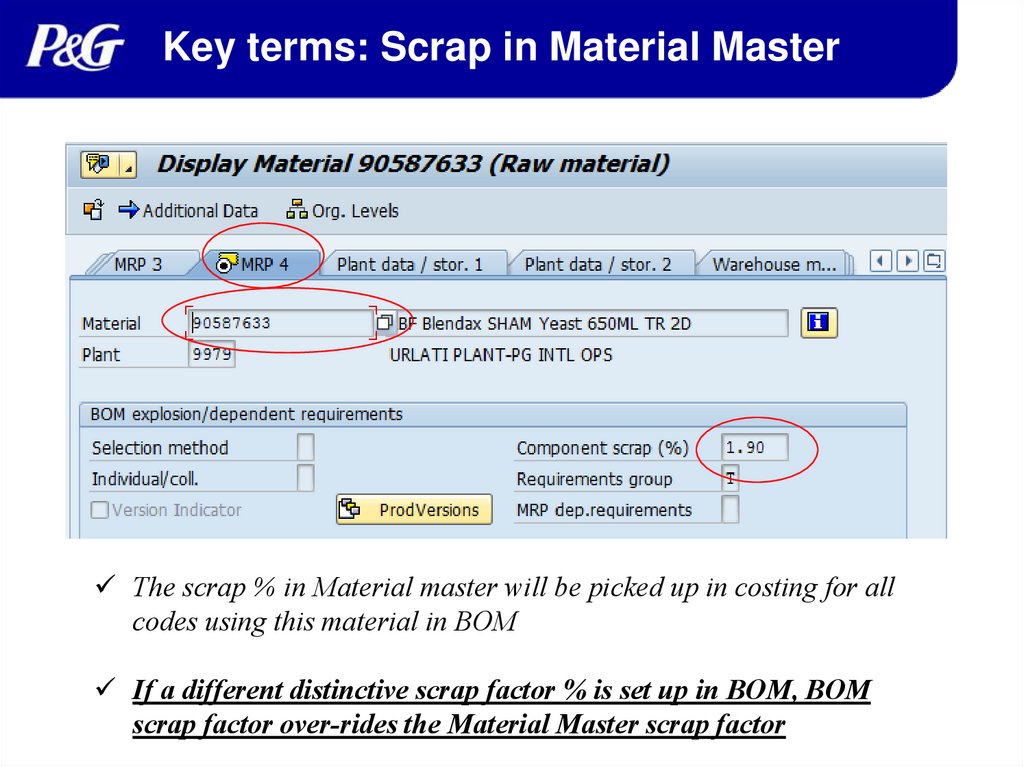
Key terms: Scrap in Bill Of Material35.
Key terms: Scrap in Material MasterThe scrap % in Material master will be picked up in costing for all
codes using this material in BOM
If a different distinctive scrap factor % is set up in BOM, BOM
scrap factor over-rides the Material Master scrap factor
36.
Key terms: PROCESS ORDERInstrument in SAP created by Planning to confirm what is to be
produced at a point in time*, on which operating line/machine
Before production:
PO contain all materials
required to make a
product
Planned Usage
During and after
production:
Charge any material
consumed against the PO
Actual Usage
SAP is able to compare Actual Usage versus Planned
Usage for any product on any day for any line/machine.
A PO serves as a cost collector for all cost of production –
includes both materials and labor costs. (material + Labour)
A PO can represent a production run that can take any where
from a few minutes to a couple of days
37.
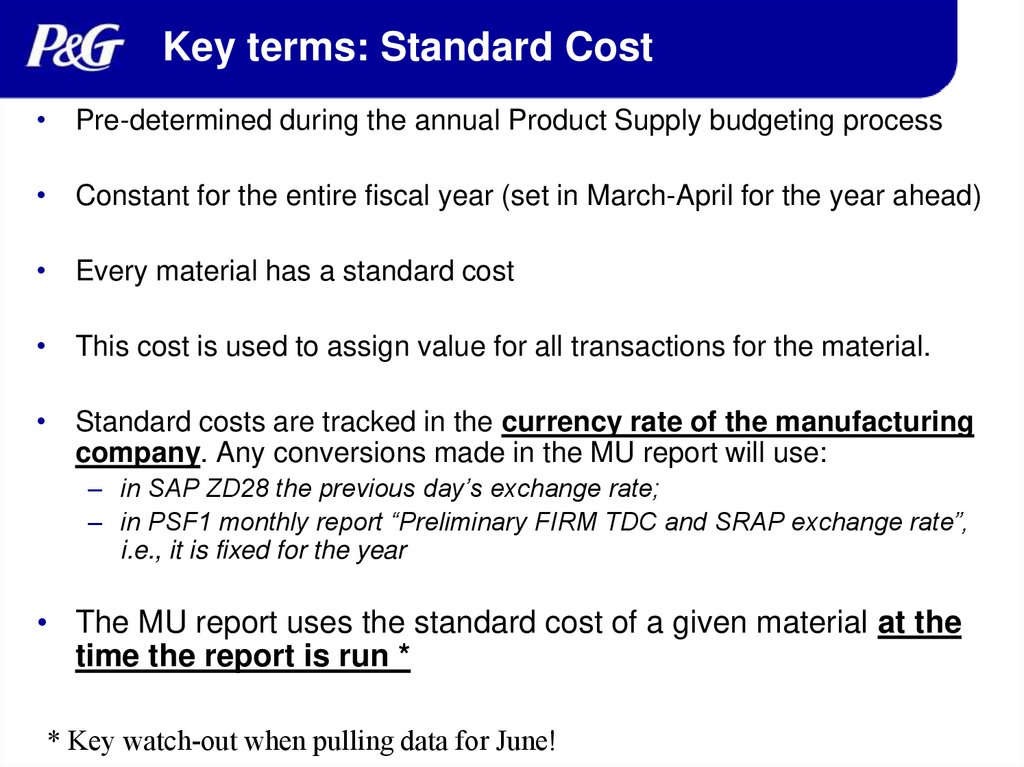
Key terms: Standard Cost• Pre-determined during the annual Product Supply budgeting process
• Constant for the entire fiscal year (set in March-April for the year ahead)
• Every material has a standard cost
• This cost is used to assign value for all transactions for the material.
• Standard costs are tracked in the currency rate of the manufacturing
company. Any conversions made in the MU report will use:
– in SAP ZD28 the previous day’s exchange rate;
– in PSF1 monthly report “Preliminary FIRM TDC and SRAP exchange rate”,
i.e., it is fixed for the year
• The MU report uses the standard cost of a given material at the
time the report is run *
* Key watch-out when pulling data for June!
38.
Material Physical FlowWarehouse
Material
Receipt
WHSE (TANK)
Component Materials
not managed by WMS
Cost/
SIP
WHSE
Component Materials
managed by WMS
ULF
Finished
Cases
Line Staging Areas (no
WMS)
Common Line
Staging Area (no WMS)
Production Line
(Resource)
(Process Order)
or
Intermediate
WHSE
Produced
Materials
managed by
WMS
39.
Material Goods IssuingWarehouse
Material
Receipt
WHSE (TANK)
Component Materials
not managed by WMS
Cost/
SIP
WHSE
Component Materials
managed by WMS
ULF
Finished
Cases
Line Staging Areas (no
WMS)
Common Line
Staging Area (no WMS)
Production Line
(Resource)
(Process Order)
or
Intermediate
WHSE
Produced
Materials
managed by
WMS
40.
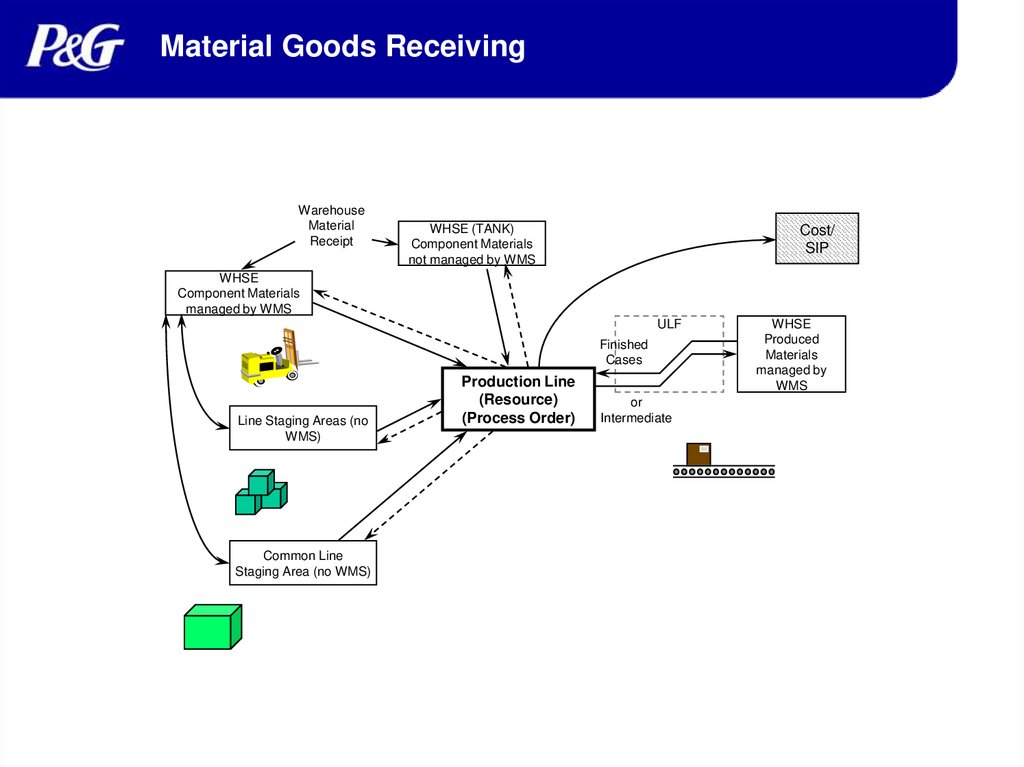
Material Goods ReceivingWarehouse
Material
Receipt
WHSE (TANK)
Component Materials
not managed by WMS
Cost/
SIP
WHSE
Component Materials
managed by WMS
ULF
Finished
Cases
Line Staging Areas (no
WMS)
Common Line
Staging Area (no WMS)
Production Line
(Resource)
(Process Order)
or
Intermediate
WHSE
Produced
Materials
managed by
WMS
41.
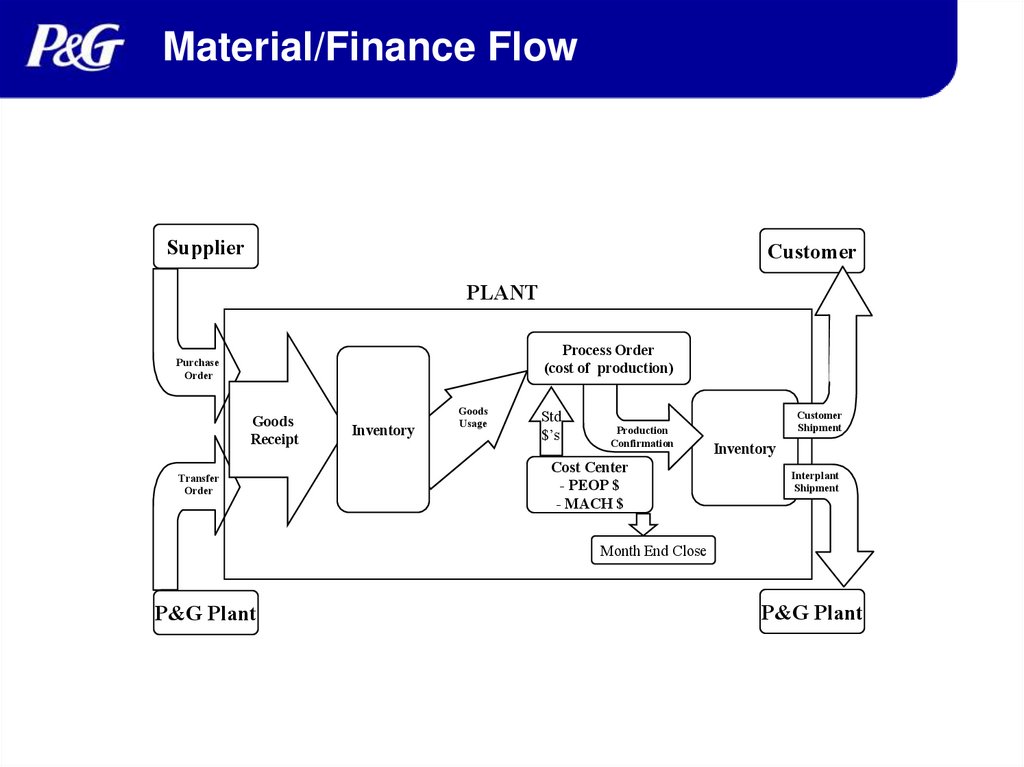
Material/Finance FlowSupplier
Customer
PLANT
Process Order
(cost of production)
Purchase
Order
Goods
Receipt
Transfer
Order
Inventory
Goods
Usage
Std
$’s
Production
Confirmation
Cost Center
- PEOP $
- MACH $
Customer
Shipment
Inventory
Interplant
Shipment
Month End Close
P&G Plant
P&G Plant
42.
Material/Finance FlowProcess Order
Variance
Supplier
PLANT
Process Order
(cost of production)
Purchase
Order
Goods
Receipt
Transfer
Order
P&G Plant
Inventory
Goods
Usage
Std
$’s
Production
Confirmation
Cost Center
- PEOP $
- MACH $
43.
Material/Finance FlowOrder Variance
- Prod Ord Var
- Prod Activ Var
Supplier
PLANT
Process Order
(cost of production)
Purchase
Order
Goods
Receipt
Transfer
Order
P&G Plant
Inventory
Goods
Usage
Std
$’s
Production
Confirmation
Cost Center
- PEOP $
- MACH $
Staging
Area
Variance
44.
Material/Finance FlowSupplier
Customer
PLANT
Process Order
(cost of production)
Purchase
Order
Goods
Receipt
Transfer
Order
Inventory
Goods
Usage
Std
$’s
Production
Confirmation
Cost Center
- PEOP $
- MACH $
Customer
Shipment
Inventory
Interplant
Shipment
Month End Close
P&G Plant
Warehouse Var.
P&G Plant
45.
The Variances Considered in MUProcess Order
Variance
Supplier
Customer
PLANT
Process Order
(cost of production)
Purchase
Order
Goods
Receipt
Transfer
Order
Inventory
Goods
Usage
Std
$’s
Confirmation
Cost Center
- PEOP $
- MACH $
Customer
Shipment
Inventory
Interplant
Shipment
Month End Close
Staging
Area
Variance
P&G Plant
P&G Plant
Warehouse
Variation/Scrap
46.
Q&A• In which period does the MU loss
from a PO show in the MU report ?
47.
Q&A• Which materials should not be part of
the MU report ?
– ROH
– HALBS
– Finish products
– FERT
48.
Q&A• Can a plant that is not producing
anything at the moment show a MU
loss?
49.
Today’s Agenda1. MU Key Concepts
2. The standard MU reports
3. Basic of production Execution
4. Specific MU Business cases
5. Resources for further study
50.
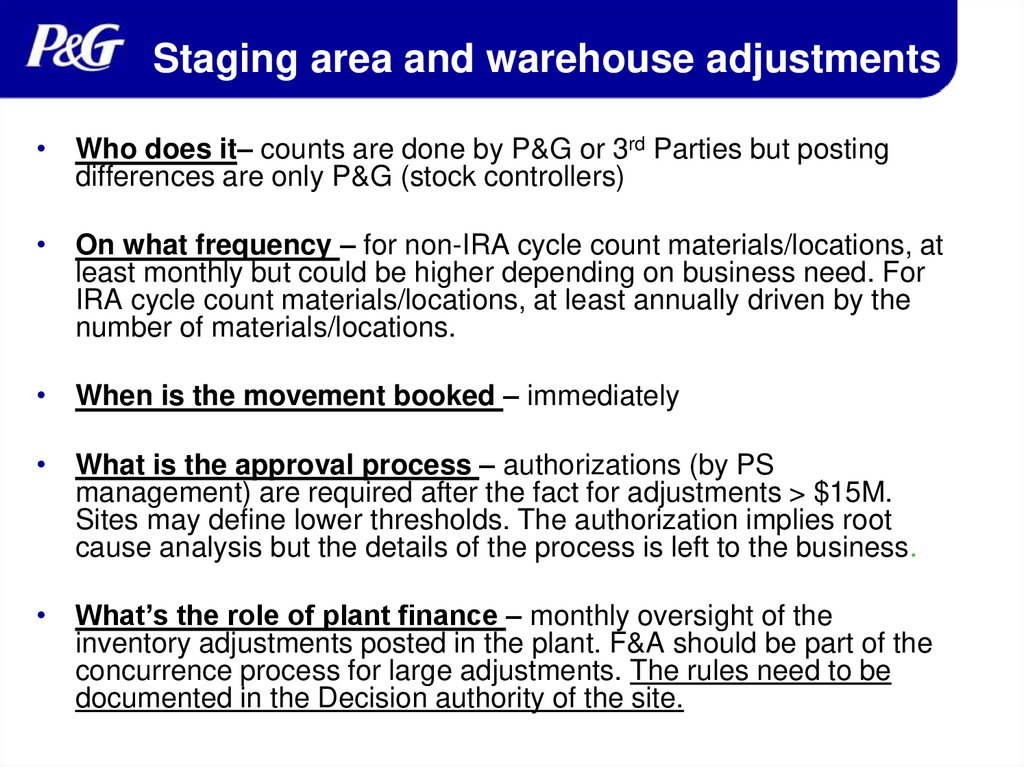
Staging area and warehouse adjustments• Who does it– counts are done by P&G or 3rd Parties but posting
differences are only P&G (stock controllers)
• On what frequency – for non-IRA cycle count materials/locations, at
least monthly but could be higher depending on business need. For
IRA cycle count materials/locations, at least annually driven by the
number of materials/locations.
• When is the movement booked – immediately
• What is the approval process – authorizations (by PS
management) are required after the fact for adjustments > $15M.
Sites may define lower thresholds. The authorization implies root
cause analysis but the details of the process is left to the business.
• What’s the role of plant finance – monthly oversight of the
inventory adjustments posted in the plant. F&A should be part of the
concurrence process for large adjustments. The rules need to be
documented in the Decision authority of the site.
51.
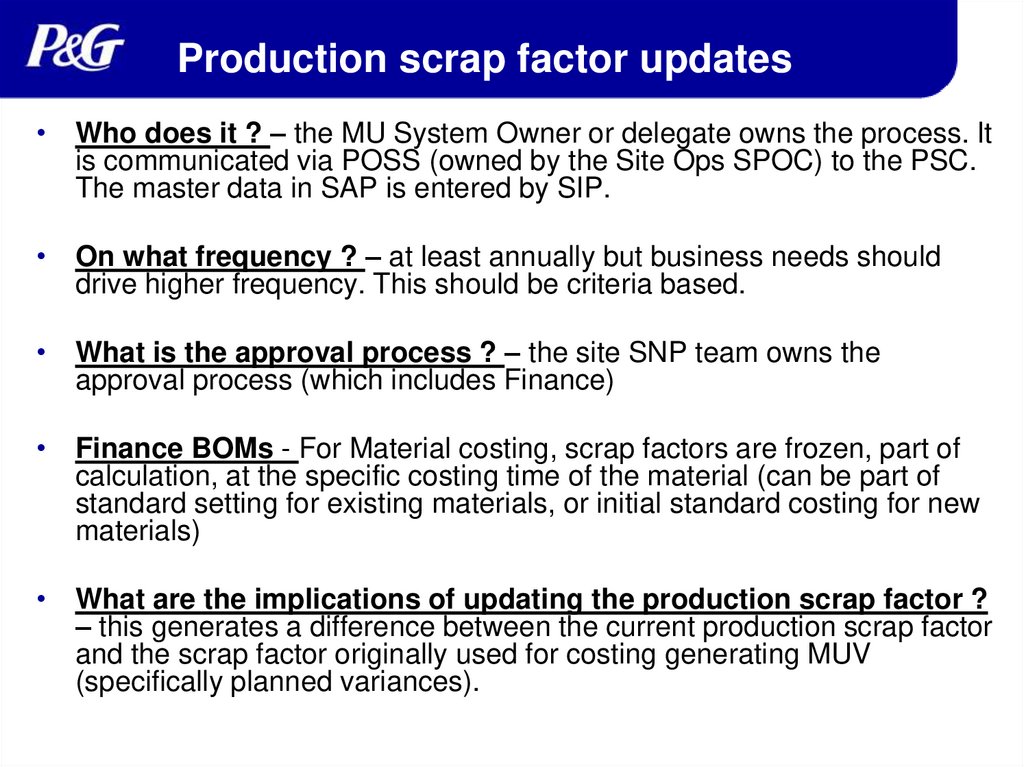
Production scrap factor updates• Who does it ? – the MU System Owner or delegate owns the process. It
is communicated via POSS (owned by the Site Ops SPOC) to the PSC.
The master data in SAP is entered by SIP.
• On what frequency ? – at least annually but business needs should
drive higher frequency. This should be criteria based.
• What is the approval process ? – the site SNP team owns the
approval process (which includes Finance)
• Finance BOMs - For Material costing, scrap factors are frozen, part of
calculation, at the specific costing time of the material (can be part of
standard setting for existing materials, or initial standard costing for new
materials)
• What are the implications of updating the production scrap factor ?
– this generates a difference between the current production scrap factor
and the scrap factor originally used for costing generating MUV
(specifically planned variances).
52.
POs amended after month end• Process orders should not be adjusted in previous
periods after the period is closed
• Unlocking the period creates financial risk and often the
complexity of correcting a process order is not fully
understood by those performing this task leading to
increased errors not less
• In practice this can sometimes happen and there are no
SAP restrictions to prevent this
• The implication of making changes to closed periods is
that your actual MU results for those months will
change. As the PSF1 reports do not re-run the data for
older periods, these adjustments will pass unseen in
your actuals
53.
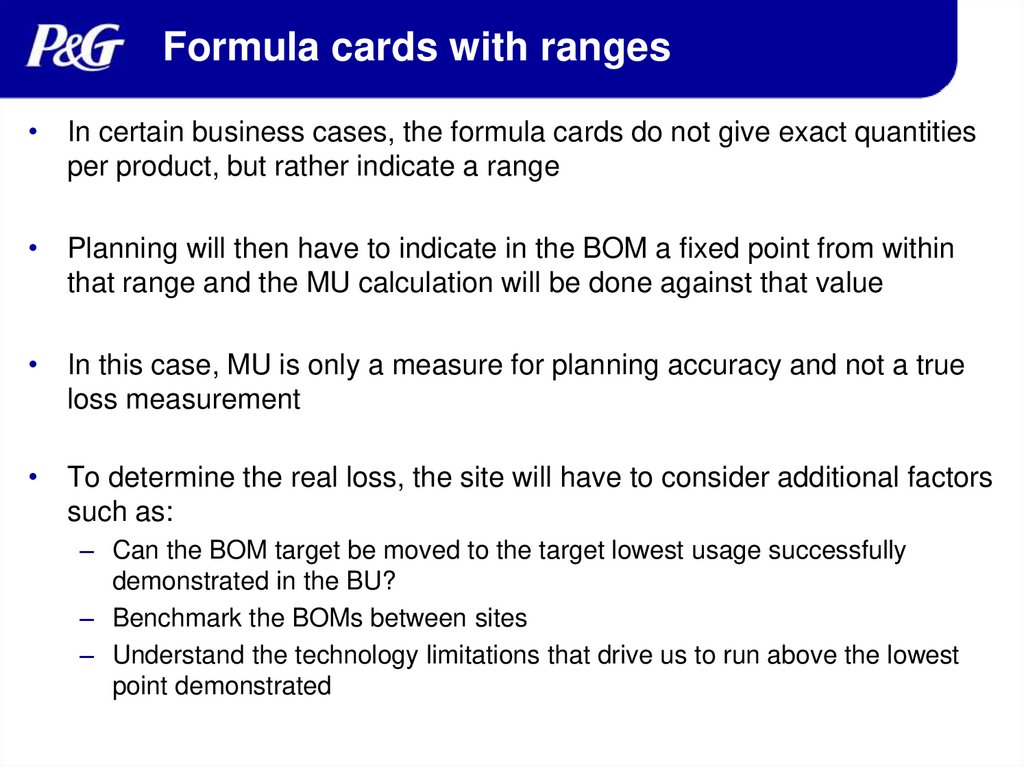
Formula cards with ranges• In certain business cases, the formula cards do not give exact quantities
per product, but rather indicate a range
• Planning will then have to indicate in the BOM a fixed point from within
that range and the MU calculation will be done against that value
• In this case, MU is only a measure for planning accuracy and not a true
loss measurement
• To determine the real loss, the site will have to consider additional factors
such as:
– Can the BOM target be moved to the target lowest usage successfully
demonstrated in the BU?
– Benchmark the BOMs between sites
– Understand the technology limitations that drive us to run above the lowest
point demonstrated
54.
Accounting for Pre-production• Pre-production costs = plant costs incurred in the
start-up of a new asset. These are costs that would
not be chargeable to an Appropriation (>500$M
capital spending) or Construction A.E (<500$M).
• The standard work process for this is to GI materials
used to cost centers (GMC pre-production if
Appropriation level or MOE if AE level). Implications:
– 100% of the cost of materials used in preproduction will
be expensed and show up in PCC
– There is no impact to the site MU, as the full cost ends
up in a cost center
55.
Accounting for EOs• EOs can be used for products in the first 2 stages of the
product development cycle :
– Product Making & Product Testing
– Development Completion
• EOs require the use of 2 specific tools :
1. PIDV process orders (only used in these cases)
2. UNBW materials and finished products
– Specific codes intended for material tracking but with 0 financial value
– Products and component material codes that are not yet qualified for
production
– At GR the value of received material will be posted (expensed ) to the
Cost Center defined in the PO and not to inventory – hence 0 inv value
• When EOs are executed this way there is no MU impact (as
the materials have no value in SAP)
– More detailed guidance on the EO process is available here ->
56.
ReblendDefinition: Source material is treated as a component material.
The source material will be issued to a process order to document
consumption (261 movements).
There are three ways this can be managed. Frequency of
occurrence, material supply work processes and Quality
requirements will dictate the choice:
• A unique Production Version (with a BOM containing the
reblend material) is created for re-blending.
• The Process/Planned Order’s material list is modified by SIP
to contain the reblend material prior to the Order being
released.
• The source material is goods issued to the process order
without modifying the production version or material list.
57.
The Impact on MU of Reblend• The impact on MU will vary depending on a number of
factors: planning, costing and actual execution
Process order set-up
Impact on MU
Unplanned reblend material costed at the
value of the output production (FP)
0 MU impact for the total process order
BUT creates MU variances by material
Unplanned reblend material costed
below/over the value of the output
production (FP)
MU help/hurt is generated on the
process order AND MU variances by
material
Planned reblend costed at the value of the 0 MU impact for the total process order
material it replaces and the BOM
AND 0 MU impact by material
quantities are adjusted accordingly
• Key take-away: the distorting effect on MU of reblend can be
avoided by proper planning
• Resources for further study:
58.
MU and the IWS progressionIn the current IWS phase progression only looks at 2
criteria:
1. The site MU is within 98-102% MU AND
2. That there is a $ loss limit established with action plan
(MU is not classified as a ‘go /no-go criteria’)
Potential directions for future changes to the MU
integration into IWS:
1. $M loss improvement goal
2. Tighter MU% ranges in each phase
3. YoY progress in MU reduction (similar to Plant cost Net
Savings)
59.
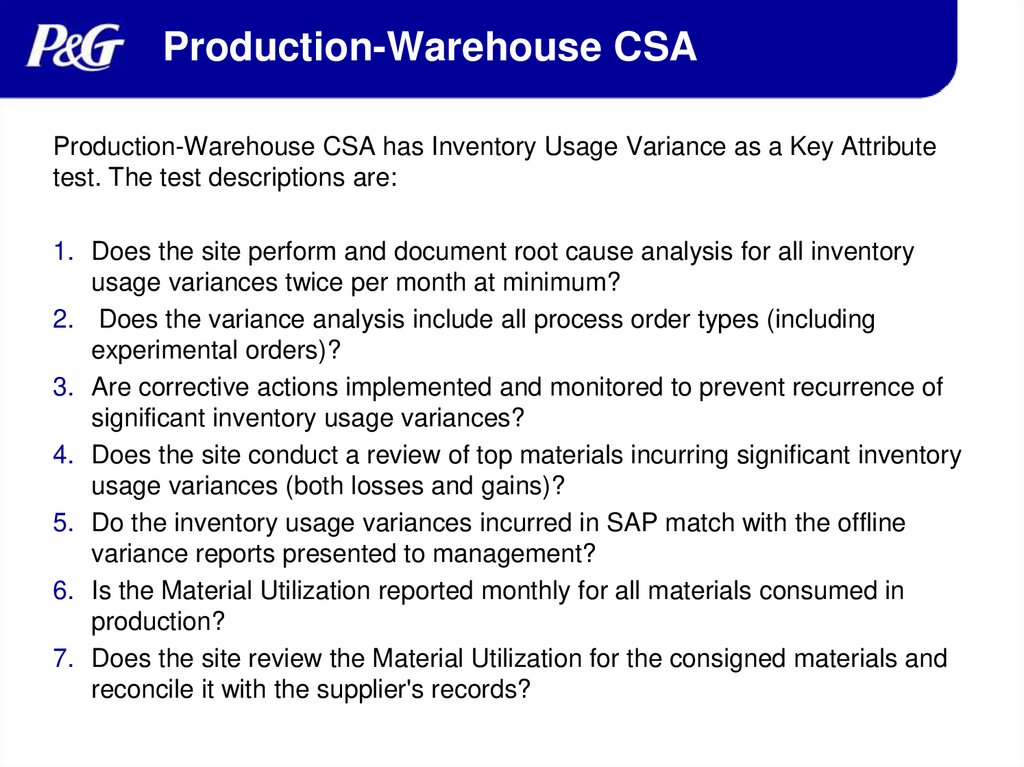
Production-Warehouse CSAProduction-Warehouse CSA has Inventory Usage Variance as a Key Attribute
test. The test descriptions are:
1. Does the site perform and document root cause analysis for all inventory
usage variances twice per month at minimum?
2. Does the variance analysis include all process order types (including
experimental orders)?
3. Are corrective actions implemented and monitored to prevent recurrence of
significant inventory usage variances?
4. Does the site conduct a review of top materials incurring significant inventory
usage variances (both losses and gains)?
5. Do the inventory usage variances incurred in SAP match with the offline
variance reports presented to management?
6. Is the Material Utilization reported monthly for all materials consumed in
production?
7. Does the site review the Material Utilization for the consigned materials and
reconcile it with the supplier's records?
60.
Today’s Agenda1. MU Key Concepts
2. The standard MU reports
3. Basic of production Execution
4. Specific MU Business cases
5. Resources for further study
61.
The Global MU BC team• Global MU contacts:
• Regional MU team:
– NA:
– LA:
– EU:
– IMEA:
– APAC EM:
– APAC FM:
– GC: