


")
")
")
")


 economics
 industry
Similar presentations:

")

")


")


Measuring Manufacturing Production - Singapore
1. Measuring Manufacturing Production - Singapore
Presentation at International Workshop“From Data to Accounts: Measuring
Production in National Accounting”
9 Jun 09
2. Statistical System
Singapore Department of Statistics (SDOS)Central statistical authority responsible for official
statistics on Singapore’s economy and population
Decentralised statistical system
Official statistics collected and compiled by the
SDOS and Research and Statistics Units (RSUs)
in various government ministries and statutory
boards
RSUs specialise in statistics on key areas under
the purview of their parent organisations
3. GDP by Production Approach
Industrial classificationSingapore Standard Industrial Classification
(SSIC) 2005
Based on ISIC Rev. 4
Current base year: 2000
4. Profile of Manufacturing Industry
5.
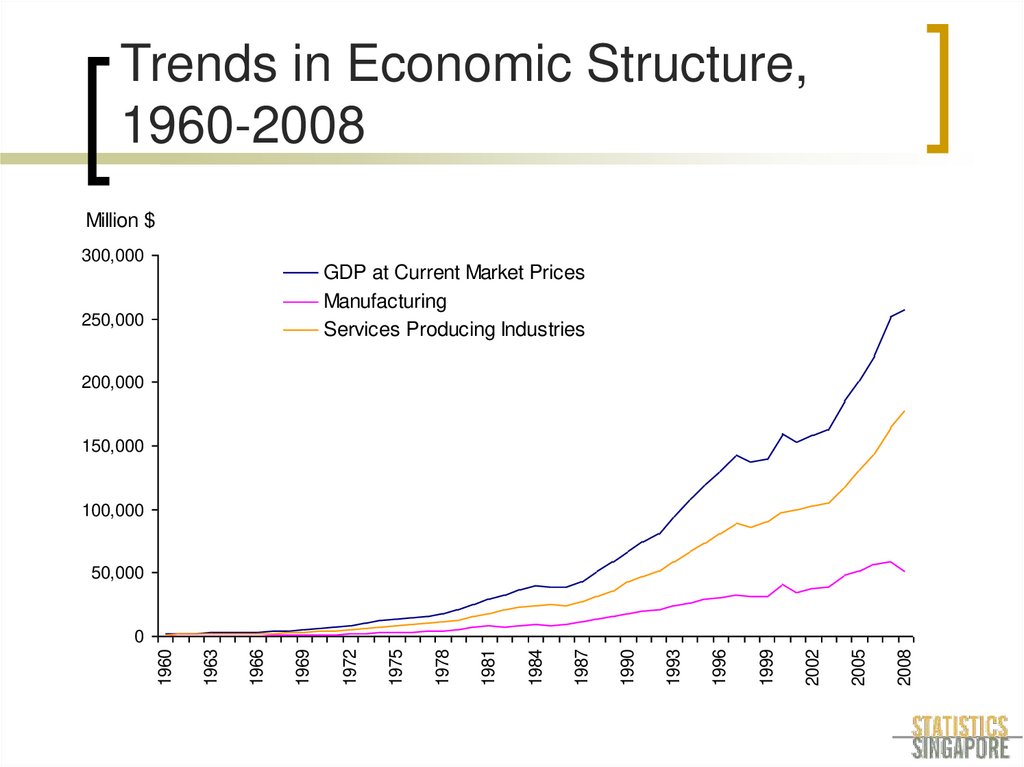
Trends in Economic Structure,1960-2008
Million $
300,000
GDP at Current Market Prices
Manufacturing
Services Producing Industries
250,000
200,000
150,000
100,000
50,000
2008
2005
2002
1999
1996
1993
1990
1987
1984
1981
1978
1975
1972
1969
1966
1963
1960
0
6.
GDP by Industry at Current Prices, 20082008
(S$ million)
Share of
GVA (%)
GDP at Current Market Prices
257,418.5
Goods Producing Industries
67,438.1
26.0
Manufacturing
50,275.2
19.4
Construction
13,255.8
5.1
Utilities
3,729.2
1.4
177.9
0.1
Services Producing Industries
178,074.8
68.8
Wholesale & Retail Trade
44,347.7
17.1
Transport & Storage
23,317.5
9.0
Hotels & Restaurants
5,433.5
2.1
Information & Communications
9,612.7
3.7
Financial Services
33,789.4
13.1
Business Services
36,295.6
14.0
Other Services Industries
25,278.4
9.8
Ownership of Dwellings
13,373.3
5.2
Less: FISIM
16,730.1
Gross Value Added At Basic Prices
242,156.1
Add: Taxes on Products
15,262.4
Other Goods Industries
7. Structure of Manufacturing Industry
Major economic sectorChange in structure over time
Manufacturing Clusters
Share of Nominal
Manufacturing VA (%)
1990
2008
Total Manufacturing
100.0
100.0
Electronics
31.1
26.3
Chemicals
16.0
10.2
Biomedical Manufacturing
5.3
22.2
Precision Engineering
16.7
14.0
Transport Engineering
9.4
16.1
General Manufacturing Industries
21.4
11.2
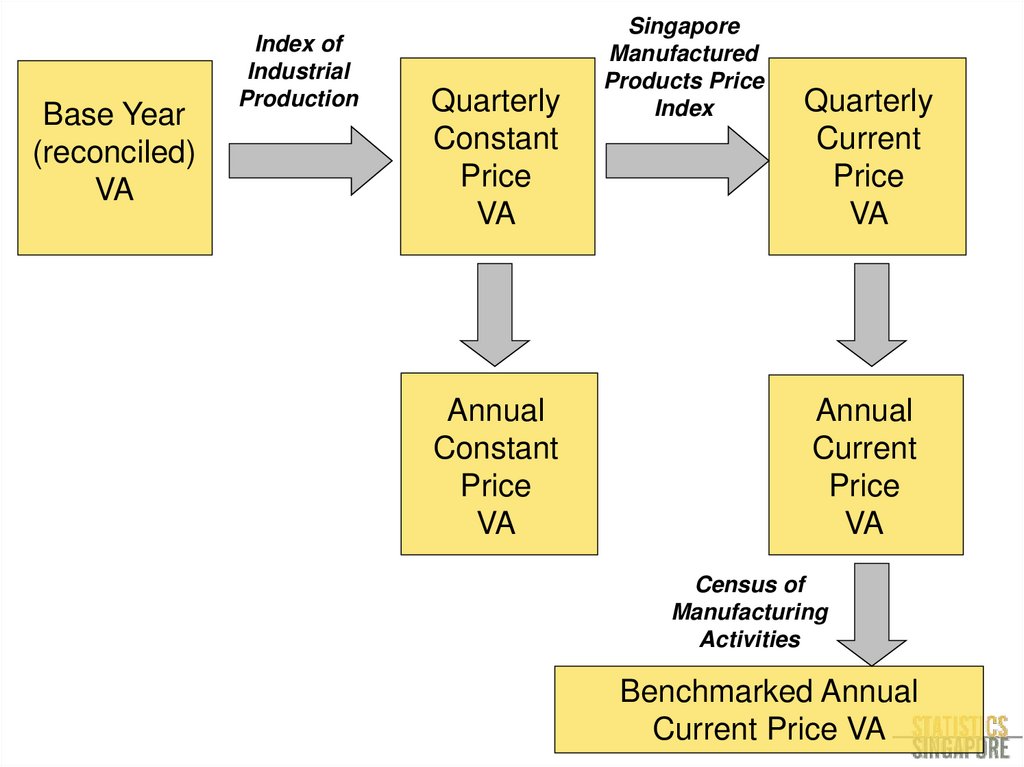
8. Quarterly and Annual VA Compilation
9.
Base Year(reconciled)
VA
Index of
Industrial
Production
Quarterly
Constant
Price
VA
Annual
Constant
Price
VA
Singapore
Manufactured
Products Price
Index
Quarterly
Current
Price
VA
Annual
Current
Price
VA
Census of
Manufacturing
Activities
Benchmarked Annual
Current Price VA
10. Index of Industrial Production (IIP)
Monthly index of real manufacturing outputMain indicator of manufacturing
performance
Available about one month after reference
month
11. Index of Industrial Production (IIP)
Compiled based on a fixed basket ofindustries, commodities and weight-pattern
Rebased about once every 3 - 4 years to
reflect the latest structure of Singapore’s
manufacturing sector
Current base year is 2007
Compiled by RSU in Economic Development
Board
Specialises in manufacturing statistics
12. Singapore Manufactured Products Price Index (SMPPI)
Monthly price index measuring changes inprices of goods produced by local
manufacturers
Available about one month after reference
month
13. Census of Manufacturing Activities (CMA)
Annual current price VA estimates arebenchmarked against CMA
Preliminary principal statistics e.g. total
output, employment and VA are available 2
months after reference year
Breakdown of current price VA into output
and intermediate consumption can be
obtained from CMA
14. Improvements and Challenges
Rapidly changing structure of industryNeed for indicators to remain relevant
Frequent rebasing of IIP
Move towards annual chain-linking of IIP
Improving response rate of surveys by
increasing ease of response
Varied modes of submission via internet, fax etc
Allowing respondents to report in their home
currencies
15. Improvements and Challenges
Difficulties in measuring output for certainindustries
E.g. pharmaceuticals: lumpy production,
changes in product-mix result in volatility in
pharmaceutical output
Lack of suitable price deflators for some
industrial services e.g. ship-building, shiprepairing