


 biology
Similar presentations:


")


Wake-like skin patterning and neural activity during octopus sleep
1.
ArticleWake-like skin patterning and neural activity
during octopus sleep
https://doi.org/10.1038/s41586-023-06203-4
Received: 10 November 2022
Accepted: 11 May 2023
Published online: 28 June 2023
Open access
Check for updates
Aditi Pophale1,5, Kazumichi Shimizu1,5, Tomoyuki Mano1,5, Teresa L. Iglesias2, Kerry Martin1,
Makoto Hiroi1, Keishu Asada1, Paulette García Andaluz1, Thi Thu Van Dinh1,
Leenoy Meshulam3,4 & Sam Reiter1 ✉
While sleeping, many vertebrate groups alternate between at least two sleep stages:
rapid eye movement and slow wave sleep1–4, in part characterized by wake-like and
synchronous brain activity, respectively. Here we delineate neural and behavioural
correlates of two stages of sleep in octopuses, marine invertebrates that evolutionarily
diverged from vertebrates roughly 550 million years ago (ref. 5) and have independently
evolved large brains and behavioural sophistication. ‘Quiet’ sleep in octopuses is
rhythmically interrupted by approximately 60-s bouts of pronounced body
movements and rapid changes in skin patterning and texture6. We show that these
bouts are homeostatically regulated, rapidly reversible and come with increased
arousal threshold, representing a distinct ‘active’ sleep stage. Computational analysis
of active sleep skin patterning reveals diverse dynamics through a set of patterns
conserved across octopuses and strongly resembling those seen while awake. Highdensity electrophysiological recordings from the central brain reveal that the local
field potential (LFP) activity during active sleep resembles that of waking. LFP activity
differs across brain regions, with the strongest activity during active sleep seen in the
superior frontal and vertical lobes, anatomically connected regions associated with
learning and memory function7–10. During quiet sleep, these regions are relatively silent
but generate LFP oscillations resembling mammalian sleep spindles11,12 in frequency
and duration. The range of similarities with vertebrates indicates that aspects of twostage sleep in octopuses may represent convergent features of complex cognition.
Vertebrate rapid eye movements (REMs) and slow wave sleep are characterized by a core set of behavioural and electrophysiological correlates,
and proposed cognitive functions13–15 while showing a rich diversity
of species-specific features15. If the functions ascribed to two-stage
sleep are truly general, then one may expect to find neural and behavioural correlates of two-stage sleep widely among animals showing
complex cognitive abilities. Octopuses are among the largest brained
invertebrates and demonstrate a range of sophisticated behaviours16,
making them ideal for testing the generality of two-stage sleep. Sleeping cephalopods17 have been observed to undergo rhythmic bouts of
body twitches and rapid changes in skin patterning6,18, mediated by
neural control of large populations of skin pigment cells (chromatophores)19 among other specialized cell types20. In octopus, this has
been termed ‘active sleep’ (AS) and is accompanied by an increased
arousal threshold, one of several criteria of sleep15,21. Expanding on
this previous work, we tested whether octopuses possess two stages
of sleep behaviour. We then examined neural activity and skin pattern
dynamics during sleeping and waking, by developing new methods
for behavioural recording and quantification, light-sheet imaging
and LFP recordings using Neuropixels probes in these soft bodied
animals.
Behavioural signatures of sleep
During daylight, nocturnal octopuses (Octopus laqueus22) closed their
eyes, adopting a flat resting posture and a uniformly white skin pattern,
previously described hallmarks of octopus quiet sleep (QS)6,17. Roughly
every 60 min, this behaviour was interrupted by roughly 1-minute periods of rapid transitions through a series of skin patterns (Fig. 1a,b and
Supplementary Videos 1 and 2), accompanied by pronounced eye and
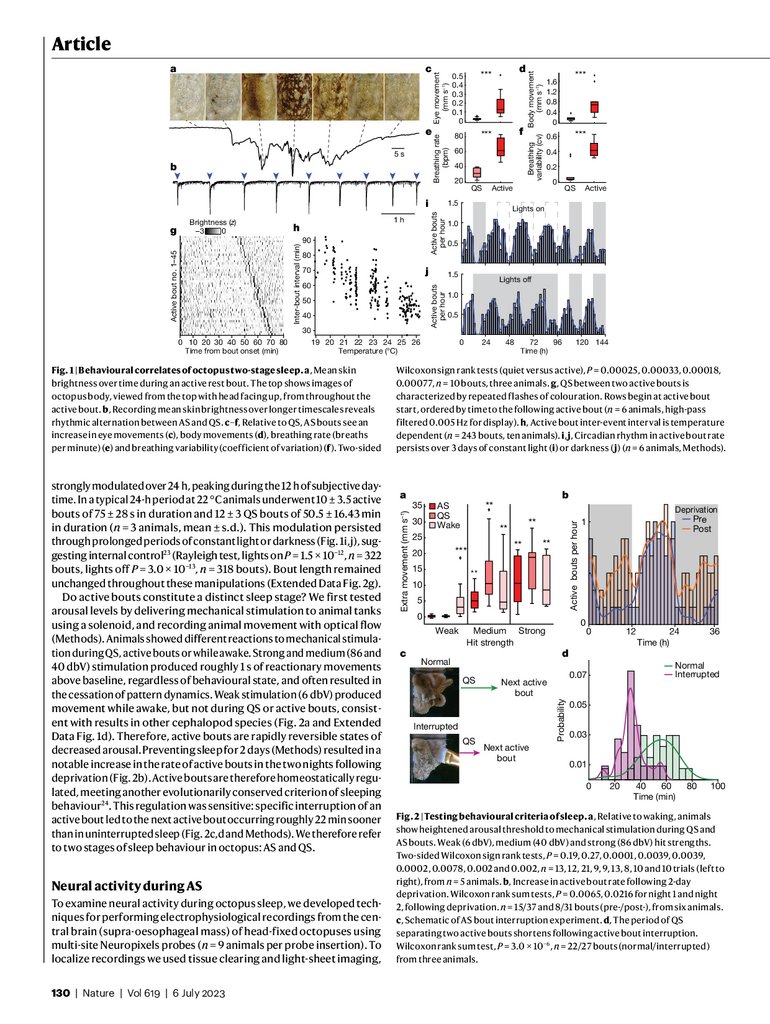
body movements (Fig. 1c,d) and increased breathing rate and arhythmicity (Fig. 1e,f and Extended Data Fig. 1a–c). We quantified patterning behaviour using a convolutional neural network to segment nine
animals from 1,743 h of video, tracking changes in the mean brightness
of octopus skin (Fig. 1a,b and Extended Data Fig. 2a–c). During the QS
separating active bouts, animals generated brief (7.1 ± 0.3 s, n = 1,163
events, six animals) and subtle flashes of colouration with a rate that
decreased over the time interval between active bouts (Fig. 1g and
Extended Data Fig. 2d–f).
The interval between active bouts was dependent on water temperature, with 1-°C increases resulting in roughly 5-minute decreases
between bouts (Fig. 1h, linear model, R2 = 0.55, F-statistic versus constant model 291, P value of 2.33 × 10−43). The rate of active bouts was
1
Computational Neuroethology Unit, Okinawa Institute of Science and Technology (OIST) Graduate University, Okinawa, Japan. 2Marine Animal Research Support Team, Okinawa Institute of
Science and Technology Graduate University, Okinawa, Japan. 3Theoretical Sciences Visiting Program, Okinawa Institute of Science and Technology Graduate University, Okinawa, Japan.
4
Computational Neuroscience Center, University of Washington, Seattle, WA, USA. 5These authors contributed equally: Aditi Pophale, Kazumichi Shimizu, Tomoyuki Mano. ✉e-mail: samuel.
[email protected]
Nature | Vol 619 | 6 July 2023 | 129
2.
e5s
b
0.5
0.4
0.3
0.2
0.1
0
***
80
***
i
90
80
j
70
50
40
30
20
Neural activity during AS
To examine neural activity during octopus sleep, we developed techniques for performing electrophysiological recordings from the central brain (supra-oesophageal mass) of head-fixed octopuses using
multi-site Neuropixels probes (n = 9 animals per probe insertion). To
localize recordings we used tissue clearing and light-sheet imaging,
***
0.6
0.4
0.2
Active
0
QS
Active
Lights on
1.0
0.5
Lights off
1.0
0.5
0
24
48
72
96
Time (h)
120 144
Wilcoxon sign rank tests (quiet versus active), P = 0.00025, 0.00033, 0.00018,
0.00077, n = 10 bouts, three animals. g, QS between two active bouts is
characterized by repeated flashes of colouration. Rows begin at active bout
start, ordered by time to the following active bout (n = 6 animals, high-pass
filtered 0.005 Hz for display). h, Active bout inter-event interval is temperature
dependent (n = 243 bouts, ten animals). i,j, Circadian rhythm in active bout rate
persists over 3 days of constant light (i) or darkness ( j) (n = 6 animals, Methods).
a
35
30
**
**
10
5
0
Weak
c
**
***
15
**
**
25
20
b
**
AS
QS
Wake
Active bouts per hour
strongly modulated over 24 h, peaking during the 12 h of subjective daytime. In a typical 24-h period at 22 °C animals underwent 10 ± 3.5 active
bouts of 75 ± 28 s in duration and 12 ± 3 QS bouts of 50.5 ± 16.43 min
in duration (n = 3 animals, mean ± s.d.). This modulation persisted
through prolonged periods of constant light or darkness (Fig. 1i,j), suggesting internal control23 (Rayleigh test, lights on P = 1.5 × 10⁻¹², n = 322
bouts, lights off P = 3.0 × 10⁻¹³, n = 318 bouts). Bout length remained
unchanged throughout these manipulations (Extended Data Fig. 2g).
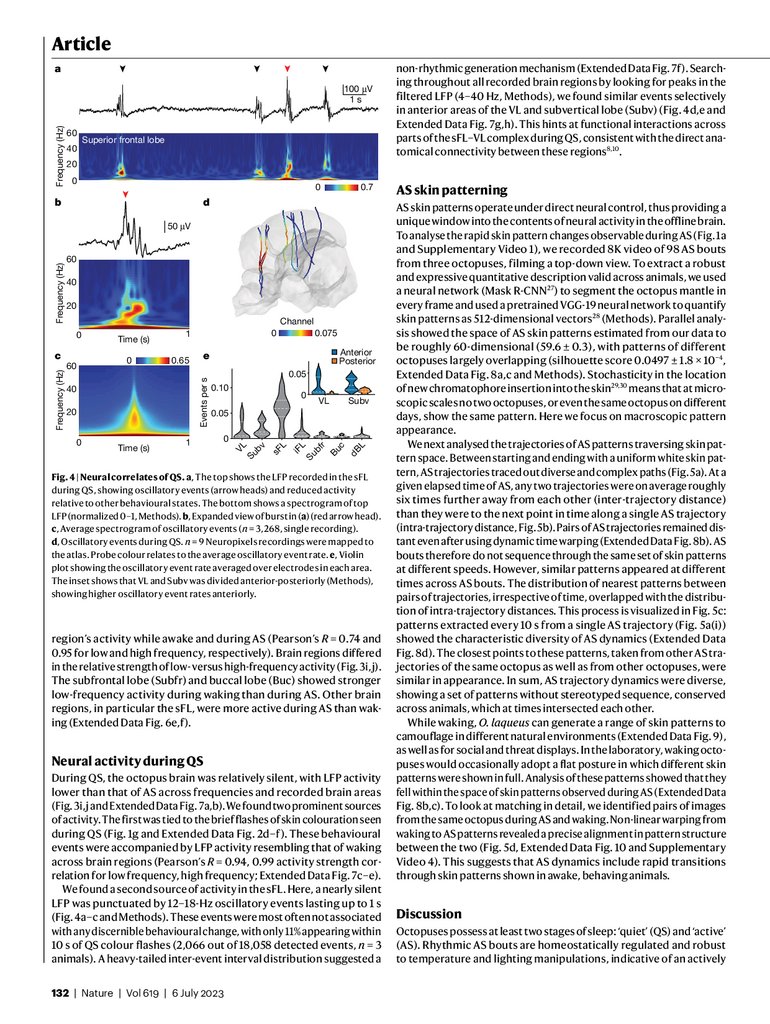
Do active bouts constitute a distinct sleep stage? We first tested
arousal levels by delivering mechanical stimulation to animal tanks
using a solenoid, and recording animal movement with optical flow
(Methods). Animals showed different reactions to mechanical stimulation during QS, active bouts or while awake. Strong and medium (86 and
40 dbV) stimulation produced roughly 1 s of reactionary movements
above baseline, regardless of behavioural state, and often resulted in
the cessation of pattern dynamics. Weak stimulation (6 dbV) produced
movement while awake, but not during QS or active bouts, consistent with results in other cephalopod species (Fig. 2a and Extended
Data Fig. 1d). Therefore, active bouts are rapidly reversible states of
decreased arousal. Preventing sleep for 2 days (Methods) resulted in a
notable increase in the rate of active bouts in the two nights following
deprivation (Fig. 2b). Active bouts are therefore homeostatically regulated, meeting another evolutionarily conserved criterion of sleeping
behaviour24. This regulation was sensitive: specific interruption of an
active bout led to the next active bout occurring roughly 22 min sooner
than in uninterrupted sleep (Fig. 2c,d and Methods). We therefore refer
to two stages of sleep behaviour in octopus: AS and QS.
QS
***
1.6
1.2
0.8
0.4
0
Medium Strong
Hit strength
Normal
QS
QS
Next active
bout
0
12
24
36
Time (h)
d
Normal
Interrupted
0.07
Next active
bout
Interrupted
Deprivation
Pre
Post
1
0
Probability
Fig. 1 | Behavioural correlates of octopus two-stage sleep. a, Mean skin
brightness over time during an active rest bout. The top shows images of
octopus body, viewed from the top with head facing up, from throughout the
active bout. b, Recording mean skin brightness over longer timescales reveals
rhythmic alternation between AS and QS. c–f, Relative to QS, AS bouts see an
increase in eye movements (c), body movements (d), breathing rate (breaths
per minute) (e) and breathing variability (coefficient of variation) (f). Two-sided
130 | Nature | Vol 619 | 6 July 2023
40
19 20 21 22 23 24 25 26
Temperature (°C)
Extra movement (mm s–1)
0 10 20 30 40 50 60 70 80
Time from bout onset (min)
60
1.5
Active bouts
per hour
60
f
1.5
Active bouts
per hour
1h
h
Inter-bout interval (min)
Active bout no. 1–45
g
Brightness (z)
–3
0
d
Body movement
Breathing
(mm s–1)
variability (cv)
c
Eye movement
(mm s–1)
a
Breathing rate
(bpm)
Article
0.05
0.03
0.01
0
20
40
60
Time (min)
80
100
Fig. 2 | Testing behavioural criteria of sleep. a, Relative to waking, animals
show heightened arousal threshold to mechanical stimulation during QS and
AS bouts. Weak (6 dbV), medium (40 dbV) and strong (86 dbV) hit strengths.
Two-sided Wilcoxon sign rank tests, P = 0.19, 0.27, 0.0001, 0.0039, 0.0039,
0.0002, 0.0078, 0.002 and 0.002, n = 13, 12, 21, 9, 9, 13, 8, 10 and 10 trials (left to
right), from n = 5 animals. b, Increase in active bout rate following 2-day
deprivation. Wilcoxon rank sum tests, P = 0.0065, 0.0216 for night 1 and night
2, following deprivation. n = 15/37 and 8/31 bouts (pre-/post-), from six animals.
c, Schematic of AS bout interruption experiment. d, The period of QS
separating two active bouts shortens following active bout interruption.
Wilcoxon rank sum test, P = 3.0 × 10 −6, n = 22/27 bouts (normal/interrupted)
from three animals.
3.
Superior frontallobe (sFL)
c
10 s
Subvertical lobe (Subv)
D
Inferior frontal
lobe (iFL)
P
Skin colour (z)
Frequency (Hz)
102
1 mm
Buccal
lobe (Buc)
Dorsal basal lobe (dBL)
Precomissural lobe (Prec)
Anterior basal lobe (aBL)
Subfrontal lobe (Subfr)
103
VL
sFL
102
101
100
Intensity (a.u.)
i
40
60
frequency (Hz)
80
e
100
0.1–10 Hz
AS
QS
Wake
75
50
30
Intensity (a.u.)
AS
g
Wake
f
h
25
0
j
0
0.5
Wavelet transform
AS
QS
Wake
10–1
20
Vertical lobe
101
100
0
Superior frontal lobe
20–150 Hz
20
20–150 Hz
Channel intensity
1
12
Power (dB)
b
d
200 μV
Vertical lobe (VL)
0.1–10 Hz
Channel intensity
1
45
a
10
0
VL
Subv
sFL
iFL
Subfr
Buc
dBL
Fig. 3 | Neural correlates of AS. a, Atlas of the supra-oesophageal mass,
onto which all Neuropixels recordings were mapped. b, LFP power spectrum
during AS, QS and wake taken from sFL (solid lines) and VL (dashed lines).
c,d, Representative LFP signals from sFL (c) and VL (d) at the onset of AS are
shown as the top black lines. The red lines underneath represent mean
skin brightness, showing the behavioural onset of AS. The bottom shows
spectrograms of the corresponding LFP signals (normalized 0–1, Methods)
e,f, LFP signal during AS. n = 9 Neuropixels recordings were mapped to the
atlas. Each probe is coloured with the intensity of low (0.1–10 Hz) (e) and high
(20–150 Hz) (f) frequency oscillations. g,h, LFP signal during the wake phase:
low, 0.1–10 Hz (g) and high, 20–150 Hz (h). i,j, Violin plots showing the intensity
of low- (i) and high- ( j) frequency oscillations during AS, QS and wake phases.
All channels from n = 9 probes were pooled together.
computationally registering all experiments into a three-dimensional
(3D) reference brain atlas that we constructed (Fig. 3a, Extended Data
Figs. 3 and 4, Supplementary Video 3 and Methods). In our brain atlas,
we manually segmented the central brain (supra-oesophogeal mass)
into nine large brain regions, following detailed anatomical reports25,26.
Octopuses fell asleep during neural recordings, showing periods of
QS interrupted by rhythmic AS bouts with duration and interval similar
to those of AS in freely behaving animals (Extended Data Fig. 5). LFP
recordings from the superior frontal lobe (sFL) and vertical lobe (VL),
brain regions associated with learning and memory function7–10, showed
levels of LFP activity that differed according to brain state (Fig. 3b).
In both areas, AS was accompanied by large increases in LFP activity
over that of QS, with waking activity being of intermediate strength. LFP
frequency content differed across regions. The sFL generated activity
over a wide frequency band, including prominent 30-Hz oscillations
(Fig. 3c and Extended Data Fig. 6b–d). By contrast, the VL reliably produced a series of large (up to approximately 700 μV), low-frequency
waveforms (Fig. 3d).
To systematically compare neural activity between AS and waking,
we examined LFP strength across brain regions in a low-frequency
(0.1–10 Hz) and a high-frequency (20–150 Hz) band (Fig. 2e–j and
Methods). In general, there was a strong correlation between a brain
Nature | Vol 619 | 6 July 2023 | 131
4.
Articlea
Frequency (Hz)
100 μV
1s
60
40
Superior frontal lobe
20
0
0
b
0.7
d
60
40
20
Channel
L
dB
c
0
r
1
Subv
Bu
Time (s)
VL
0.05
L
0
0
bf
20
0.05
0.10
Su
40
Anterior
Posterior
e
L
0.65
0.075
iF
0
sF
Frequency (Hz)
60
Time (s)
0
1
VL
Su
bv
0
Events per s
Frequency (Hz)
50 μV
c
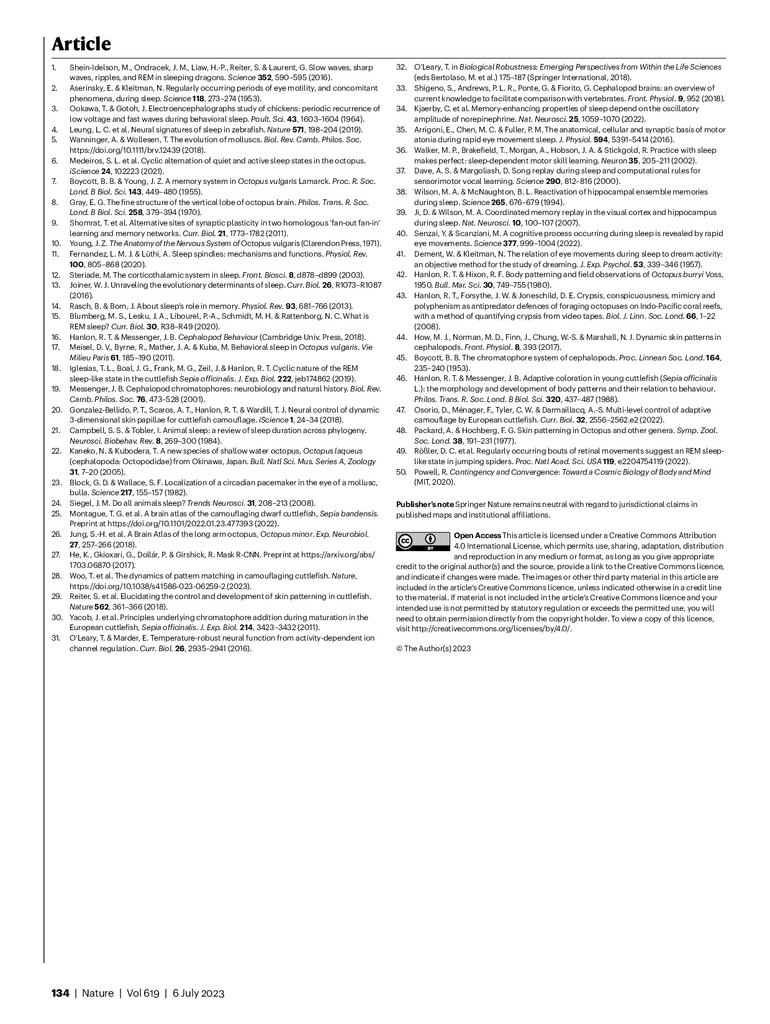
non-rhythmic generation mechanism (Extended Data Fig. 7f). Searching throughout all recorded brain regions by looking for peaks in the
filtered LFP (4–40 Hz, Methods), we found similar events selectively
in anterior areas of the VL and subvertical lobe (Subv) (Fig. 4d,e and
Extended Data Fig. 7g,h). This hints at functional interactions across
parts of the sFL–VL complex during QS, consistent with the direct anatomical connectivity between these regions8,10.
Fig. 4 | Neural correlates of QS. a, The top shows the LFP recorded in the sFL
during QS, showing oscillatory events (arrow heads) and reduced activity
relative to other behavioural states. The bottom shows a spectrogram of top
LFP (normalized 0–1, Methods). b, Expanded view of burst in (a) (red arrow head).
c, Average spectrogram of oscillatory events (n = 3,268, single recording).
d, Oscillatory events during QS. n = 9 Neuropixels recordings were mapped to
the atlas. Probe colour relates to the average oscillatory event rate. e, Violin
plot showing the oscillatory event rate averaged over electrodes in each area.
The inset shows that VL and Subv was divided anterior-posteriorly (Methods),
showing higher oscillatory event rates anteriorly.
region’s activity while awake and during AS (Pearson’s R = 0.74 and
0.95 for low and high frequency, respectively). Brain regions differed
in the relative strength of low- versus high-frequency activity (Fig. 3i,j).
The subfrontal lobe (Subfr) and buccal lobe (Buc) showed stronger
low-frequency activity during waking than during AS. Other brain
regions, in particular the sFL, were more active during AS than waking (Extended Data Fig. 6e,f).
Neural activity during QS
During QS, the octopus brain was relatively silent, with LFP activity
lower than that of AS across frequencies and recorded brain areas
(Fig. 3i,j and Extended Data Fig. 7a,b). We found two prominent sources
of activity. The first was tied to the brief flashes of skin colouration seen
during QS (Fig. 1g and Extended Data Fig. 2d–f). These behavioural
events were accompanied by LFP activity resembling that of waking
across brain regions (Pearson’s R = 0.94, 0.99 activity strength correlation for low frequency, high frequency; Extended Data Fig. 7c–e).
We found a second source of activity in the sFL. Here, a nearly silent
LFP was punctuated by 12–18-Hz oscillatory events lasting up to 1 s
(Fig. 4a–c and Methods). These events were most often not associated
with any discernible behavioural change, with only 11% appearing within
10 s of QS colour flashes (2,066 out of 18,058 detected events, n = 3
animals). A heavy-tailed inter-event interval distribution suggested a
132 | Nature | Vol 619 | 6 July 2023
AS skin patterning
AS skin patterns operate under direct neural control, thus providing a
unique window into the contents of neural activity in the offline brain.
To analyse the rapid skin pattern changes observable during AS (Fig. 1a
and Supplementary Video 1), we recorded 8K video of 98 AS bouts
from three octopuses, filming a top-down view. To extract a robust
and expressive quantitative description valid across animals, we used
a neural network (Mask R-CNN27) to segment the octopus mantle in
every frame and used a pretrained VGG-19 neural network to quantify
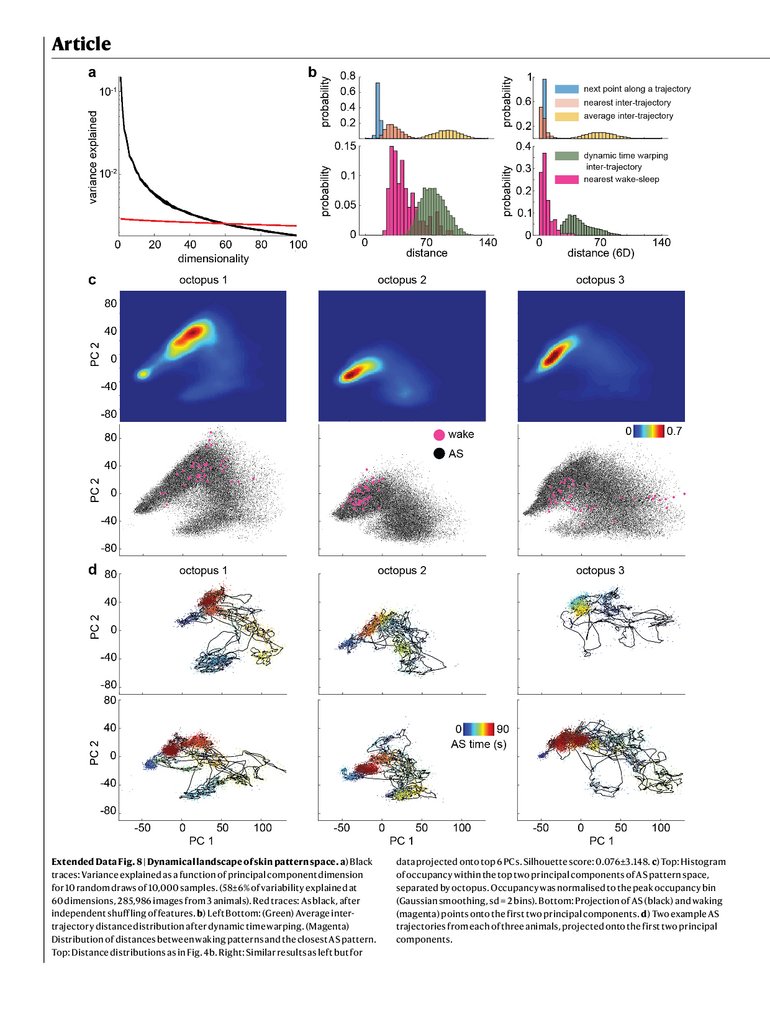
skin patterns as 512-dimensional vectors28 (Methods). Parallel analysis showed the space of AS skin patterns estimated from our data to
be roughly 60-dimensional (59.6 ± 0.3), with patterns of different
octopuses largely overlapping (silhouette score 0.0497 ± 1.8 × 10⁻⁴,
Extended Data Fig. 8a,c and Methods). Stochasticity in the location
of new chromatophore insertion into the skin29,30 means that at microscopic scales no two octopuses, or even the same octopus on different
days, show the same pattern. Here we focus on macroscopic pattern
appearance.
We next analysed the trajectories of AS patterns traversing skin pattern space. Between starting and ending with a uniform white skin pattern, AS trajectories traced out diverse and complex paths (Fig. 5a). At a
given elapsed time of AS, any two trajectories were on average roughly
six times further away from each other (inter-trajectory distance)
than they were to the next point in time along a single AS trajectory
(intra-trajectory distance, Fig. 5b). Pairs of AS trajectories remained distant even after using dynamic time warping (Extended Data Fig. 8b). AS
bouts therefore do not sequence through the same set of skin patterns
at different speeds. However, similar patterns appeared at different
times across AS bouts. The distribution of nearest patterns between
pairs of trajectories, irrespective of time, overlapped with the distribution of intra-trajectory distances. This process is visualized in Fig. 5c:
patterns extracted every 10 s from a single AS trajectory (Fig. 5a(i))
showed the characteristic diversity of AS dynamics (Extended Data
Fig. 8d). The closest points to these patterns, taken from other AS trajectories of the same octopus as well as from other octopuses, were
similar in appearance. In sum, AS trajectory dynamics were diverse,
showing a set of patterns without stereotyped sequence, conserved
across animals, which at times intersected each other.
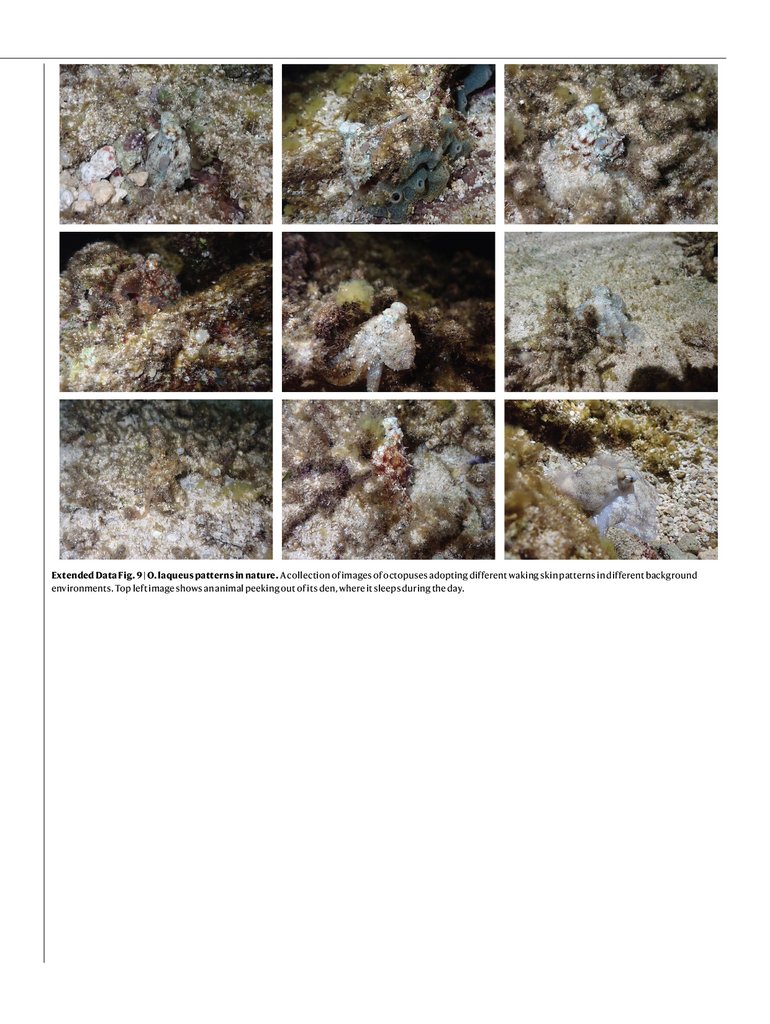
While waking, O. laqueus can generate a range of skin patterns to
camouflage in different natural environments (Extended Data Fig. 9),
as well as for social and threat displays. In the laboratory, waking octopuses would occasionally adopt a flat posture in which different skin
patterns were shown in full. Analysis of these patterns showed that they
fell within the space of skin patterns observed during AS (Extended Data
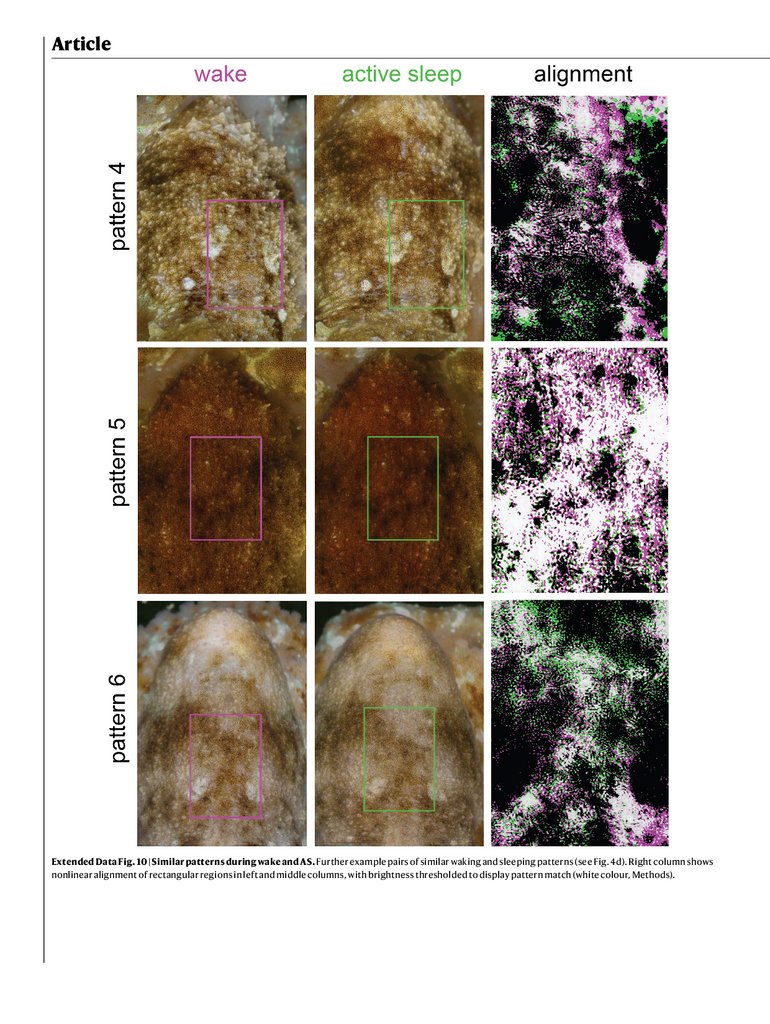
Fig. 8b,c). To look at matching in detail, we identified pairs of images
from the same octopus during AS and waking. Non-linear warping from
waking to AS patterns revealed a precise alignment in pattern structure
between the two (Fig. 5d, Extended Data Fig. 10 and Supplementary
Video 4). This suggests that AS dynamics include rapid transitions
through skin patterns shown in awake, behaving animals.
Discussion
Octopuses possess at least two stages of sleep: ‘quiet’ (QS) and ‘active’
(AS). Rhythmic AS bouts are homeostatically regulated and robust
to temperature and lighting manipulations, indicative of an actively
5.
0–20
–20
–40
–40
–60
–60
50
PC 1
100
–50
0
Time (s)
83
0
0.4
50
0
100
PC 1
Octopus 1
Octopus 2
Octopus 3
Nearest pattern, different trajectory
0.6
0.2
Octopus 1
seed trajectory
0
Next point along a trajectory
Nearest inter-trajectory
Average inter-trajectory
d
0
40
80
120
Pattern distance
Wake
Active sleep
Alignment
Pattern 1
0
Probability
20
PC 2
20
PC 2
40
c
0.8
60
40
–50
b
(ii)
(i)
Pattern 2
60
Pattern 3
a
Fig. 5 | Dynamics of AS skin patterning. a, Two example AS bout trajectories
((i) and (ii)) projected onto the first two principal components of AS pattern
space. Large dots in (i) show points sampled every 10 s from throughout the
trajectory. b, Histograms showing distributions of pattern distances between
(blue) nearest points in time along a trajectory, (pink) nearest points between
trajectories, and (yellow) inter-trajectory distance at 0 time lag. Values are
averages over AS bouts. c, The top row shows octopus 1 skin patterns at 10-s
intervals along the trajectory in a (i). The bottom rows show nearest skin patterns
to each image in the top seed trajectory, for other trajectories of octopus 1 and
for other octopuses. d, Example pairs of similar waking and sleeping patterns.
The right column shows non-linear alignment of rectangular regions in the left
and middle columns, with brightness thresholded to show pattern match
(white colour, Methods).
maintained biological phenomenon of central importance31,32. QS
shows 12–18-Hz oscillations in areas associated with learning and
memory (the frontal-VL system)7–10,33, resembling mammalian sleep
spindles in frequency and duration11,12. However, QS seems to differ from
vertebrate slow wave sleep in showing no low-frequency oscillations
entraining large areas of the brain12. The brief flashes of colouration
seen during QS are accompanied by neural activity levels resembling
waking, albeit at lower amplitude. Whether this constitutes brief periods of waking, micro-arousal states34, a kind of QS or a distinct sleep
stage remains unclear. AS resembles vertebrate REM sleep in terms
of wake-like neural activity accompanying eye and body twitches15,35.
Coordinated postural changes (for example, arm reaching) are not
seen during AS, potentially indicating some level of muscular inhibition. However, a lack of anatomical homology complicates comparison with the atonia of skeletal muscles found in vertebrate REM
sleep35. Future work will investigate the depth of these similarities
mechanistically.
Furthermore, during AS octopuses rapidly transition through sets
of skin patterns that strongly resemble those seen while awake. This
normally occurs in the safety of the octopus den, and therefore does not
broadcast the animal’s position to predators. Why do octopuses perform this pronounced sleep behaviour? One possibility is that it represents periods of offline refinement of skin pattern control, analogous
to processes thought to occur during vertebrate motor learning36,37.
Another possibility is that it reflects the reactivation of neural activity
underlying waking experience more broadly, reminiscent of vertebrate
phenomena linked to memory consolidation such as rodent hippocampal replay38,39 and the structured activity in the head direction system
during mammalian REM sleep40,41. Full investigation of the function of
AS will require studying whether patterns can be manipulated, as well
as a greater understanding of the ethological context in which waking
skin patterns are expressed42–44.
Cephalopod skin patterns seem to be organized hierarchically,
with putative higher-order motor control circuitry coordinating
large groups of chromatophores to generate macroscopic pattern
elements19,29,45–48. AS dynamics are consistent with the pseudo-random
activation of this high-level control system. It may be possible to
infer interactions between motor control elements by studying
the statistics of pattern activation. In this way, AS dynamics may
also be useful for understanding the logic of waking skin pattern
control.
While initially observed in humans2, recent work has established
two-stage sleep across many vertebrate species1–4. Our results complement several behavioural reports in cephalopods6,18 and arthropods49
of similar active and QS stages. Given the evolutionary distances, these
phenomena probably evolved independently from each other, and may
represent convergent solutions to shared problems facing complex
agents50. If such solutions indeed exist, then the high-dimensional and
interpretable readout of neural activity in octopus AS skin patterns may
help to uncover general principles of two-stage sleep.
Online content
Any methods, additional references, Nature Portfolio reporting summaries, source data, extended data, supplementary information, acknowledgements, peer review information; details of author contributions
and competing interests; and statements of data and code availability
are available at https://doi.org/10.1038/s41586-023-06203-4.
Nature | Vol 619 | 6 July 2023 | 133
6.
Article1.
2.
3.
4.
5.
6.
7.
8.
9.
10.
11.
12.
13.
14.
15.
16.
17.
18.
19.
20.
21.
22.
23.
24.
25.
26.
27.
28.
29.
30.
31.
Shein-Idelson, M., Ondracek, J. M., Liaw, H.-P., Reiter, S. & Laurent, G. Slow waves, sharp
waves, ripples, and REM in sleeping dragons. Science 352, 590–595 (2016).
Aserinsky, E. & Kleitman, N. Regularly occurring periods of eye motility, and concomitant
phenomena, during sleep. Science 118, 273–274 (1953).
Ookawa, T. & Gotoh, J. Electroencephalographs study of chickens: periodic recurrence of
low voltage and fast waves during behavioral sleep. Poult. Sci. 43, 1603–1604 (1964).
Leung, L. C. et al. Neural signatures of sleep in zebrafish. Nature 571, 198–204 (2019).
Wanninger, A. & Wollesen, T. The evolution of molluscs. Biol. Rev. Camb. Philos. Soc.
https://doi.org/10.1111/brv.12439 (2018).
Medeiros, S. L. et al. Cyclic alternation of quiet and active sleep states in the octopus.
iScience 24, 102223 (2021).
Boycott, B. B. & Young, J. Z. A memory system in Octopus vulgaris Lamarck. Proc. R. Soc.
Lond. B Biol. Sci. 143, 449–480 (1955).
Gray, E. G. The fine structure of the vertical lobe of octopus brain. Philos. Trans. R. Soc.
Lond. B Biol. Sci. 258, 379–394 (1970).
Shomrat, T. et al. Alternative sites of synaptic plasticity in two homologous ‘fan-out fan-in’
learning and memory networks. Curr. Biol. 21, 1773–1782 (2011).
Young, J. Z. The Anatomy of the Nervous System of Octopus vulgaris (Clarendon Press, 1971).
Fernandez, L. M. J. & Lüthi, A. Sleep spindles: mechanisms and functions. Physiol. Rev.
100, 805–868 (2020).
Steriade, M. The corticothalamic system in sleep. Front. Biosci. 8, d878–d899 (2003).
Joiner, W. J. Unraveling the evolutionary determinants of sleep. Curr. Biol. 26, R1073–R1087
(2016).
Rasch, B. & Born, J. About sleep’s role in memory. Physiol. Rev. 93, 681–766 (2013).
Blumberg, M. S., Lesku, J. A., Libourel, P.-A., Schmidt, M. H. & Rattenborg, N. C. What is
REM sleep? Curr. Biol. 30, R38–R49 (2020).
Hanlon, R. T. & Messenger, J. B. Cephalopod Behaviour (Cambridge Univ. Press, 2018).
Meisel, D. V., Byrne, R., Mather, J. A. & Kuba, M. Behavioral sleep in Octopus vulgaris. Vie
Milieu Paris 61, 185–190 (2011).
Iglesias, T. L., Boal, J. G., Frank, M. G., Zeil, J. & Hanlon, R. T. Cyclic nature of the REM
sleep-like state in the cuttlefish Sepia officinalis. J. Exp. Biol. 222, jeb174862 (2019).
Messenger, J. B. Cephalopod chromatophores: neurobiology and natural history. Biol. Rev.
Camb. Philos. Soc. 76, 473–528 (2001).
Gonzalez-Bellido, P. T., Scaros, A. T., Hanlon, R. T. & Wardill, T. J. Neural control of dynamic
3-dimensional skin papillae for cuttlefish camouflage. iScience 1, 24–34 (2018).
Campbell, S. S. & Tobler, I. Animal sleep: a review of sleep duration across phylogeny.
Neurosci. Biobehav. Rev. 8, 269–300 (1984).
Kaneko, N. & Kubodera, T. A new species of shallow water octopus, Octopus laqueus
(cephalopoda: Octopodidae) from Okinawa, Japan. Bull. Natl Sci. Mus. Series A, Zoology
31, 7–20 (2005).
Block, G. D. & Wallace, S. F. Localization of a circadian pacemaker in the eye of a mollusc,
bulla. Science 217, 155–157 (1982).
Siegel, J. M. Do all animals sleep? Trends Neurosci. 31, 208–213 (2008).
Montague, T. G. et al. A brain atlas of the camouflaging dwarf cuttlefish, Sepia bandensis.
Preprint at https://doi.org/10.1101/2022.01.23.477393 (2022).
Jung, S.-H. et al. A Brain Atlas of the long arm octopus, Octopus minor. Exp. Neurobiol.
27, 257–266 (2018).
He, K., Gkioxari, G., Dollár, P. & Girshick, R. Mask R-CNN. Preprint at https://arxiv.org/abs/
1703.06870 (2017).
Woo, T. et al. The dynamics of pattern matching in camouflaging cuttlefish. Nature,
https://doi.org/10.1038/s41586-023-06259-2 (2023).
Reiter, S. et al. Elucidating the control and development of skin patterning in cuttlefish.
Nature 562, 361–366 (2018).
Yacob, J. et al. Principles underlying chromatophore addition during maturation in the
European cuttlefish, Sepia officinalis. J. Exp. Biol. 214, 3423–3432 (2011).
O’Leary, T. & Marder, E. Temperature-robust neural function from activity-dependent ion
channel regulation. Curr. Biol. 26, 2935–2941 (2016).
134 | Nature | Vol 619 | 6 July 2023
32. O’Leary, T. in Biological Robustness: Emerging Perspectives from Within the Life Sciences
(eds Bertolaso, M. et al.) 175–187 (Springer International, 2018).
33. Shigeno, S., Andrews, P. L. R., Ponte, G. & Fiorito, G. Cephalopod brains: an overview of
current knowledge to facilitate comparison with vertebrates. Front. Physiol. 9, 952 (2018).
34. Kjaerby, C. et al. Memory-enhancing properties of sleep depend on the oscillatory
amplitude of norepinephrine. Nat. Neurosci. 25, 1059–1070 (2022).
35. Arrigoni, E., Chen, M. C. & Fuller, P. M. The anatomical, cellular and synaptic basis of motor
atonia during rapid eye movement sleep. J. Physiol. 594, 5391–5414 (2016).
36. Walker, M. P., Brakefield, T., Morgan, A., Hobson, J. A. & Stickgold, R. Practice with sleep
makes perfect: sleep-dependent motor skill learning. Neuron 35, 205–211 (2002).
37. Dave, A. S. & Margoliash, D. Song replay during sleep and computational rules for
sensorimotor vocal learning. Science 290, 812–816 (2000).
38. Wilson, M. A. & McNaughton, B. L. Reactivation of hippocampal ensemble memories
during sleep. Science 265, 676–679 (1994).
39. Ji, D. & Wilson, M. A. Coordinated memory replay in the visual cortex and hippocampus
during sleep. Nat. Neurosci. 10, 100–107 (2007).
40. Senzai, Y. & Scanziani, M. A cognitive process occurring during sleep is revealed by rapid
eye movements. Science 377, 999–1004 (2022).
41. Dement, W. & Kleitman, N. The relation of eye movements during sleep to dream activity:
an objective method for the study of dreaming. J. Exp. Psychol. 53, 339–346 (1957).
42. Hanlon, R. T. & Hixon, R. F. Body patterning and field observations of Octopus burryi Voss,
1950. Bull. Mar. Sci. 30, 749–755 (1980).
43. Hanlon, R. T., Forsythe, J. W. & Joneschild, D. E. Crypsis, conspicuousness, mimicry and
polyphenism as antipredator defences of foraging octopuses on Indo-Pacific coral reefs,
with a method of quantifying crypsis from video tapes. Biol. J. Linn. Soc. Lond. 66, 1–22
(2008).
44. How, M. J., Norman, M. D., Finn, J., Chung, W.-S. & Marshall, N. J. Dynamic skin patterns in
cephalopods. Front. Physiol. 8, 393 (2017).
45. Boycott, B. B. The chromatophore system of cephalopods. Proc. Linnean Soc. Lond. 164,
235–240 (1953).
46. Hanlon, R. T. & Messenger, J. B. Adaptive coloration in young cuttlefish (Sepia officinalis
L.): the morphology and development of body patterns and their relation to behaviour.
Philos. Trans. R. Soc. Lond. B Biol. Sci. 320, 437–487 (1988).
47. Osorio, D., Ménager, F., Tyler, C. W. & Darmaillacq, A.-S. Multi-level control of adaptive
camouflage by European cuttlefish. Curr. Biol. 32, 2556–2562.e2 (2022).
48. Packard, A. & Hochberg, F. G. Skin patterning in Octopus and other genera. Symp. Zool.
Soc. Lond. 38, 191–231 (1977).
49. Rößler, D. C. et al. Regularly occurring bouts of retinal movements suggest an REM sleeplike state in jumping spiders. Proc. Natl Acad. Sci. USA 119, e2204754119 (2022).
50. Powell, R. Contingency and Convergence: Toward a Cosmic Biology of Body and Mind
(MIT, 2020).
Publisher’s note Springer Nature remains neutral with regard to jurisdictional claims in
published maps and institutional affiliations.
Open Access This article is licensed under a Creative Commons Attribution
4.0 International License, which permits use, sharing, adaptation, distribution
and reproduction in any medium or format, as long as you give appropriate
credit to the original author(s) and the source, provide a link to the Creative Commons licence,
and indicate if changes were made. The images or other third party material in this article are
included in the article’s Creative Commons licence, unless indicated otherwise in a credit line
to the material. If material is not included in the article’s Creative Commons licence and your
intended use is not permitted by statutory regulation or exceeds the permitted use, you will
need to obtain permission directly from the copyright holder. To view a copy of this licence,
visit http://creativecommons.org/licenses/by/4.0/.
© The Author(s) 2023
7.
MethodsExperimental animals
All research and animal care procedures were carried out in accordance
with institutional guidelines, approved by the OIST Animal Care and Use
Committee under approval numbers 2019-244-6 and 2022-364. Adult
octopuses (O. laqueus, mantle length roughly 3 cm) of both sexes were
collected in Okinawan tidal pools and housed in 12 l tanks connected
to a seawater system with open circulation to the ocean. Animals were
provided with an enriched environment including sand, plants, rocks
and coral rubble, as well as a shelter (terracotta pot).
O. laqueus were carefully selected for this study after assessing several other options due to (1) their compact brain and body size made
them suitable for Neuropixels recording and light-sheet imaging,
(2) their white resting skin pattern aided detection of AS bouts, (3) their
nocturnal behaviour meant we could film sleep behaviour under white
lighting and (4) they were locally available, a regulatory requirement for
keeping in the OIST marine station. The brain of O. laqueus resembles
coastal diurnal octopuses in possessing a seven-gyrus VL (Extended
Data Fig. 3d). The VL occupies 9.05% of central brain volume, slightly
higher than other coastal nocturnal species, such as the commonly
studied O. vulgaris and O. bimaculoides51.
Behavioural filming
Experiments were conducted in closed seawater systems, circulating
filtered natural seawater. Water was filtered mechanically and biologically, UV sterilized, oxygenated and exchanged with fresh seawater twice a week. Unless otherwise reported, temperature was cooled
to 22 °C, with lighting alternating on a 12/12-h light/dark cycle with a
30-min taper in light intensity. Animals were fed live crabs three times a
week during subjective night, while awake. Animals were given a 2-week
acclimation period of living in experimental tanks. Experiments started
after animals were seen to be resting normally during the daytime.
Low-resolution recordings (Fig. 1b,g–j and Extended Data Figs. 2 and
5b) were filmed using three custom filming chambers. Each chamber
placed a single 4K camera (Basler ace acA4024-29uc, 4,024 × 3,036
pixels, 24 fps) viewing four transparent acrylic 100 × 150 × 100 mm
tanks from the top, with 13.4 pixel per mm resolution using 12-mm
lenses. Lighting was mounted on two sides of the group of four tanks,
with white LED day lighting (Koval Smart Aquarium Light, 300 mm,
654 lx) and red LED night lighting (Leimac IDBA-HM300R, 300 × 40 mm
Barlight, 129 lx). Other than during feeding, a 5-mm-thick glass cover
was placed over the tanks to prevent animal escape. For recording animal movements (Fig. 1c–f and Extended Data Fig. 1), we placed animals
in transparent acrylic 300 × 200 × 200 mm tanks fitted with shelters
(three-dimensionally printed and terracotta pots), with shelter entrance
facing the tank wall. Cameras (as above, 24 or 30 fps) were positioned
facing the shelters of single animals. Lights (Leimac IDBA-HM300W,
300 × 40 mm, 3 klx) were placed on tank top and/or sides.
Recordings were made with PylonRecorder2 (v.0.6), using online
hardware compression to h264 format and writing to solid-state drives.
A single computer running Windows 10 was equipped with two graphics cards (Nvidia Quadro P1000 and Quadro P5000), which run up to
seven cameras simultaneously.
High-resolution recordings (Figs. 1a and 5) were made by placing
an 8K camera (Canon EOS R5, 8,192 × 5,464 pixels, 30 fps) fitted with a
Canon Macro Lens EF 180 mm lens on a gimbal, and filming top-down
on a single animal using a 45° mirror (96 pixels per mm). Three white
bar lights (Leimac IDBA-HM300W, 300 × 40 mm, 3,933 lx) were used
to light the tank. All recordings were made using the following camera
settings: 1/200, F32, ISO 3,200. Because AS events are periodic, AS
recording was started a few minutes before the expected AS time, and
ended after AS pattern dynamics ceased. Some pairs of waking and
sleeping patterns were shot at 4K resolution (Basler ace acA4112-30uc,
4,096 × 3,000 pixels, 30 fps, 32.3 pixels per mm, 1,000 lx), looking
down on animals using a 50-mm lens. High-resolution recordings were
shot at 24 °C (room temperature water).
To put lighting levels in context, daylight ranges from 10 to 25 klx
when sunny, 1,000 lx when overcast. Nighttime light levels range from
roughly 0.3 lx during a full moon to 0.002 lx when the moon is not
visible. Animal sleep time, AS duration and interval seemed normal
under various experimental lighting conditions (Extended Data Fig. 5).
Darker skin patterns did not appear under 3 klx lighting while awake,
but were observed under 1 klx lighting.
Behavioural experiments
For measuring arousal threshold, mechanical stimulation was delivered
using a solenoid, fixed in a constant position on the tank wall and controlled by an Arduino (Arduino Mega 2560). Synchronization of camera
and solenoid hit time was done using a red LED placed in view of the
camera and out of view of the animal. Stimulus strength was calibrated
using a hydrophone (DolphinEar DE200), placed in the position of the
octopus. Three strengths of stimulus 6, 40 and 86 dbV were delivered
to the octopus during active bouts, QS and wake in the terracotta pot.
QS was defined as the interval between two active bouts, in which the
octopus had the characteristic lack of movement, flat posture, smooth
texture, closed eyes and white colour. All trials were conducted between
12:00 and 17:00.
For sleep homeostasis, octopuses were recorded continuously for
48 h before the start of sleep deprivation. The following day, animals
were kept awake from 07:00 to 17:00 by gently brushing their skin
with a paintbrush every 2–3 min. Movement, elevated posture and eye
opening were considered indicators of wakefulness. Animals were left
to behave freely after 17:00. Sleep deprivation was then repeated, using
the above procedure, for a second day. Post-deprivation behaviour was
subsequently recorded for 48 h without any disturbance. For the active
bout interruption experiment, a random subset of active bouts were
interrupted using a paintbrush. The amount of QS preceding the following AS bout was then compared in interrupted and uninterrupted ‘trials’.
For measuring circadian rhythm, octopuses were acclimated to a
12-h light/dark cycle for 2 weeks. After 48 h of continuous filming, they
were subject to either 72 h of continuous daylight or 72 h of continuous
darkness. Feeding was halted during this period to prevent cues from
live crabs. Animals were then switched back to a 12-h light/dark cycle.
For measuring temperature dependence, the temperature of the
water circulating in the behavioural filming system was cooled to 19,
22 and 24 °C using a cooler (Poafamx AL-300) attached to the water
circulation system. Each temperature was maintained for 2 days. Higher
temperatures were achieved by turning off the cooler. Tank water temperature was measured using a temperature sensor (Tinytag Aquatic
2 TG-4100).
Surgery for electrophysiology
Animals were anaesthetized (2% ethanol in filtered sea water) more
than 3 days before the recordings, and the distal 2–4 cm of all arms
were surgically shortened to prevent them from removing future head
fixation. Wounds were sealed with tissue glue (Histoacryl, B.Braun).
Following this procedure, animals recovered in an experimental tank
equipped with a closed seawater circulation system (above), in which
they could move and eat immediately on waking from anaesthesia.
Octopus did not demonstrate signs of pain (that is, arm grooming
behaviour52), therefore local analgesia was not applied, preventing
administration related stress and sleep disruption. One day before
recording, animals were anaesthetized as above and the top of the
head was placed out of the water. The skin, soft tissue and muscle over
the cartilaginous head capsule were removed with microscissors. A
three-dimensionally printed plastic ring with a pole was glued to the
head capsule over the central brain with tissue glue and dental light cure
adhesive (3M, Transbond XT Light Cure Paste Adhesive). The inside of
the ring was filled with silicone sealant (Kwik-Cast, WPI) to prevent the
8.
Articlewound from touching sea water. Animals were left to recover overnight
in the recording tank. On the day of recording, animals were anaesthetized as above. A small hole was cut into the head capsule to expose
the central brain, and the sheath surrounding the brain was removed
using fine forceps. The ring was covered again using silicone sealant.
Fresh seawater was washed over the animal, before moving it to the
experimental tank. It was then head-fixed using a metal rod. Animals
recovered from anaesthesia within minutes of exposure to fresh seawater. The water level in the recording tank was reduced to have the
top of the animal’s head above the water line during probe insertion.
The animal’s body was supported with an aquarium wool filter mat. A
Neuropixels v.1.0 probe shank was coated with CM-DiI (100 μg to 50 μl
ethanol, Thermo Fisher Scientific, CellTracker CM-DiI Dye) for post hoc
probe position localization. The probe was mounted on a motorized
micromanipulator (New Scale Technologies, M3-LS). After removing
the cured silicone sealant, the Neuropixels probe was lowered into the
brain at the speed of 200 μm min−1. The depth of the recordings varied
across experiments. We explored a range of depths, insertion sites and
angles. After lowering, the inside of the head-fixation plastic ring was
again filled with silicone sealant and water level was raised so that the
animal’s head was submerged. The recording tank circulated aerated
seawater at a rate of roughly 0.2 l min−1 at room temperature (24 °C).
Electrophysiological recording
Neuropixels recordings were performed using SpikeGLX software
(v.3.0). with sampling rates at 2.5 kHz (for LFP signals) and 30 kHz (for
extracellular spike signals). The mantle of the animal was simultaneously
filmed using a 4K camera as in behavioural recordings (Behavioural
filming above, shot at 1,034 lx). Video was synchronized to electrophysiological recording by sending a 25-Hz transistor-transistor-logic
(TTL) signal from an Arduino to trigger camera frame exposure and
to log TTL time using spikeGLX. Animals showed AS 12.7 ± 6.6 (s.d.) h
after recordings began, demonstrating AS bouts similar in duration
and interval to that of freely behaving animals (Extended Data Fig. 5).
Tissue clearing and light-sheet imaging
Following recordings, the Neuropixels probe was removed from the
brain and the animal was euthanized by gradually increasing ethanol
concentration from 2 to 5% in sea water. The head of the recorded animal
was dissected, with tissues surrounding the head capsule removed as
much as possible. The brain in the head capsule was fixed in 4% paraformaldehyde at 4 °C for 24–48 h. Dissected brain tissue was cleared
using a second-generation CUBIC method53. First, the tissue was incubated in 50% CUBIC-L solution at 25 °C overnight, followed by 100%
CUBIC-L incubation at 25 °C for 24 h. After PBS wash, the tissue was
immersed in BOBO-1 nuclear staining dye (ThemoFisher B3582; 1/800
dilution) for 3 days. The tissue was washed with PBS, then placed in 50%
CUBIC-R overnight followed by 100% CUBIC-R for 24 h (Extended Data
Fig. 3a). The cleared sample was embedded in a transparent agarose
gel for mounting on a microscope. To scan the brain, we custom-built a
light-sheet microscope using the technique of axially swept light-sheet
microscopy54. The microscope was equipped with a 10X detection
objective lens (Olympus XLPLN10XSVMP) and a 10X illumination
objective lens (KYOCERA SOC Corporation, CS03-10-30-152). Images
were acquired with (x, y, z) = (0.65, 0.65, 2.5) μm resolution. BOBO-1
was imaged with a 488 nm excitation laser and 536/40 nm bandpass
filter, whereas CM-DiI was imaged with a 532-nm excitation laser and
593/40-nm bandpass filter (Extended Data Fig. 3b,c).
Brain registration and atlas construction
To construct a reference brain atlas of O. laqueus, we cleared and
stained an adult octopus brain following the procedure described
above and scanned the brain with (x, y, z) = (0.65, 0.65, 2.5) μm resolution. We cropped the supra-oesophageal mass from the whole brain
image and downsampled it to (x, y, z) = (10, 10, 10) μm. We used 3D
Slicer55 to manually annotate this 3D image, referencing existing anatomical atlases25,26 (Extended Data Fig. 3d,e). 3D images of individual
octopus brains were mapped to this reference atlas using the symmetric image normalization method (SyN) method implemented in
the Advanced Normalization Tools (ANTs) library56. Before the registration, the BOBO-1 channel was downsampled to (x, y, z) = (10, 10,
10) μm. A binary mask was then created manually using 3D Slicer,
masking tissues other than the supra-oesophageal mass. The brain
was then mapped to the reference brain by a two-step transformation. First, an affine transformation was computed to roughly align
the two brains, using mutual information as a metric function. Second, a non-linear warping was computed using the SyN algorithm
with cross-correlation as a metric function. In ANTs command
line, the following parameters were used: --transform Affine[0.1]
--metric MI[${fix_img},${mov_img},1,128,Regular,0.5] --convergence
[1000x1000x1000,1e-5,15] --shrink-factors 8x4x2 --smoothing-sigmas
3x2x1vox --transform SyN[0.1,4.0,0.2] --metric CC[${fix_img},${mov_
img},1,6] --convergence [500x500x100x30,1e-6,10] --shrink-factors
8x4x2x1 --smoothing-sigmas 3x2x1x0vox. This generated an affine
transformation matrix and a warp field given as a four-dimensional
matrix (Extended Data Fig. 3g). We controlled the parameters in ANTs
to prevent excessive warping, which was quantified by the values of
Jacobian determinants (Extended Data Fig. 3g). The atlas and the
registered brain were overlaid, showing visually precise alignments
(Extended Data Fig. 3f). Alignment quality was quantified by computing
the voxel-wise normalized cross-correlation56 value with window radius
of 4 voxels (Extended Data Fig. 3h), which showed positive values in
most of the areas and especially high positive values at the boundary
between brain lobes. We also generated an average nuclear stained
image from n = 9 independently aligned brains (Extended Data Fig. 3h).
The lobe structure was maintained, further supporting the quality of
our registration.
To analyse the location of a Neuropixels probe, the CM-DiI channel
from a 3D brain image was first downsampled to (x, y, z) = (5, 5, 5) μm.
The CM-DiI probe track was then manually labelled using 3D Slicer. This
labelled track image was smoothed by first skeletonizing the binary
object using the morphology.skeletonize_3d function implemented
in the scikit-image library, and then fitting the resulting skeleton with
a B-spline. The xyz coordinates of Neuropixels probe channels were
then mapped to the reference space using the transformation computed above. Finally, each recording channel was assigned a unique
region ID on the basis of the atlas region. Determining probe depth from
CM-DiI images is sometimes a non-trivial problem due to the spread of
the dye by diffusion. Following previous heuristic treatments57, after
mapping we inspected the characteristic LFP patterns at the boundary
of the anatomical regions. If necessary, we shifted the probe location
along the depth axis to increase LFP-anatomy correspondence. The
automatically determined locations were usually very accurate, and
the maximum correction was ten channels (roughly 100 μm).
To divide brain regions into anterior and posterior halves (Fig. 4e
inset), we took the most anterior point and posterior point of each
brain region as its A–P minimum and maximum values and computed
the midpoint between them as (min + max)/2. Channels were divided
into anterior or posterior on the basis of whether they were anterior
or posterior to the brain region midpoint.
Behavioural analysis
To measure octopus skin brightness in behavioural recordings (Fig. 1),
we segmented octopuses from background with the FAIR Detectron2
platform58 (v.0.1.3), using a pretrained base model (COCO Instance
Segmentation with Mask R-CNN, R50-FPN, 3× schedule), fine-tuned
with octopus training datasets. Training set labelling was done using
the Labelbox platform. To accelerate data processing, octopuses were
segmented every 100 frames (4.16 s), with mean intensity calculated
on every frame using the nearest preceding segmentation. Multi-day
9.
videos were processed in parallel by using FFMPEG to cut videos into1-h clips, running each clip independently, then recombining.
Colour flashes during QS were detected using the mean skin
brightness trace during QS. The trace was filtered 0.005–2 Hz using
a three-pole Butterworth filter, and peaks were detected on the negative of the z-scored signal, with a minimum peak height of 2, minimum
prominence of 0.5 and minimum separation in time of 10 s. Colour flash
duration was calculated by taking a window of the mean skin brightness
trace from 500 frames (21 s) before a colour flash peak to 1,000 frames
(42 s) after a peak. This time series was z-scored, and threshold crossings
(2z) on either side of the peak time were taken as the start and end time.
For sleep time, duration and interval, AS and QS times were identified manually using the mean skin brightness recording coupled with
video confirmation. Wake times were similarly identified manually.
AS inter-event intervals were calculated between bouts in which the
animal did not wake up. AS duration was determined by considering
a window 10 s before and 100 s after AS start times. These time series
were z-scored, and low pass filtered at 0.1 Hz using a two-pole Butterworth filter. The length of the largest continuous stretch of data
falling below a threshold was taken as the AS duration. We explored a
range of thresholds (Extended Data Fig. 5d), deciding on 0.2 as a good
subjective match to video data.
Histograms in Fig. 1i,j used 2-h binning, and a continuous rate estimate was calculated by smoothing a 0.1-h binning using a Gaussian
kernel with s.d. 40 bins (4 h). Figure 2b was calculated similarly, using 1-h
histogram binning. Figure 2d used 5-min binning, a probability density
was estimated using a kernel density estimate (MATLAB ‘ksdensity’).
For movement analysis, in the arousal threshold experiments (Fig. 2a
and Extended Data Fig. 1g–i), we extracted clips 1 s before stimulation time to 1 s after. Animals were segmented from background (as
above) on the first frame of a clip. Within the segmentation mask,
prominent features were detected using SIFT59 keypoint detection
(contrast threshold of 0.05). Lukas–Kanade optical flow60 (window size
of 512 pixels) was then used to track these points over frames. Movement magnitude was calculated as the mean optic flow magnitude
between neighbouring frames. For calculating reactionary movements,
a baseline mean magnitude for 25 frames (1 s) before stimulation time
was subtracted from the mean magnitude for 25 frames (1 s) following
stimulation.
For analysis of animal movements during QS and AS (Fig. 1c–f and
Extended Data Fig. 1a–c), we extracted 2-min clips centred on AS start
times. The eye, body and the anterior mantle (for measuring breathing)
were manually segmented from the first frame of this clip. Movement
magnitude was calculated as above, separately for each segmentation mask. To isolate eye and breathing movements from overall
body movements, the average movement within the eye/anterior mantle mask was removed from each frame and we have reported residual
movements. Breathing rate was extracted from anterior mantle residual
movements, with inhalation detected through peak detection in the
z-scored, smoothed (10 frames) trace, with a peak prominence of 0.05.
Breathing rate was then linearly interpolated to video frame rate.
Figure 1 reports average movement magnitude for the first 30 s of the
clip (QS), and the third 30 s of the clip (AS). Calculation of breathing
arythmicity for waking animals (Extended Data Fig. 1b) was calculated
as QS/AS, on separate 30-s video clips.
Behavioural analysis was performed using OIST’s Saion HPC system, using up to 32 GPUs (Nvidia V100 and P100s). Core analysis was
written in Python (v.3.6 and 3.7), with further analysis written using
MATLAB 2019a.
Electrophysiological analysis
LFP data were preprocessed by resampling from 2.5 to 1 kHz, filtering
0.1–150 Hz and re-referencing by subtracting the median of ten channels located out of the brain from all channels. Spectrograms were
calculated using a continuous wavelet transform with a Mortlet wavelet
(MATLAB ‘cmor1.5-1’), scales logarithmically spaced between 1 and
100 Hz. Spectrograms were normalized in amplitude by dividing all values by the maximum value. Spectra were calculated on non-overlapping
1-s chunks of data using the Chronux toolbox (v.2.12, http://chronux.
org/)61 with a time-bandwidth product of five and nine tapers. The
results were then averaged over data chunks.
For calculating channel intensity during different behavioural states,
a uniform procedure was conducted on different selections of data.
For AS, QS and wakefulness, 60 s of LFP data were loaded, beginning
at the transition of every detected AS or wake phase and taking the
60 s before AS times as QS. For QS colour flashes, 700-ms chunks of
data were loaded, centred on colouration flash events (detected as
above). After data loading, two filtered versions of the data were then
generated, at 0.1–10 and 20–150 Hz for every recording channel. The
envelope of these filtered signals was calculated using a 150-tap Hilbert filter. Signal strength for a channel was calculated as the mean of
this envelope. We median filtered more than five channels to remove
noisy channel readings. We then averaged this vector over all events.
For QS oscillation events, 1,200 s of LFP data were loaded preceding
every AS bout and any wake events (manually detected, above) were
removed. QS oscillation events were detected by filtering the data
4–40 Hz, then finding peaks in the z-scored signal with a minimum
height of two, minimum prominence of two and a minimum separation
of 1 s. Estimates of oscillation event rates were taken per data chunk and
averaged. This was then smoothed with a five-channel median filter, as
in activity strength measurements. To calculate LFP activity strength
over brain regions, we averaged the channel intensity for all electrodes
located within a brain region. We required data from a minimum of two
probes to consider activity strength for a brain region. Correlations
between different activity strength measurements were taken over all
electrodes from these brain regions. Unless otherwise stated, filtering
was performed using three-pole Butterworth filters.
Skin pattern analysis
To quantify AS skin patterns, we adapted techniques developed for
describing cuttlefish camouflage28. High-resolution octopus videos
were processed by first detecting the octopus mantle, using the Detectron2 platform58 as above. Mantles were aligned by choosing a single
source image and mapping all images onto this source image by ellipse
fitting and similarity transformation. Determination of anterior versus
posterior direction was done manually for waking images and the first
frame of AS video clips. Images were then cropped and downsampled
to 1,004 × 675 pixels (20% image size after cropping to segmented
mantle), with background pixels coloured uniform grey (as in Fig. 4c).
Following standard preprocessing (zero-centring), 400 × 400 pixel
crops of the dorsal mantle were evaluated by a VGG-19 (ref. 62) network
pretrained on the ImageNet63 database, using the Keras64 platform
(included in TensorFlow v.2.0). We used the max-pooled fifth layer
activations (‘block5_pool’) as our skin pattern metric65. This resulted
in 512-dimensional vectors describing skin patterns for every frame
in a video clip.
The starting points of AS trajectory dynamics were aligned across
video clips by calculating the first principal component of the
512-feature by frame matrix, and thresholding the absolute value of
its approximate derivative (difference between neighbouring points in
time, threshold 0.1). All further analysis was done on start-time aligned
trajectories. To estimate the dimensionality of AS space, we ran Parallel Analysis66 several times on 10,000 randomly selected images from
the total dataset. To estimate the overlap of different animals’ patterns within AS space, we similarly calculated the Silhouette score67
several times on 10,000 randomly selected images from the total
dataset. Intra-trajectory distance was calculated as the mean Euclidean distance between neighbouring points in time along a trajectory.
Inter-trajectory distance was calculated between two trajectories as
the mean element-wise Euclidean distance, from trajectory start time
10.
Articleto the end of the shorter trajectory. Distances between trajectories
after dynamic time warping68 were divided by trajectory distance to
compare with non-time warped inter-trajectory distances. Nearest
inter-trajectory distances (between AS bouts and between waking
images and AS bouts) were calculated by taking, for all pairs of trajectories, the minimum Euclidean distance between points.
For aligning select waking and AS skin patterns, similar patterns were
extracted from videos manually. Precise alignment was achieved by
manually selecting corresponding points and interpolating between
these points using a moving least-squares algorithm69 to produce a mapping from the AS image to the waking image. Images were uniformly and
linearly brightened for display. Green rectangles in AS images (Fig. 5d
and Extended Data Fig. 10) are approximate crops (non-linear mapping). To show overlaid matches, images were grey scaled, inverted and
thresholded (image specific threshold of 8-bit grayscale at 180–230)
to show the dark pattern regions.
Statistics and reproducibility
Unless stated otherwise, data are mean ± s.e.m. For box plots, margins
are 25th and 75th percentiles; middle line, median; whiskers, boundaries before outliers; outliers (+) are values beyond 1.5× interquartile
range from the box margins. Experiments were repeated independently
several times with similar results, with numbers of repetitions and sex
(female or male) as follows: temperature modulation n = 9 animals,
arousal threshold n = 5 animals, homeostasis n = 6 animals, active bout
movement n = 3 animals, continuous light on/off n = 6 animals, electrophysiology n = 9 animals, skin pattern dynamics n = 3 animals and
wake–sleep pattern matching n = 5 animals.
Reporting summary
Further information on research design is available in the Nature Portfolio Reporting Summary linked to this article.
Data availability
Data are available from the corresponding author on request. A small
dataset is provided with the analysis code for demonstration purposes.
Code availability
The code developed in this study is posted in a repository on GitHub:
https://github.com/oist/pophale2023.
51.
Chung, W.-S., Kurniawan, N. D. & Marshall, N. J. Comparative brain structure and visual
processing in octopus from different habitats. Curr. Biol. 32, 97–110.e4 (2022).
52. Crook, R. J. Behavioral and neurophysiological evidence suggests affective pain
experience in octopus. iScience 24, 102229 (2021).
53. Tainaka, K. et al. Chemical landscape for tissue clearing based on hydrophilic reagents.
Cell Rep. 24, 2196–2210.e9 (2018).
54. Chakraborty, T. et al. Light-sheet microscopy of cleared tissues with isotropic, subcellular
resolution. Nat. Methods 16, 1109–1113 (2019).
55. Fedorov, A. et al. 3D Slicer as an image computing platform for the quantitative imaging
network. Magn. Reson. Imaging 30, 1323–1341 (2012).
56. Avants, B. B., Epstein, C. L., Grossman, M. & Gee, J. C. Symmetric diffeomorphic image
registration with cross-correlation: evaluating automated labeling of elderly and
neurodegenerative brain. Med. Image Anal. 12, 26–41 (2008).
57. Siegle, J. H. et al. Survey of spiking in the mouse visual system reveals functional hierarchy.
Nature 592, 86–92 (2021).
58. Wu, Y., Kirillov, A., Massa, F., Lo, W.-Y. & Girshick, R. Detectron2. GitHub, https://github.com/
facebookresearch/detectron2 (2019).
59. Lowe, D. G. Distinctive image features from scale-invariant keypoints. Int. J. Comput. Vis.
60, 91–110 (2004).
60. Lucas, B. D. & Kanade, T. An iterative image registration technique with an application to
stereo vision. In Proc. 7th International Joint Conference on Artificial Intelligence Vol. 2,
674–679 (Morgan Kaufmann, 1981).
61. Mitra, P. & Bokil, H. Observed Brain Dynamics (Oxford Univ. Press, 2007).
62. Simonyan, K. & Zisserman, A. Very deep convolutional networks for large-scale image
recognition. Preprint at https://arxiv.org/abs/1409.1556 (2014).
63. Deng, J. et al. ImageNet: A large-scale hierarchical image database. In Proc. 2009 IEEE
Conference on Computer Vision and Pattern Recognition 248–255 (2009).
64. Chollet, F. et al. Keras. GitHub, https://github.com/fchollet/keras (2015).
65. Cimpoi, M., Maji, S., Kokkinos, I. & Vedaldi, A. Deep filter banks for texture recognition,
description, and segmentation. Preprint at https://arxiv.org/abs/1507.02620 (2015).
66. Horn, J. L. A Rationale and test for the number of factors in factor analysis. Psychometrika
30, 179–185 (1965).
67. Rousseeuw, P. J. Silhouettes: a graphical aid to the interpretation and validation of cluster
analysis. J. Comput. Appl. Math. 20, 53–65 (1987).
68. Sakoe, H. & Chiba, S. Dynamic programming algorithm optimization for spoken word
recognition. IEEE Trans. Acoust. 26, 43–49 (1978).
69. Schaefer, S., McPhail, T. & Warren, J. Image deformation using moving least squares. ACM
Trans. Graph. 25, 533–540 (2006).
Acknowledgements We are grateful to the OIST Cephalopod Research Support Team for
animal care, for the help and support provided by the Scientific Computing and Data Analysis
and Engineering sections, Research Support Division at OIST. We thank all Reiter laboratory
members for assistance and discussion. We thank G. Laurent, K. Doya, H. Obenhaus,
H. Norimoto and S. Shi for comments on the manuscript. This research was supported by the
Okinawa Institute of Science and Technology, and Japan Society for the Promotion of Science
(JSPS) Kakenhi grant nos. 60869155 and 20K15939. T.M. was financed by a Grant-in-Aid
for JSPS Fellows (grant no. JSPS KAKENHI 21J01369). L.M. was financed by the Burroughs
Wellcome Fund CASI award, the Swartz Foundation and the OIST theoretical visiting scholar
programme.
Author contributions The project was defined by A.P., K.S., T.L.I. and S.R. Mechanical design
and assembly was done by K.M., M.H. and A.P. Animal care was the responsibility of T.L.I., K.A.,
A.P. and K.S. Behavioural experiments were carried out by A.P. and T.L.I. Electrophysiological
experiments were carried out by K.S. and S.R. Anatomical experiments and analysis were
carried out by T.M., P.G.A. and T.T.V.D. Behavioural and electrophysiological analysis were
carried out by S.R., A.P. and L.M. S.R. wrote the manuscript with participation of all authors,
and supervised the project.
Competing interests The authors declare no competing interests.
Additional information
Supplementary information The online version contains supplementary material available at
https://doi.org/10.1038/s41586-023-06203-4.
Correspondence and requests for materials should be addressed to Sam Reiter.
Peer review information Nature thanks Daniel Bendor, Roger Hanlon, Daniel Osorio and
Carolin Purmann for their contribution to the peer review of this work. Peer reviewer reports
are available.
Reprints and permissions information is available at http://www.nature.com/reprints.
11.
Extended Data Fig. 1 | Movements during active bouts. a) Example imageof an octopus during active sleep, and manual segmentation of body regions
for movement tracking. b) QS shows decreased variability in breathing rate
(coefficient of variation) compared to active bouts/wake. Two-sided Wilcoxon
rank sum tests, p = 0.00077 (QS-active), 0.0076 (QS-wake), N = 10,10,9 bouts
(active, QS, wake) from 3 animals. c) Time course of increased movements
(optic flow magnitude, Methods) during an active bout, identified by changes
in skin brightness. d) Baseline movements preceding arousal threshold
experiments (1s before hit time). N = 13, 12, 21, 9, 9, 13, 8, 10, 10 trials (left to
right), from N = 5 animals.
12.
ArticleExtended Data Fig. 2 | Coloration changes during sleep. a) Rendering of
experimental filming setup. b) Example image, taken at night under red
lighting, with octopuses segmented using a Mask R-CNN. 100% refers to the
network’s confidence of correct identification. c) Time series of mean skin
brightness of three octopuses, simultaneously recorded and automatically
segmented using a Mask R-CNN. Blue arrowheads: active rest bouts (manually
detected, Methods). d) An example flash of coloration during QS, recorded at
high resolution. Top: example images throughout the event. Bottom: mean
skin brightness. e) QS colour flash inter-event interval. 3/1437 intervals omitted
for display. f) QS colour flash occurrence rate decreases as a function of the
fraction of time to the next active bout (linear regression R^2 = 0.77, F = 61.8,
p = 0, N = 20 histogram bins from 1482 events, 6 animals). g) Active bout
duration remains constant through manipulations other than decreasing the
temperature. N = 528, 131, 316, 317, 164, 178 bouts from N = 6, 6, 6, 6, 10, 10
animals.
13.
Extended Data Fig. 3 | Octopus brain atlas and Neuropixels mapping.a) Adult O. laqueus brain, cleared with CUBIC (Methods). b) 3D rendering of
the cleared octopus brain imaged with a light sheet microscope. c) Neuropixels
mapping workflow. Neuropixels probe was coated with CM-DiI to leave
fluorescent labelling of penetration track in the brain. The brain was cleared
and imaged using a light sheet microscope with dual channels (nuclear staining
and CM-DiI). Using the nuclear staining channel, we computed the mapping
to atlas space. d) Coronal sections of O. laqueus brain atlas. e) Sagittal sections
of O. laqueus brain atlas. f) Representative result of brain registration, where
atlas (magenta) and a registered brain (cyan) are overlaid. g) Representative
warp field generated by registration, overlaid with corresponding Jacobian
determinant. h) Voxel-wise normalised cross-correlation map between the
atlas nuclear staining image and registered brain. (Methods) i) An average
nuclear staining image generated by N = 9 brains independently mapped to
the atlas.
14.
ArticleExtended Data Fig. 4 | Visualisation of Neuropixels probes after brain
registration. a,b) Sagittal (top) and coronal (bottom) slices through 3D
reference brain volume, showing mapped Neuropixels probe locations
(Methods). Probes are coloured by low (0.1 - 10 Hz, a) and high (20 - 40 Hz, b)
frequency oscillation of LFP signal during AS. c,d) Same plot as in a) and b) for
wake. e) Oscillatory bursts during QS.
15.
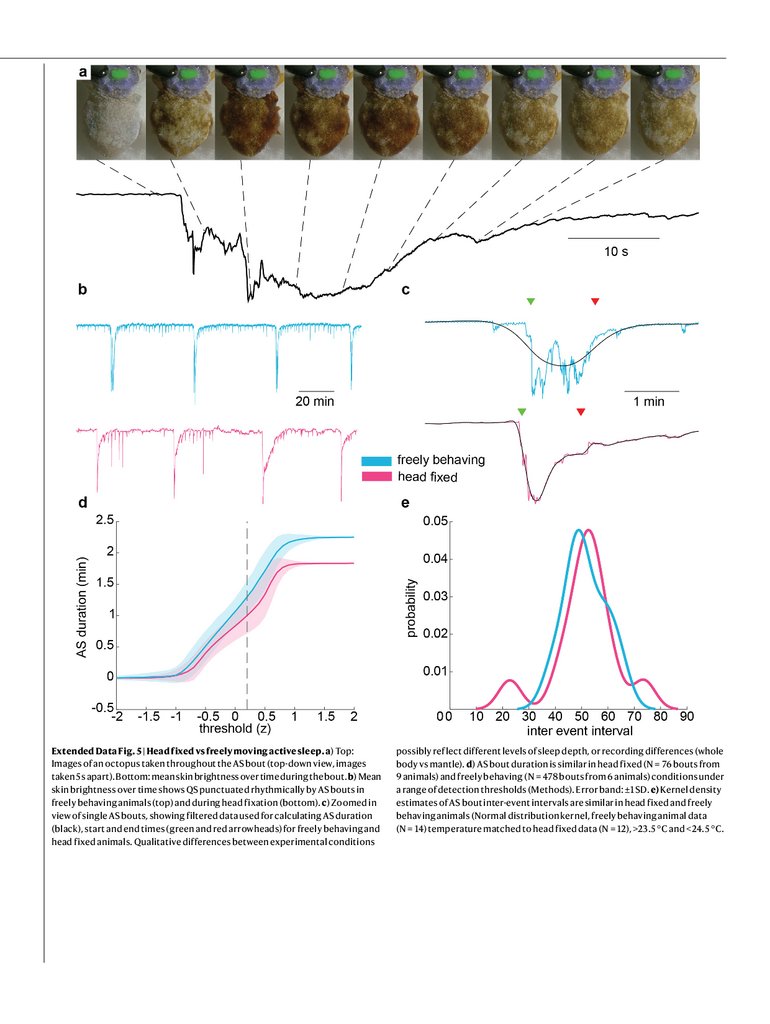
Extended Data Fig. 5 | Head fixed vs freely moving active sleep. a) Top:Images of an octopus taken throughout the AS bout (top-down view, images
taken 5 s apart). Bottom: mean skin brightness over time during the bout. b) Mean
skin brightness over time shows QS punctuated rhythmically by AS bouts in
freely behaving animals (top) and during head fixation (bottom). c) Zoomed in
view of single AS bouts, showing filtered data used for calculating AS duration
(black), start and end times (green and red arrowheads) for freely behaving and
head fixed animals. Qualitative differences between experimental conditions
possibly reflect different levels of sleep depth, or recording differences (whole
body vs mantle). d) AS bout duration is similar in head fixed (N = 76 bouts from
9 animals) and freely behaving (N = 478 bouts from 6 animals) conditions under
a range of detection thresholds (Methods). Error band: ±1 SD. e) Kernel density
estimates of AS bout inter-event intervals are similar in head fixed and freely
behaving animals (Normal distribution kernel, freely behaving animal data
(N = 14) temperature matched to head fixed data (N = 12), >23.5 °C and <24.5 °C.
16.
ArticleExtended Data Fig. 6 | Neural correlates of active sleep. a) Schematic of
head fixation technique. b) LFP recordings from the sFL (left) and VL (right),
as in Fig. 3b,c, filtered for low-frequency (LF) (0.1-10 Hz) and high-frequency
(HF) (20-150 Hz) activity. c) Time around a sleep-wake transition (black arrow)
demonstrating recording stability. Neural activity in the sFL (black, top)
increases and mantle coloration (red) darkens upon waking. Activity in the iFL
(black, bottom), remains quiet. There are two periods of transient large
movements, which are not prominent in either LFP recording. d) LFP centred
on AS start time (rows: different AS bouts), showing reliability in AS related LFP
activity from sFL (left) and VL (right) across animals. e) Relationship between
low-frequency (0.1-10 Hz) LFP activity strength during waking and AS. Crosses:
mean ± 95% confidence interval for all electrodes located in a brain region.
Line: Y = X. N = 583, 477, 85, 81, 84, 239, 395 electrodes from N = 8, 3, 3, 2, 3, 3, 6
animals for VL, sFL, iFL, Buc, Subr, dBL, Subv respectfully. f) As e) but for
high-frequency (20-150 Hz) LFP activity strength.
17.
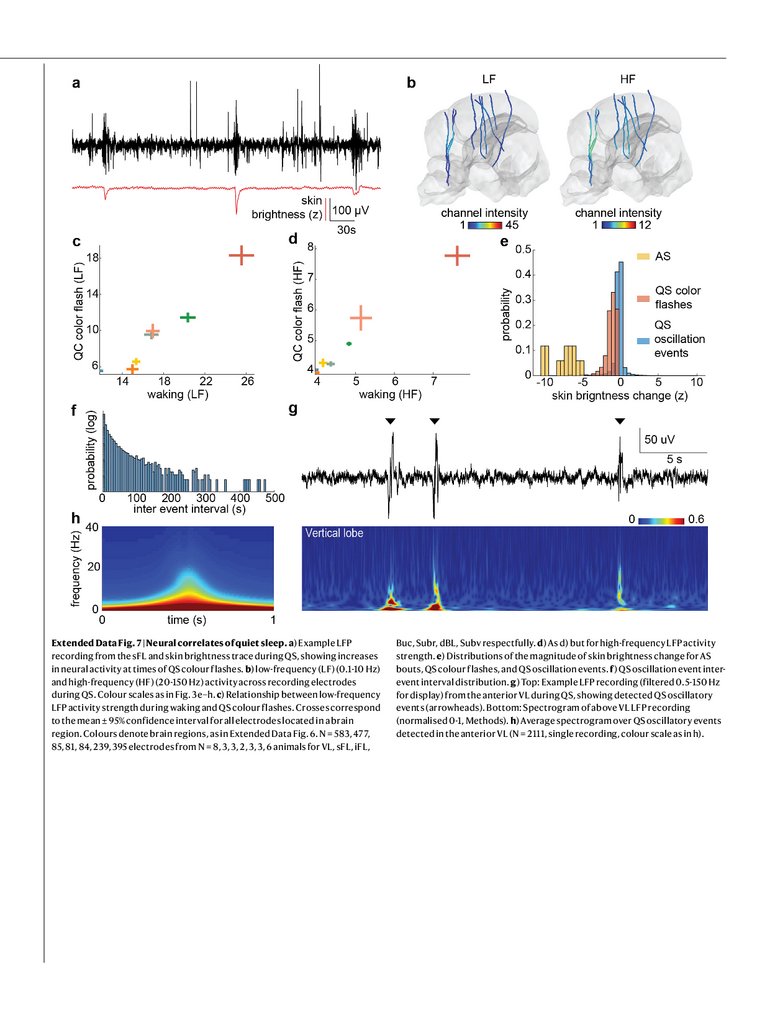
Extended Data Fig. 7 | Neural correlates of quiet sleep. a) Example LFPrecording from the sFL and skin brightness trace during QS, showing increases
in neural activity at times of QS colour flashes. b) low-frequency (LF) (0.1-10 Hz)
and high-frequency (HF) (20-150 Hz) activity across recording electrodes
during QS. Colour scales as in Fig. 3e–h. c) Relationship between low-frequency
LFP activity strength during waking and QS colour flashes. Crosses correspond
to the mean ± 95% confidence interval for all electrodes located in a brain
region. Colours denote brain regions, as in Extended Data Fig. 6. N = 583, 477,
85, 81, 84, 239, 395 electrodes from N = 8, 3, 3, 2, 3, 3, 6 animals for VL, sFL, iFL,
Buc, Subr, dBL, Subv respectfully. d) As d) but for high-frequency LFP activity
strength. e) Distributions of the magnitude of skin brightness change for AS
bouts, QS colour flashes, and QS oscillation events. f) QS oscillation event interevent interval distribution. g) Top: Example LFP recording (filtered 0.5-150 Hz
for display) from the anterior VL during QS, showing detected QS oscillatory
events (arrowheads). Bottom: Spectrogram of above VL LFP recording
(normalised 0-1, Methods). h) Average spectrogram over QS oscillatory events
detected in the anterior VL (N = 2111, single recording, colour scale as in h).
18.
ArticleExtended Data Fig. 8 | Dynamical landscape of skin pattern space. a) Black
traces: Variance explained as a function of principal component dimension
for 10 random draws of 10,000 samples. (58±6% of variability explained at
60 dimensions, 285,986 images from 3 animals). Red traces: As black, after
independent shuffling of features. b) Left Bottom: (Green) Average intertrajectory distance distribution after dynamic time warping. (Magenta)
Distribution of distances between waking patterns and the closest AS pattern.
Top: Distance distributions as in Fig. 4b. Right: Similar results as left but for
data projected onto top 6 PCs. Silhouette score: 0.076±3.148. c) Top: Histogram
of occupancy within the top two principal components of AS pattern space,
separated by octopus. Occupancy was normalised to the peak occupancy bin
(Gaussian smoothing, sd = 2 bins). Bottom: Projection of AS (black) and waking
(magenta) points onto the first two principal components. d) Two example AS
trajectories from each of three animals, projected onto the first two principal
components.
19.
Extended Data Fig. 9 | O. laqueus patterns in nature. A collection of images of octopuses adopting different waking skin patterns in different backgroundenvironments. Top left image shows an animal peeking out of its den, where it sleeps during the day.
20.
ArticleExtended Data Fig. 10 | Similar patterns during wake and AS. Further example pairs of similar waking and sleeping patterns (see Fig. 4d). Right column shows
nonlinear alignment of rectangular regions in left and middle columns, with brightness thresholded to display pattern match (white colour, Methods).