


 marketing
Similar presentations:


")


")
Apparel market worldwide
1.
INDUSTRIES & MARKETSApparel market worldwide
2.
Table of Contents01 Apparel market overview
Global revenue of the apparel market 2018-2028
03
Revenue of the apparel market worldwide by country 2023
04
Leading exporters of clothing worldwide by value 2022
05
Leading importers of apparel worldwide by value 2022
06
Fashion executives' expectations for the industry worldwide in 2024 compared to 2023
07
Global fashion companies' inventory value as a percentage of revenues 2016-2022
08
02 Selected categories
Revenue in the Apparel market Worldwide 2014-2027
10
Revenue of the accessories market worldwide by country 2023
11
Volume in the Women's Apparel market Worldwide 2018-2028
12
Volume in the Children's Apparel market Worldwide 2018-2028
13
Volume in the Men's Apparel market Worldwide 2018-2028
14
Forecast of the global footwear market revenue 2018-2028
15
Global luxury goods market revenue 2023, by segment
16
Value of the secondhand apparel market worldwide from 2021 to 2028
17
03 Trade
1
Non-textile apparel: export value worldwide 2003-2022
19
Non-textile apparel: import value worldwide 2003-2022
20
Articles of textile apparel: export value worldwide 2003-2022
21
Articles of textile apparel: import value worldwide 2003-2022
22
Used clothing leading importers worldwide 2022, by country
23
Used clothing leading exporters worldwide 2022, by country
24
04 Leading companies
Sales of the leading apparel and accessories companies worldwide 2022/23
26
Leading clothing and accessory companies worldwide by average annual profit 2022
27
Leading clothing companies by market capitalization worldwide as of December 2023
28
Most valuable clothing brands worldwide in 2023
29
Most valuable global luxury brands 2023
30
Most transparent clothing companies worldwide in 2023
31
05 Consumer outlook
Total consumer spending on clothing and footwear worldwide 2014-2029
33
Per capita consumer spending on clothing and footwear worldwide 2014-2029
34
Per-capita volume sales in the apparel market worldwide by country in 2023
35
Consumers more concerned about sustainability in 2023 than a year ago worldwide
36
Consumer intention to buy fewer items for sustainability in selected countries 2023
37
Fashion executives' price change expectations worldwide in 2024
38
3.
CHAPTER 01Apparel market overview
4.
Revenue of the apparel market worldwide from 2018 to 2028 (in trillionU.S. dollars)
Global revenue of the apparel market 2018-2028
2.5
Revenue in trillion U.S. dollars
2.0
1.73
1.58
1.57
1.5
1.55
1.57
2021
2022
1.79
1.84
1.89
1.94
2
1.39
1.0
0.5
0.0
3
2018
2019
2020
2023
2024
2025
2026
2027
Description: The global revenue in the apparel market was forecast to continuously increase between 2024 and 2028 by in total 0.2 trillion U.S. dollars (+11.17 percent). After the eighth consecutive increasing year, the indicator is estimated to reach two trillion U.S.
dollars and therefore a new peak in 2028. Read more
Note(s): Worldwide; 2018 to 2028
Source(s): Statista; Statista Consumer Market Insights
2028
5.
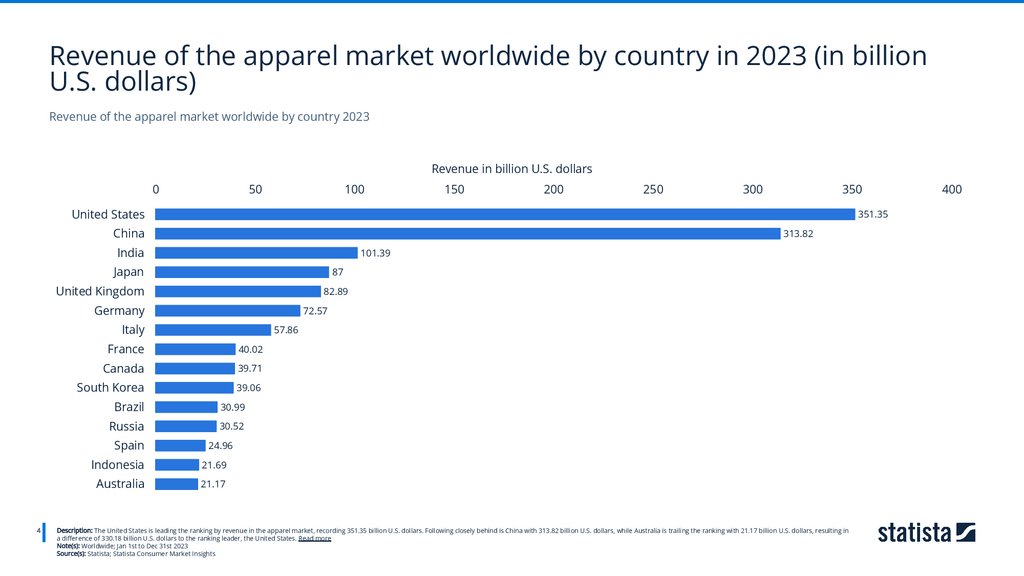
Revenue of the apparel market worldwide by country in 2023 (in billionU.S. dollars)
Revenue of the apparel market worldwide by country 2023
Revenue in billion U.S. dollars
0
50
100
150
200
250
300
350
United States
351.35
China
313.82
India
101.39
Japan
87
United Kingdom
82.89
Germany
72.57
Italy
4
57.86
France
40.02
Canada
39.71
South Korea
39.06
Brazil
30.99
Russia
30.52
Spain
24.96
Indonesia
21.69
Australia
21.17
Description: The United States is leading the ranking by revenue in the apparel market, recording 351.35 billion U.S. dollars. Following closely behind is China with 313.82 billion U.S. dollars, while Australia is trailing the ranking with 21.17 billion U.S. dollars, resulting in
a difference of 330.18 billion U.S. dollars to the ranking leader, the United States. Read more
Note(s): Worldwide; Jan 1st to Dec 31st 2023
Source(s): Statista; Statista Consumer Market Insights
400
6.
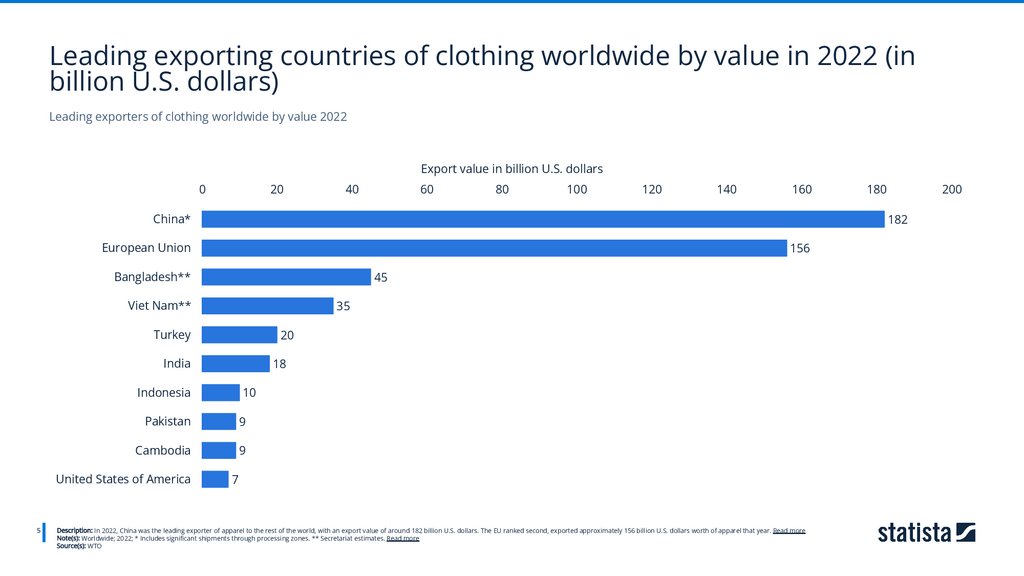
Leading exporting countries of clothing worldwide by value in 2022 (inbillion U.S. dollars)
Leading exporters of clothing worldwide by value 2022
Export value in billion U.S. dollars
0
20
40
60
80
100
120
140
160
China*
156
Bangladesh**
45
Viet Nam**
5
200
182
European Union
35
Turkey
20
India
18
Indonesia
10
Pakistan
9
Cambodia
9
United States of America
180
7
Description: In 2022, China was the leading exporter of apparel to the rest of the world, with an export value of around 182 billion U.S. dollars. The EU ranked second, exported approximately 156 billion U.S. dollars worth of apparel that year. Read more
Note(s): Worldwide; 2022; * Includes significant shipments through processing zones. ** Secretariat estimates. Read more
Source(s): WTO
7.
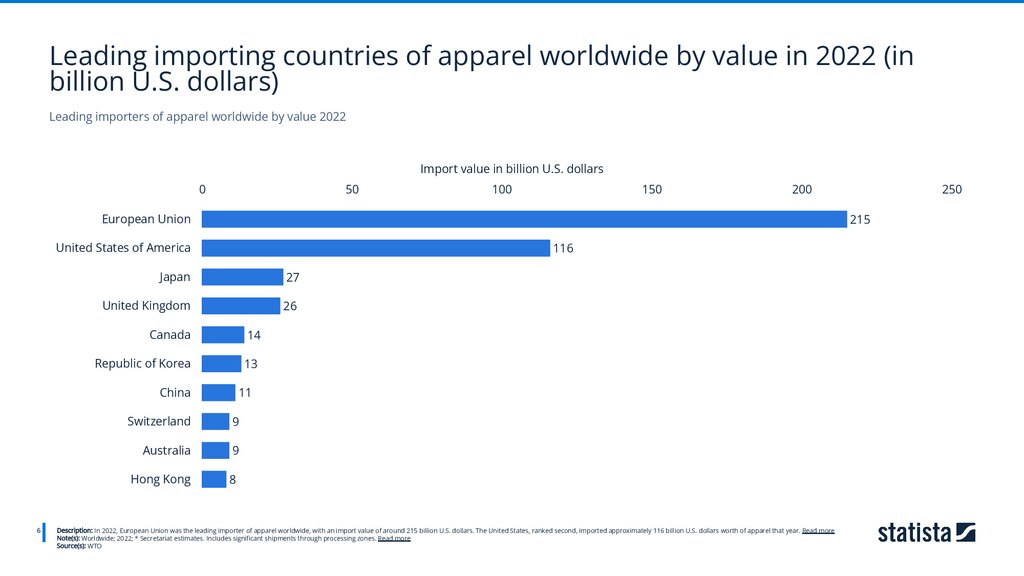
Leading importing countries of apparel worldwide by value in 2022 (inbillion U.S. dollars)
Leading importers of apparel worldwide by value 2022
Import value in billion U.S. dollars
0
50
100
150
200
European Union
215
United States of America
6
250
116
Japan
27
United Kingdom
26
Canada
14
Republic of Korea
13
China
11
Switzerland
9
Australia
9
Hong Kong
8
Description: In 2022, European Union was the leading importer of apparel worldwide, with an import value of around 215 billion U.S. dollars. The United States, ranked second, imported approximately 116 billion U.S. dollars worth of apparel that year. Read more
Note(s): Worldwide; 2022; * Secretariat estimates. Includes significant shipments through processing zones. Read more
Source(s): WTO
8.
Expected change in the conditions of the global fashion industrycompared to the previous year among fashion executives for 2024
Fashion executives' expectations for the industry worldwide in 2024 compared to 2023
Share of respondents
0%
Better
5%
10%
15%
20%
25%
30%
35%
26%
Same
Worse
7
40%
Description: According to a 2023 survey of executives and experts in the fashion industry, there were mixed views on whether the conditions in the fashion industry would improve in 2024 compared to the past year. Just over one-quarter of respondents did think that
the situation would be better, but a noticeably higher share were more pessimistic. Read more
Note(s): Worldwide; August to October 2023; 435 respondents; International fashion executives and experts
Source(s): McKinsey & Company; The Business of Fashion
37%
38%
9.
Inventory value of fashion companies as a percentage of revenuesworldwide from 2016 to 2022
Global fashion companies' inventory value as a percentage of revenues 2016-2022
Inventory value as a share of revenue
0%
5%
10%
15%
20%
2016
18.9%
2017
18.8%
2018
19.3%
2019
19.4%
2020
2021
2022
8
25%
21.1%
19.6%
20.7%
Description: In 2022 the inventory of fashion companies was worth on average just over one-fifth of their revenue. This value has risen over the displayed time period, peaking in 2020 at over 21 percent. The average inventory value from 2015 to 2018 was 19.1
percent. Read more
Note(s): Worldwide; 2016 to 2022
Source(s): McKinsey & Company
10.
CHAPTER 02Selected categories
11.
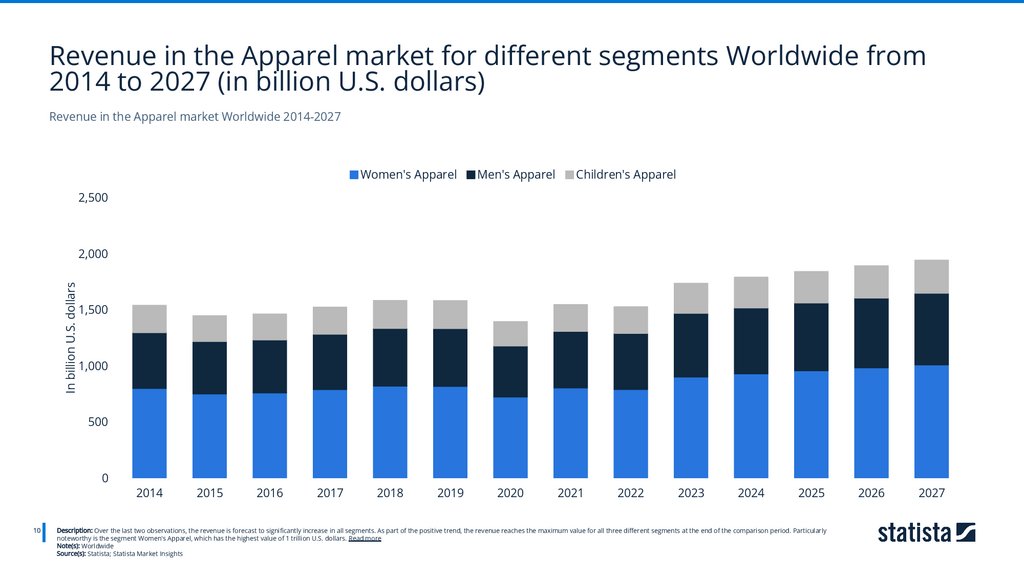
Revenue in the Apparel market for different segments Worldwide from2014 to 2027 (in billion U.S. dollars)
Revenue in the Apparel market Worldwide 2014-2027
Women's Apparel
Men's Apparel
Children's Apparel
2,500
In billion U.S. dollars
2,000
1,500
1,000
500
0
10
2014
2015
2016
2017
2018
2019
2020
2021
2022
2023
2024
2025
Description: Over the last two observations, the revenue is forecast to significantly increase in all segments. As part of the positive trend, the revenue reaches the maximum value for all three different segments at the end of the comparison period. Particularly
noteworthy is the segment Women's Apparel, which has the highest value of 1 trillion U.S. dollars. Read more
Note(s): Worldwide
Source(s): Statista; Statista Market Insights
2026
2027
12.
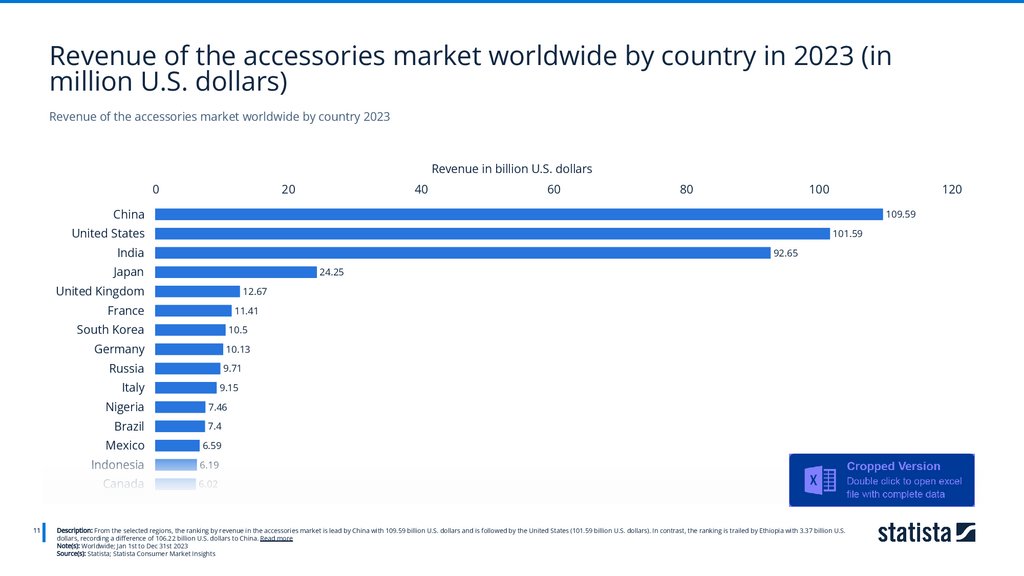
Revenue of the accessories market worldwide by country in 2023 (inmillion U.S. dollars)
Revenue of the accessories market worldwide by country 2023
Revenue in billion U.S. dollars
0
20
40
60
80
100
120
China
109.59
United States
101.59
India
92.65
Japan
24.25
United Kingdom
12.67
France
11
11.41
South Korea
10.5
Germany
10.13
Russia
9.71
Italy
9.15
Nigeria
7.46
Brazil
7.4
Mexico
6.59
Indonesia
6.19
Canada
6.02
Description: From the selected regions, the ranking by revenue in the accessories market is lead by China with 109.59 billion U.S. dollars and is followed by the United States (101.59 billion U.S. dollars). In contrast, the ranking is trailed by Ethiopia with 3.37 billion U.S.
dollars, recording a difference of 106.22 billion U.S. dollars to China. Read more
Note(s): Worldwide; Jan 1st to Dec 31st 2023
Source(s): Statista; Statista Consumer Market Insights
13.
Volume in the Women's Apparel market for different segments Worldwidefrom 2018 to 2028 (in million pieces)
Volume in the Women's Apparel market Worldwide 2018-2028
T-Shirts for women
Night & Underwear for women
Trousers for women
Jerseys, Sweatshirts & Pullovers for women
Dresses & Skirts for women
Sports & Swimwear for women
Shirts & Blouses for women
Coats & Jackets for women
Blazers for women
Suits & Ensembles for women
60,000
In million pieces
50,000
40,000
30,000
20,000
10,000
0
12
2018
2019
2020
2021
2022
2023
2024
2025
2026
2027
Description: The volume is forecast to experience significant growth in all segments in 2028. Concerning the ten selected segments, the segment T-Shirts for women has the largest volume with 13.2 billion pieces. Contrastingly, Suits & Ensembles for women is ranked
last, with 361.02 million pieces. Their difference, compared to T-Shirts for women, lies at 12.9 billion pieces. Read more
Note(s): Worldwide
Source(s): Statista; Statista Market Insights
2028
14.
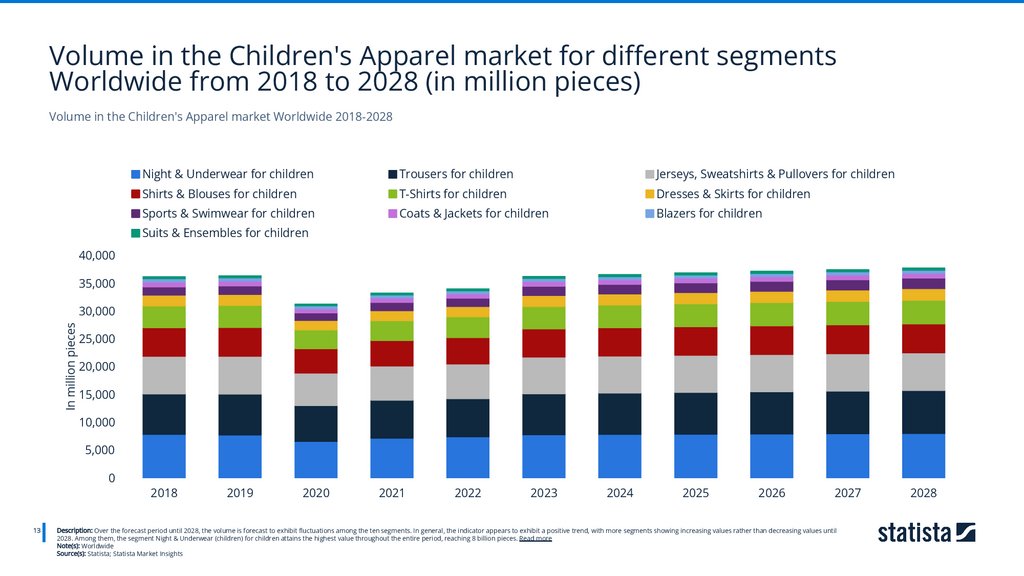
Volume in the Children's Apparel market for different segmentsWorldwide from 2018 to 2028 (in million pieces)
Volume in the Children's Apparel market Worldwide 2018-2028
Night & Underwear for children
Trousers for children
Jerseys, Sweatshirts & Pullovers for children
Shirts & Blouses for children
T-Shirts for children
Dresses & Skirts for children
Sports & Swimwear for children
Coats & Jackets for children
Blazers for children
Suits & Ensembles for children
40,000
35,000
In million pieces
30,000
25,000
20,000
15,000
10,000
5,000
0
13
2018
2019
2020
2021
2022
2023
2024
2025
2026
2027
Description: Over the forecast period until 2028, the volume is forecast to exhibit fluctuations among the ten segments. In general, the indicator appears to exhibit a positive trend, with more segments showing increasing values rather than decreasing values until
2028. Among them, the segment Night & Underwear (children) for children attains the highest value throughout the entire period, reaching 8 billion pieces. Read more
Note(s): Worldwide
Source(s): Statista; Statista Market Insights
2028
15.
Volume in the Men's Apparel market for different segments Worldwidefrom 2018 to 2028 (in million pieces)
Volume in the Men's Apparel market Worldwide 2018-2028
T-Shirts for men
Socks for men
Trousers for men
Shirts for men
Jerseys, Sweatshirts & Pullovers for men
Night & Underwear for men
Sports & Swimwear for men
Coats & Jackets for men
Blazers for men
Suits for men
40,000
35,000
In million pieces
30,000
25,000
20,000
15,000
10,000
5,000
0
14
2018
2019
2020
2021
2022
2023
2024
2025
2026
2027
Description: The volume is forecast to experience significant growth in all segments in 2028. Especially notable is the remarkably robust growth observed in the T-Shirts for men segment as we approach the end of the forecast period. This value, reaching 187 million
pieces, stands out significantly compared to the average changes, which are estimated at 52.23 million pieces. Read more
Note(s): Worldwide
Source(s): Statista; Statista Market Insights
2028
16.
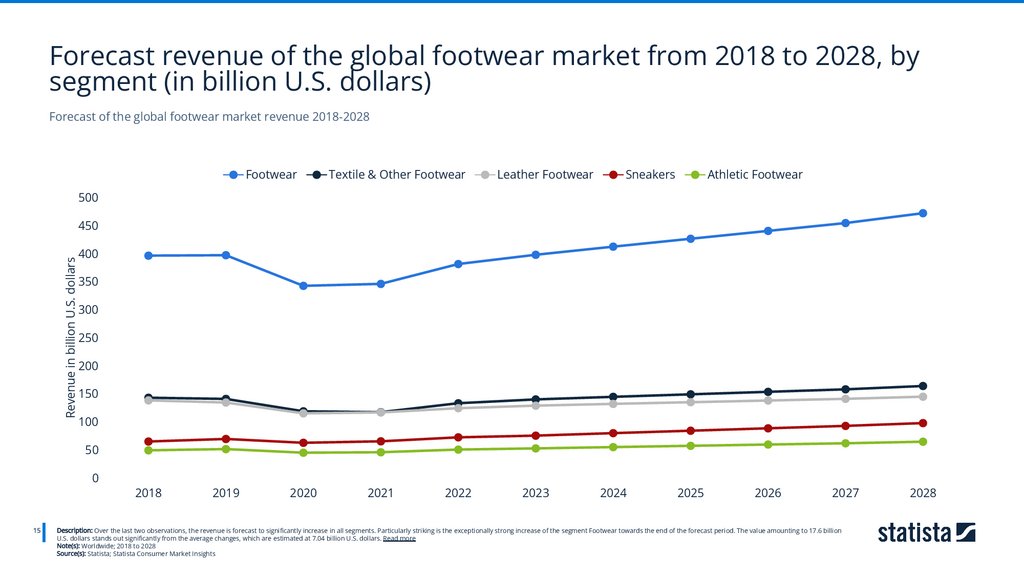
Forecast revenue of the global footwear market from 2018 to 2028, bysegment (in billion U.S. dollars)
Forecast of the global footwear market revenue 2018-2028
Footwear
Textile & Other Footwear
Leather Footwear
Sneakers
Athletic Footwear
500
450
Revenue in billion U.S. dollars
400
350
300
250
200
150
100
50
0
15
2018
2019
2020
2021
2022
2023
2024
2025
2026
2027
Description: Over the last two observations, the revenue is forecast to significantly increase in all segments. Particularly striking is the exceptionally strong increase of the segment Footwear towards the end of the forecast period. The value amounting to 17.6 billion
U.S. dollars stands out significantly from the average changes, which are estimated at 7.04 billion U.S. dollars. Read more
Note(s): Worldwide; 2018 to 2028
Source(s): Statista; Statista Consumer Market Insights
2028
17.
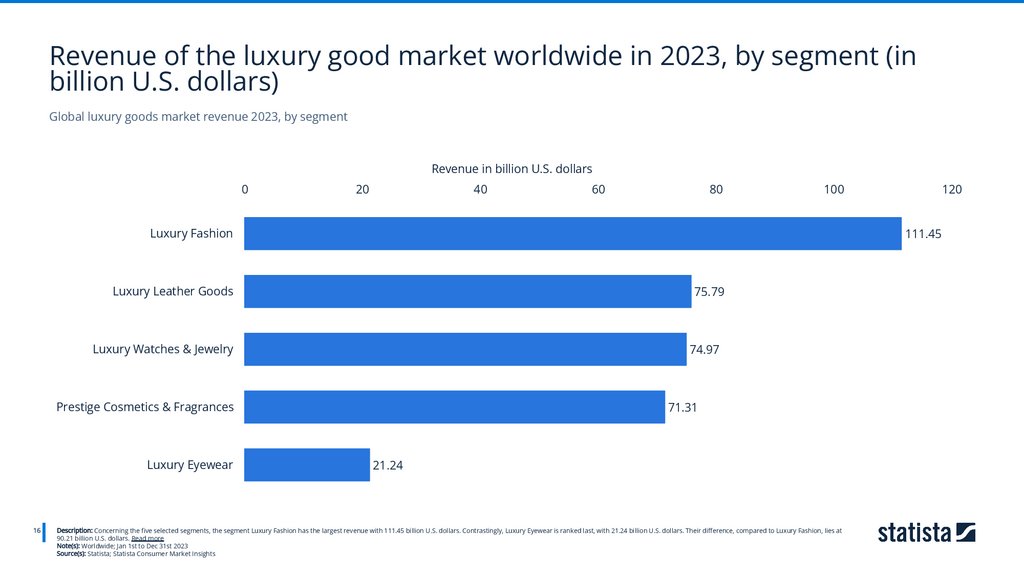
Revenue of the luxury good market worldwide in 2023, by segment (inbillion U.S. dollars)
Global luxury goods market revenue 2023, by segment
Revenue in billion U.S. dollars
0
20
40
60
80
100
Luxury Fashion
111.45
Luxury Leather Goods
75.79
Luxury Watches & Jewelry
74.97
Prestige Cosmetics & Fragrances
Luxury Eyewear
16
120
71.31
21.24
Description: Concerning the five selected segments, the segment Luxury Fashion has the largest revenue with 111.45 billion U.S. dollars. Contrastingly, Luxury Eyewear is ranked last, with 21.24 billion U.S. dollars. Their difference, compared to Luxury Fashion, lies at
90.21 billion U.S. dollars. Read more
Note(s): Worldwide; Jan 1st to Dec 31st 2023
Source(s): Statista; Statista Consumer Market Insights
18.
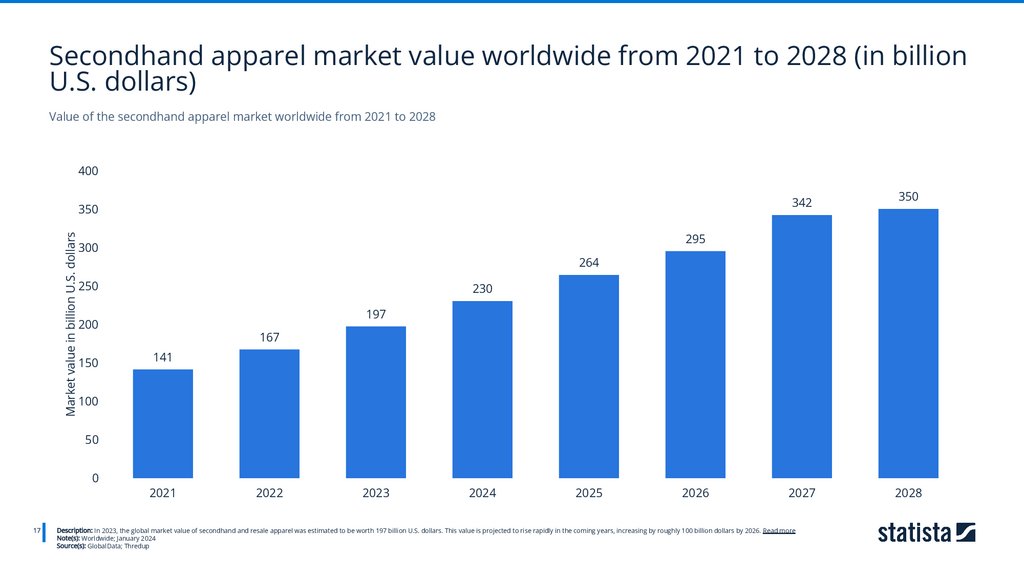
Secondhand apparel market value worldwide from 2021 to 2028 (in billionU.S. dollars)
Value of the secondhand apparel market worldwide from 2021 to 2028
400
342
Market value in billion U.S. dollars
350
295
300
264
250
230
197
200
150
350
167
141
100
50
0
17
2021
2022
2023
2024
2025
2026
2027
Description: In 2023, the global market value of secondhand and resale apparel was estimated to be worth 197 billion U.S. dollars. This value is projected to rise rapidly in the coming years, increasing by roughly 100 billion dollars by 2026. Read more
Note(s): Worldwide; January 2024
Source(s): GlobalData; Thredup
2028
19.
CHAPTER 03Trade
20.
Export value of non-textile apparel goods worldwide from 2003 to 2022 (inbillion U.S. dollars)
Non-textile apparel: export value worldwide 2003-2022
60
55
Export value in billion U.S. dollars
50
45
40
35
30
25
20
15
10
19
2003
2004
2005
2006
2007
2008
2009
2010
2011
2012
2013
2014
2015
2016
2017
2018
2019
2020
Description: In 2022, the worldwide export value of non-textile apparel articles was approximately 40 billion U.S. dollars, down from 56.7 billion U.S. dollars registered a year earlier. The global import value of non-textile apparel articles was 41.1 billion U.S. dollars in
2022. Read more
Note(s): Worldwide; 2022
Source(s): UN Comtrade
2021
2022
21.
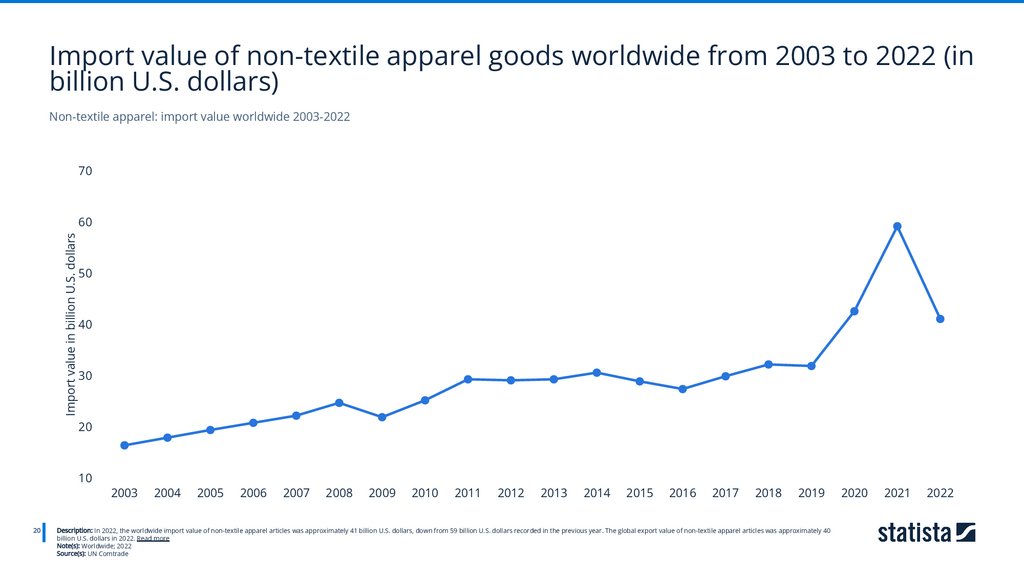
Import value of non-textile apparel goods worldwide from 2003 to 2022 (inbillion U.S. dollars)
Non-textile apparel: import value worldwide 2003-2022
70
Import value in billion U.S. dollars
60
50
40
30
20
10
20
2003
2004
2005
2006
2007
2008
2009
2010
2011
2012
2013
2014
2015
2016
2017
2018
2019
Description: In 2022, the worldwide import value of non-textile apparel articles was approximately 41 billion U.S. dollars, down from 59 billion U.S. dollars recorded in the previous year. The global export value of non-textile apparel articles was approximately 40
billion U.S. dollars in 2022. Read more
Note(s): Worldwide; 2022
Source(s): UN Comtrade
2020
2021
2022
22.
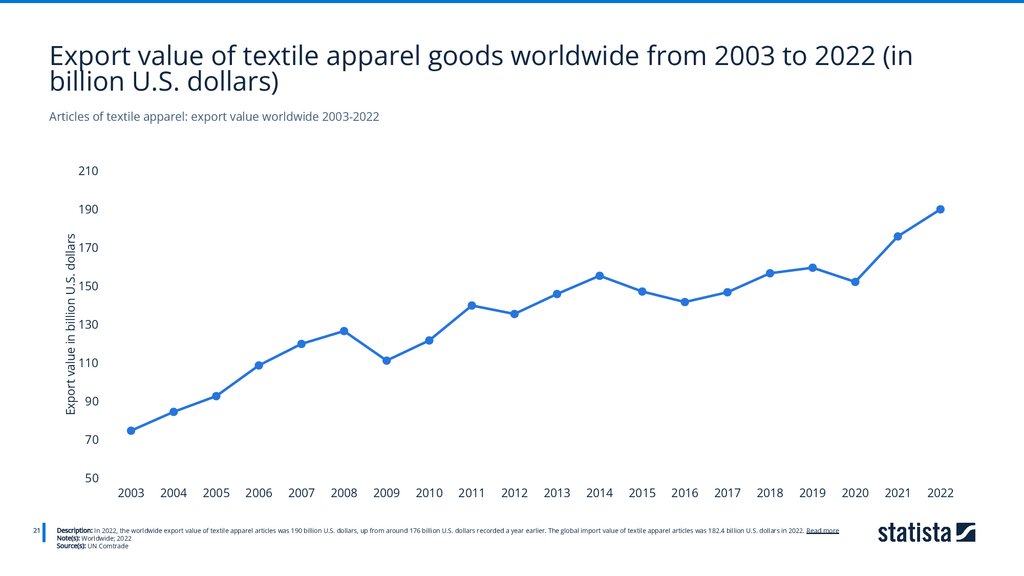
Export value of textile apparel goods worldwide from 2003 to 2022 (inbillion U.S. dollars)
Articles of textile apparel: export value worldwide 2003-2022
210
Export value in billion U.S. dollars
190
170
150
130
110
90
70
50
21
2003
2004
2005
2006
2007
2008
2009
2010
2011
2012
2013
2014
2015
2016
2017
2018
2019
Description: In 2022, the worldwide export value of textile apparel articles was 190 billion U.S. dollars, up from around 176 billion U.S. dollars recorded a year earlier. The global import value of textile apparel articles was 182.4 billion U.S. dollars in 2022. Read more
Note(s): Worldwide; 2022
Source(s): UN Comtrade
2020
2021
2022
23.
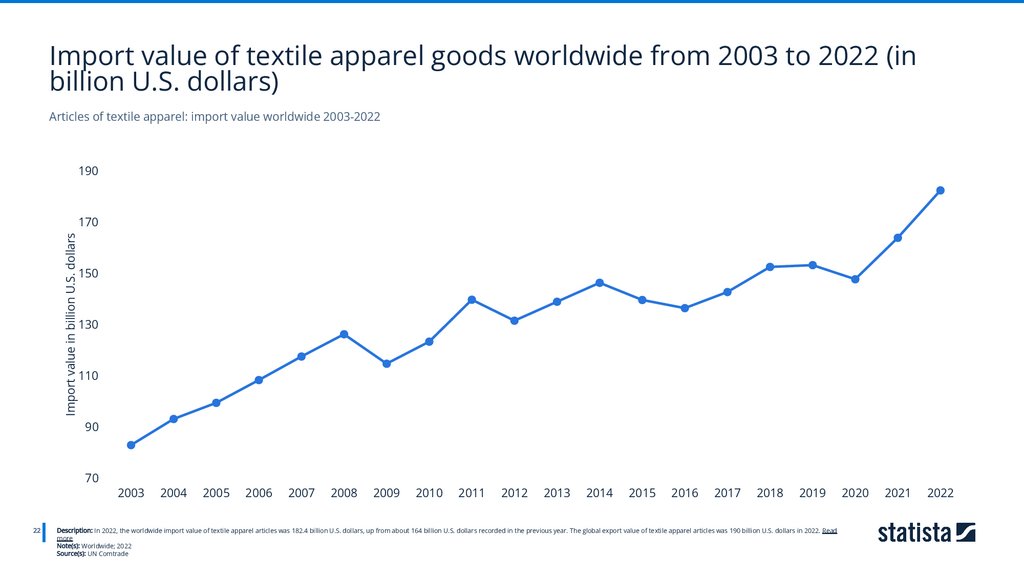
Import value of textile apparel goods worldwide from 2003 to 2022 (inbillion U.S. dollars)
Articles of textile apparel: import value worldwide 2003-2022
190
Import value in billion U.S. dollars
170
150
130
110
90
70
22
2003
2004
2005
2006
2007
2008
2009
2010
2011
2012
2013
2014
2015
2016
2017
2018
2019
Description: In 2022, the worldwide import value of textile apparel articles was 182.4 billion U.S. dollars, up from about 164 billion U.S. dollars recorded in the previous year. The global export value of textile apparel articles was 190 billion U.S. dollars in 2022. Read
more
Note(s): Worldwide; 2022
Source(s): UN Comtrade
2020
2021
2022
24.
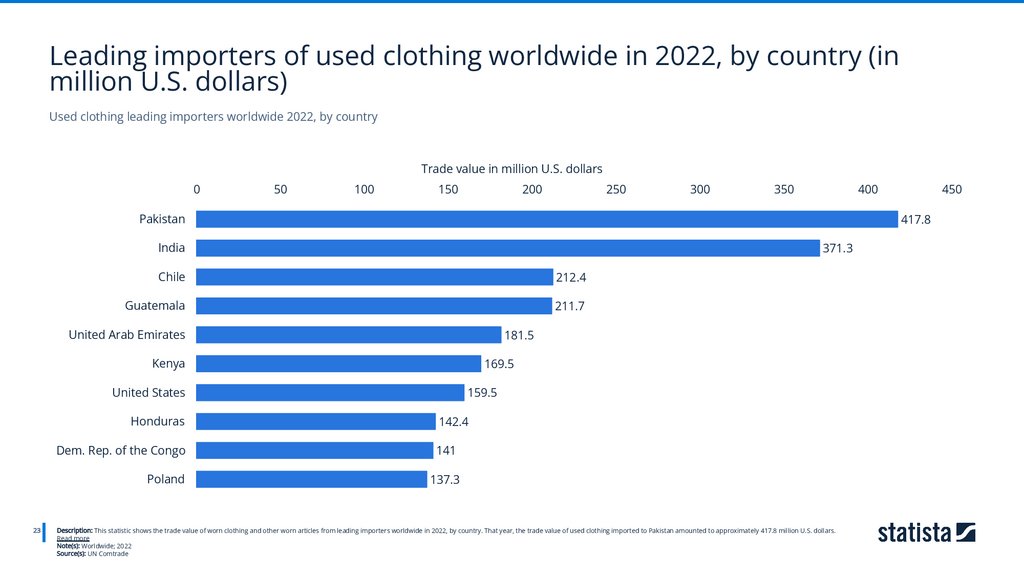
Leading importers of used clothing worldwide in 2022, by country (inmillion U.S. dollars)
Used clothing leading importers worldwide 2022, by country
Trade value in million U.S. dollars
0
50
100
150
200
250
300
350
400
Pakistan
417.8
India
371.3
Chile
212.4
Guatemala
211.7
United Arab Emirates
181.5
Kenya
169.5
United States
Honduras
23
450
159.5
142.4
Dem. Rep. of the Congo
141
Poland
137.3
Description: This statistic shows the trade value of worn clothing and other worn articles from leading importers worldwide in 2022, by country. That year, the trade value of used clothing imported to Pakistan amounted to approximately 417.8 million U.S. dollars.
Read more
Note(s): Worldwide; 2022
Source(s): UN Comtrade
25.
Leading exporters of worn clothing worldwide in 2022, by country (inmillion U.S. dollars)
Used clothing leading exporters worldwide 2022, by country
Trade value in million U.S. dollars
0
200
400
600
800
1,000
United States
1,026.5
China
911.7
United Kingdom
454
Rep. of Korea
374.8
Germany
355.7
Pakistan
310
United Arab Emirates
278.6
Netherlands
255.8
Poland
Canada
24
1,200
224.2
169.3
Description: This statistic shows the trade value of worn clothing and other worn articles from leading exporters worldwide in 2022, by country. That year, the trade value of used clothing exported from the United States exceeded one billion U.S. dollars. Read more
Note(s): Worldwide; 2022
Source(s): UN Comtrade
26.
CHAPTER 04Leading companies
27.
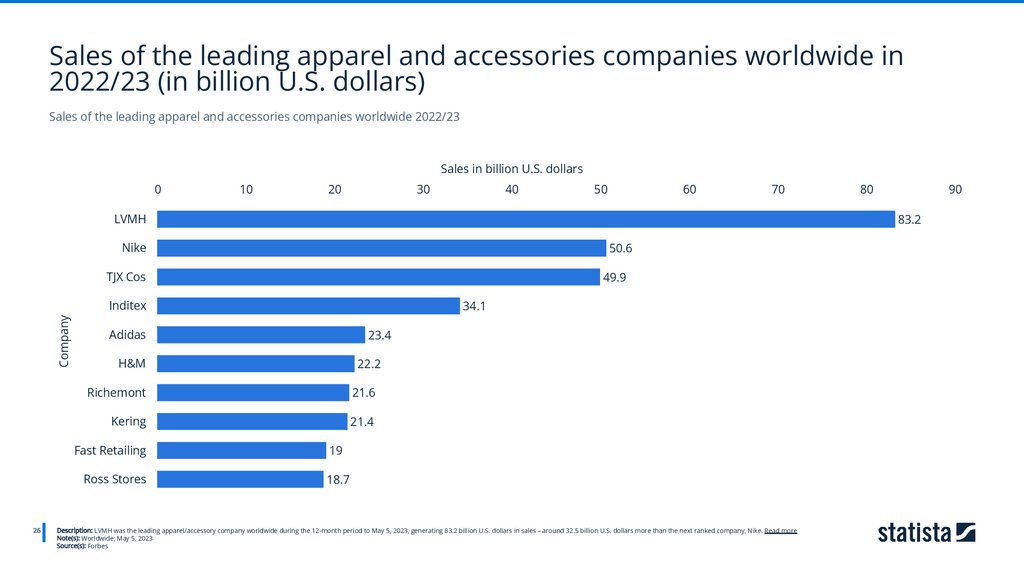
Sales of the leading apparel and accessories companies worldwide in2022/23 (in billion U.S. dollars)
Sales of the leading apparel and accessories companies worldwide 2022/23
Sales in billion U.S. dollars
0
10
20
30
40
50
60
70
LVMH
Company
90
83.2
Nike
50.6
TJX Cos
49.9
Inditex
26
80
34.1
Adidas
23.4
H&M
22.2
Richemont
21.6
Kering
21.4
Fast Retailing
19
Ross Stores
18.7
Description: LVMH was the leading apparel/accessory company worldwide during the 12-month period to May 5, 2023, generating 83.2 billion U.S. dollars in sales – around 32.5 billion U.S. dollars more than the next ranked company, Nike. Read more
Note(s): Worldwide; May 5, 2023
Source(s): Forbes
28.
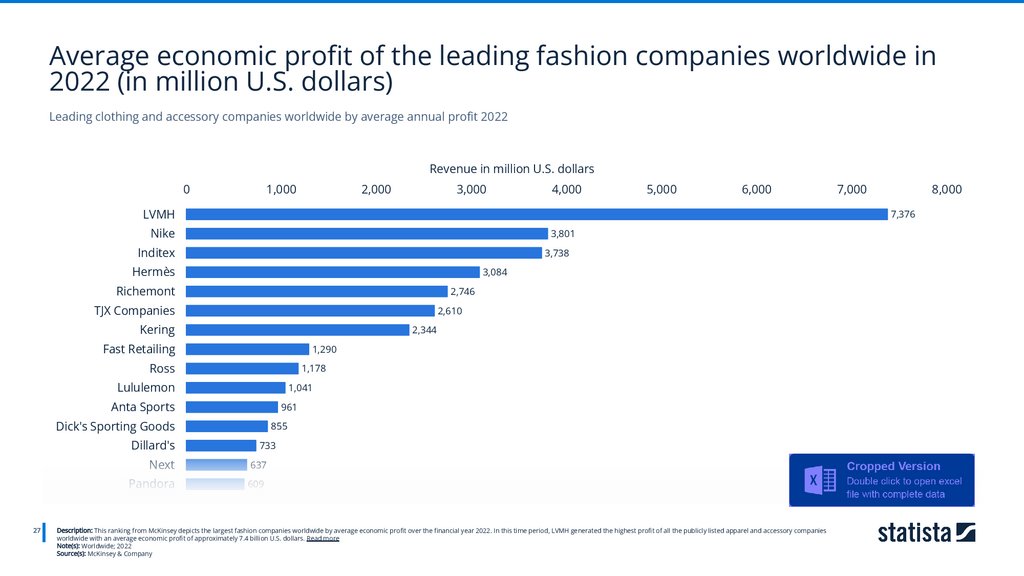
Average economic profit of the leading fashion companies worldwide in2022 (in million U.S. dollars)
Leading clothing and accessory companies worldwide by average annual profit 2022
Revenue in million U.S. dollars
0
1,000
2,000
3,000
4,000
5,000
6,000
LVMH
3,801
Inditex
3,738
Hermès
3,084
Richemont
2,746
TJX Companies
2,610
Kering
2,344
Fast Retailing
1,290
Ross
1,178
Lululemon
1,041
Anta Sports
961
Dick's Sporting Goods
27
8,000
7,376
Nike
Dillard's
7,000
855
733
Next
637
Pandora
609
Description: This ranking from McKinsey depicts the largest fashion companies worldwide by average economic profit over the financial year 2022. In this time period, LVMH generated the highest profit of all the publicly listed apparel and accessory companies
worldwide with an average economic profit of approximately 7.4 billion U.S. dollars. Read more
Note(s): Worldwide; 2022
Source(s): McKinsey & Company
29.
Leading clothing companies worldwide as of December 2023, by marketcapitalization (in billion U.S. dollars)
Leading clothing companies by market capitalization worldwide as of December 2023
450
Market capitalization in billion U.S. dollars
400
400.22
350
300
250
184.4
200
139.53
150
131.86
104.72
100
63.66
58.55
54.75
46.38
Lululemon
athletica
Cintas
Kering
Ross Stores
50
0
28
76.91
LVMH
Nike
Dior
Inditex
TJX Companies Fast Retailing
Description: In December 2023, LVMH was by far the clothing company with the highest market capitalization, at approximately 400 billion U.S. dollars. The luxury giant had reached the 500 billion mark earlier in the year in April 2023, but dropped in value since then.
LVMH's market capitalization was almost 220 billion dollars more than Nike, the company in second place. Dior made up the top three companies. As would be expected, several of the companies in this list can also be found in the list of [...] Read more
Note(s): Worldwide; December 14, 2023
Source(s): CompaniesMarketCap.com
30.
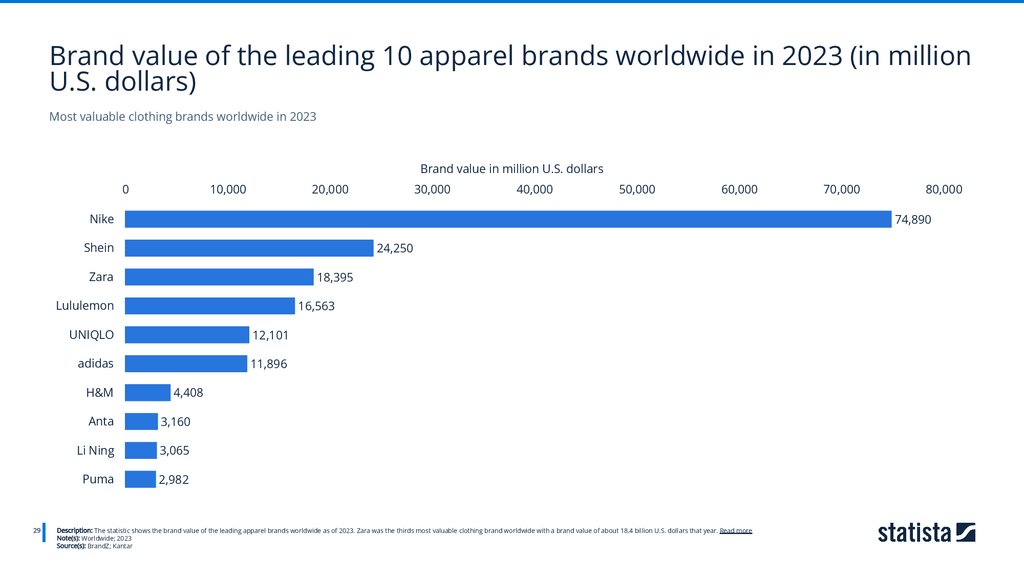
Brand value of the leading 10 apparel brands worldwide in 2023 (in millionU.S. dollars)
Most valuable clothing brands worldwide in 2023
Brand value in million U.S. dollars
0
10,000
20,000
30,000
40,000
50,000
60,000
Nike
24,250
Zara
18,395
Lululemon
29
80,000
74,890
Shein
16,563
UNIQLO
12,101
adidas
11,896
H&M
70,000
4,408
Anta
3,160
Li Ning
3,065
Puma
2,982
Description: The statistic shows the brand value of the leading apparel brands worldwide as of 2023. Zara was the thirds most valuable clothing brand worldwide with a brand value of about 18.4 billion U.S. dollars that year. Read more
Note(s): Worldwide; 2023
Source(s): BrandZ; Kantar
31.
Brand value of the leading 10 most valuable luxury brands worldwide in2023 (in million U.S. dollars)
Most valuable global luxury brands 2023
Brand value in million U.S. dollars
0
20,000
40,000
60,000
80,000
100,000
Louis Vuitton France
76,299
Chanel France
55,939
Gucci Italy
26,306
Dior France
Rolex United Kingdom
30
140,000
124,822
Hermès France
Cartier France
120,000
11,442
9,725
7,899
Tiffany & Co. United States
6,124
Saint-Laurent / Yves Saint Laurent France
6,023
Prada Italy
4,921
Description: This statistic depicts the brand value of the leading 10 most valuable luxury brands worldwide in 2023. In that year, Chanel was the third most valuable luxury brand worldwide with a brand value of about 56 billion U.S. dollars. Read more
Note(s): Worldwide; 2023
Source(s): Kantar Millward Brown
32.
Most transparent fashion companies worldwide in 2023, by transparencyindex score
Most transparent clothing companies worldwide in 2023
Transparency index score
0%
10%
20%
30%
40%
50%
60%
70%
80%
OVS
83%
Gucci
80%
Kmart Australia
76%
Target Australia
76%
United Colors of Benetton
73%
H&M
71%
C&A
31
90%
68%
Puma
66%
The North Face
66%
Timberland
66%
Vans
65%
Dressmann
65%
Calzedonia
63%
Intimissimi
63%
Tezenis
63%
Description: The environmental and social impact of fashion companies is increasingly under scrutiny. However, not all companies make the relevant information and metrics available in order to effectively ascertain their sustainability. In a 2023 list compiled to rank
the most transparent fashion companies in the world, OVS came out as the highest scoring fashion brand in terms of transparency. The Italian retailer received a transparency index score of 83 percent. This was twelve percent higher than [...] Read more
Note(s): Worldwide; 2023
Source(s): Fashion Revolution
33.
CHAPTER 05Consumer outlook
34.
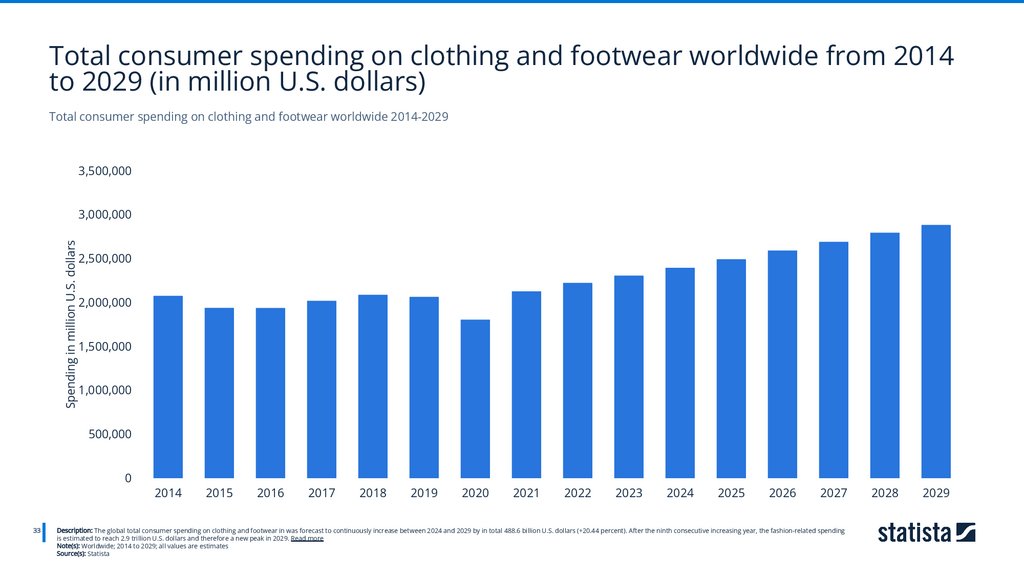
Total consumer spending on clothing and footwear worldwide from 2014to 2029 (in million U.S. dollars)
Total consumer spending on clothing and footwear worldwide 2014-2029
3,500,000
Spending in million U.S. dollars
3,000,000
2,500,000
2,000,000
1,500,000
1,000,000
500,000
0
33
2014
2015
2016
2017
2018
2019
2020
2021
2022
2023
2024
2025
2026
2027
Description: The global total consumer spending on clothing and footwear in was forecast to continuously increase between 2024 and 2029 by in total 488.6 billion U.S. dollars (+20.44 percent). After the ninth consecutive increasing year, the fashion-related spending
is estimated to reach 2.9 trillion U.S. dollars and therefore a new peak in 2029. Read more
Note(s): Worldwide; 2014 to 2029; all values are estimates
Source(s): Statista
2028
2029
35.
Per capita consumer spending on clothing and footwear worldwide from2014 to 2029 (in U.S. dollars)
Per capita consumer spending on clothing and footwear worldwide 2014-2029
400
Per capita spending in U.S. dollars
350
300
294.16
271.64
268.33
276.72
283.05
280.67
276.96
291.02
299.56
308.58
318.51
328.64
338.51
348.85
357.32
239.89
250
200
150
100
50
0
34
2014
2015
2016
2017
2018
2019
2020
2021
2022
2023
2024
2025
2026
2027
Description: The global per capita consumer spending on clothing and footwear in was forecast to continuously increase between 2024 and 2029 by in total 48.7 U.S. dollars (+15.78 percent). After the ninth consecutive increasing year, the fashion-related per capita
spending is estimated to reach 357.32 U.S. dollars and therefore a new peak in 2029. Read more
Note(s): Worldwide; 2014 to 2029; all values are estimates
Source(s): Statista
2028
2029
36.
Per-capita volume sales in the apparel market worldwide, by country in2023 (in pieces)
Per-capita volume sales in the apparel market worldwide by country in 2023
Market volume
0
20
40
60
80
100
Hong Kong
117.29
Netherlands
97.41
United States
88.03
Ireland
75.11
Croatia
69.41
Australia
63.45
Austria
35
61.59
United Kingdom
60.21
Sweden
59.47
Germany
55.12
Norway
54.89
Turkey
54.68
Switzerland
120
52.85
Canada
49.22
Slovakia
48.94
Description: Hong Kong is leading the ranking by average volume per capita in the apparel market, recording 117.29 pieces. Following closely behind is the Netherlands with 97.41 pieces, while the Philippines is trailing the ranking with 2.67 pieces, resulting in a
difference of 114.62 pieces to the ranking leader, Hong Kong. Read more
Note(s): Jan 1st to Dec 31st 2023
Source(s): Statista
140
37.
Share of lifestyle brand consumers who care more about the sustainabilityof products in 2023 than they did a year ago in selected countries
Consumers more concerned about sustainability in 2023 than a year ago worldwide
80%
70%
Share of consumers
60%
50%
40%
76%
74%
70%
70%
United Kingdom
United States
30%
64%
20%
10%
0%
36
France
Italy
Description: According to a survey ran in October 2023, France had the highest share of active and casual lifestyle brand purchasers who were more concerned about the sustainability of products than they were the previous year, with over three-quarters of
respondents making this claim. Germany had the lowest share with 64 percent. Read more
Note(s): Worldwide; October 23 to 30, 2023; 11,551 respondents; 18 to 55; Among active/casual lifestlyle brand purchasers
Source(s): Morning Consult; Stifel
Germany
38.
Share of lifestyle brand purchasers intending to purchase fewer productsfor the sake of sustainability in selected countries in 2023
Consumer intention to buy fewer items for sustainability in selected countries 2023
80%
70%
Share of consumers
60%
50%
40%
71%
30%
66%
65%
63%
60%
Germany
United Kingdom
Italy
United States
20%
10%
0%
37
France
Description: According to a survey in October 2023, France has the highest share of active and casual lifestyle brand purchasers who intend to buy fewer products in order to live more sustainably, with 71 percent of respondents making this claim. The United States
had the lowest share with 60 percent. Read more
Note(s): Worldwide; October 23 to 30, 2023; 11,551 respondents; 18 to 55; Among active/casual lifestyle brand purchasers
Source(s): Morning Consult; Stifel
39.
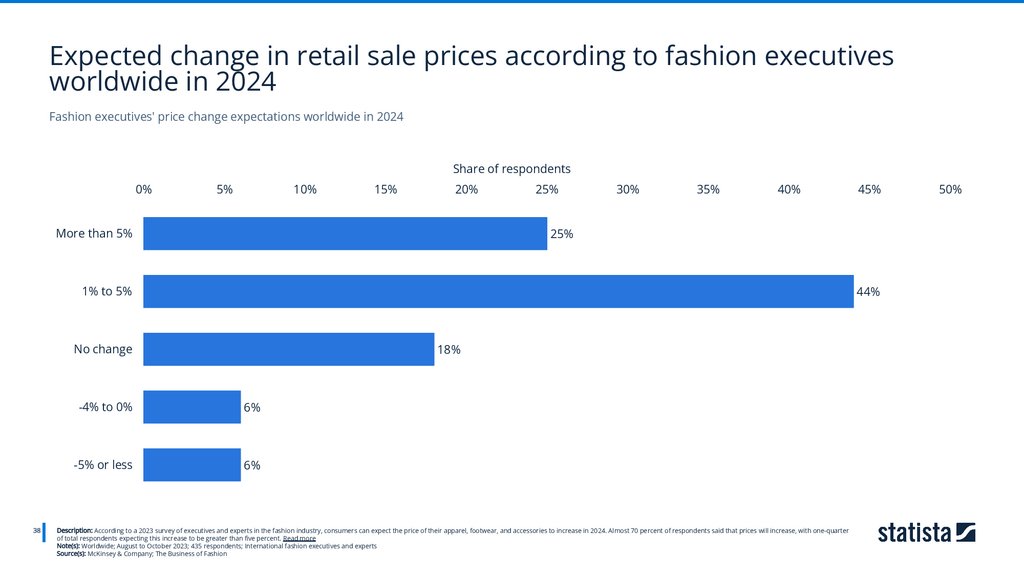
Expected change in retail sale prices according to fashion executivesworldwide in 2024
Fashion executives' price change expectations worldwide in 2024
Share of respondents
0%
5%
10%
15%
20%
More than 5%
25%
30%
35%
40%
25%
1% to 5%
44%
No change
38
45%
18%
-4% to 0%
6%
-5% or less
6%
Description: According to a 2023 survey of executives and experts in the fashion industry, consumers can expect the price of their apparel, footwear, and accessories to increase in 2024. Almost 70 percent of respondents said that prices will increase, with one-quarter
of total respondents expecting this increase to be greater than five percent. Read more
Note(s): Worldwide; August to October 2023; 435 respondents; International fashion executives and experts
Source(s): McKinsey & Company; The Business of Fashion
50%
40.
SourcesBrandZ
CompaniesMarketCap.com
Eurostat
Fashion Revolution
Forbes
GlobalData
IMF
Kantar
Kantar Millward Brown
McKinsey & Company
Morning Consult
Statista
Statista Consumer Market Insights
Statista Market Insights
Stifel
The Business of Fashion
Thredup
UN Comtrade
United Nations
World Bank
WTO
39