


 medicine
Similar presentations:


Blood Pressure Disease by Slidesgo
1.
BLOODPRESSURE
DISEASE
Here is where your presentation begins
2.
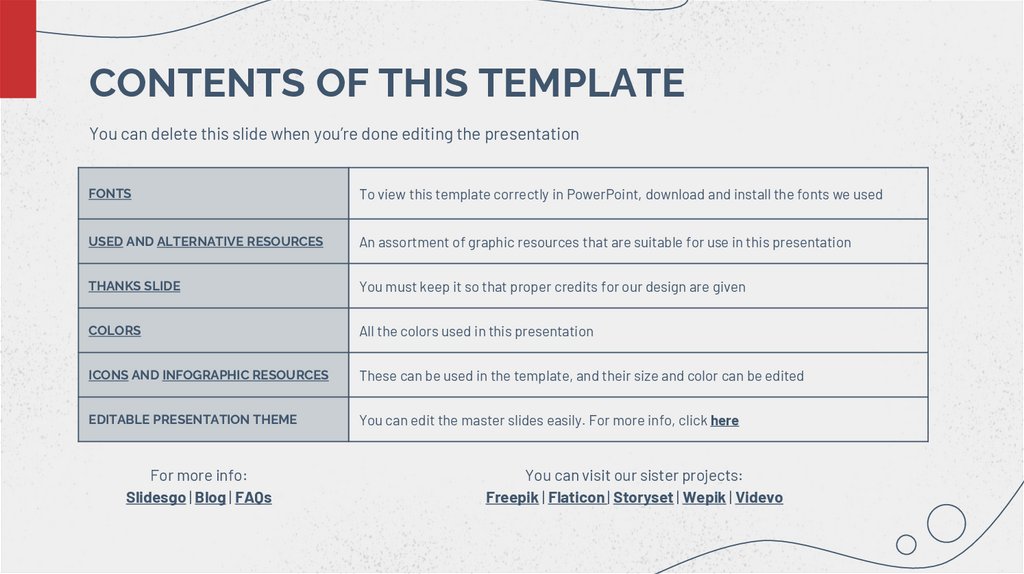
CONTENTS OF THIS TEMPLATEYou can delete this slide when you’re done editing the presentation
FONTS
To view this template correctly in PowerPoint, download and install the fonts we used
USED AND ALTERNATIVE RESOURCES
An assortment of graphic resources that are suitable for use in this presentation
THANKS SLIDE
You must keep it so that proper credits for our design are given
COLORS
All the colors used in this presentation
ICONS AND INFOGRAPHIC RESOURCES
These can be used in the template, and their size and color can be edited
EDITABLE PRESENTATION THEME
You can edit the master slides easily. For more info, click here
For more info:
Slidesgo | Blog | FAQs
You can visit our sister projects:
Freepik | Flaticon | Storyset | Wepik | Videvo
3.
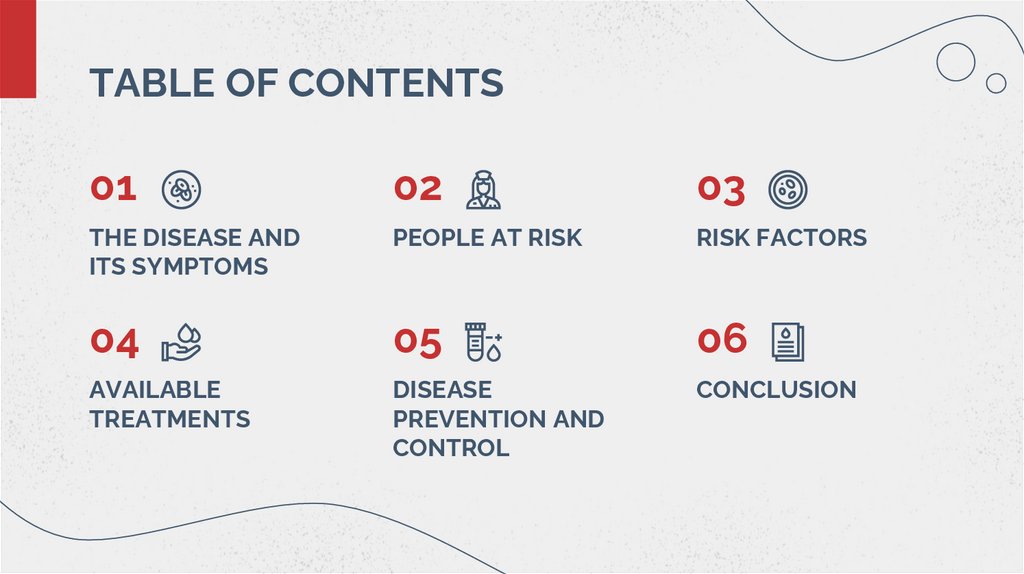
TABLE OF CONTENTS01
02
03
THE DISEASE AND
ITS SYMPTOMS
PEOPLE AT RISK
RISK FACTORS
04
05
06
AVAILABLE
TREATMENTS
DISEASE
PREVENTION AND
CONTROL
CONCLUSION
4.
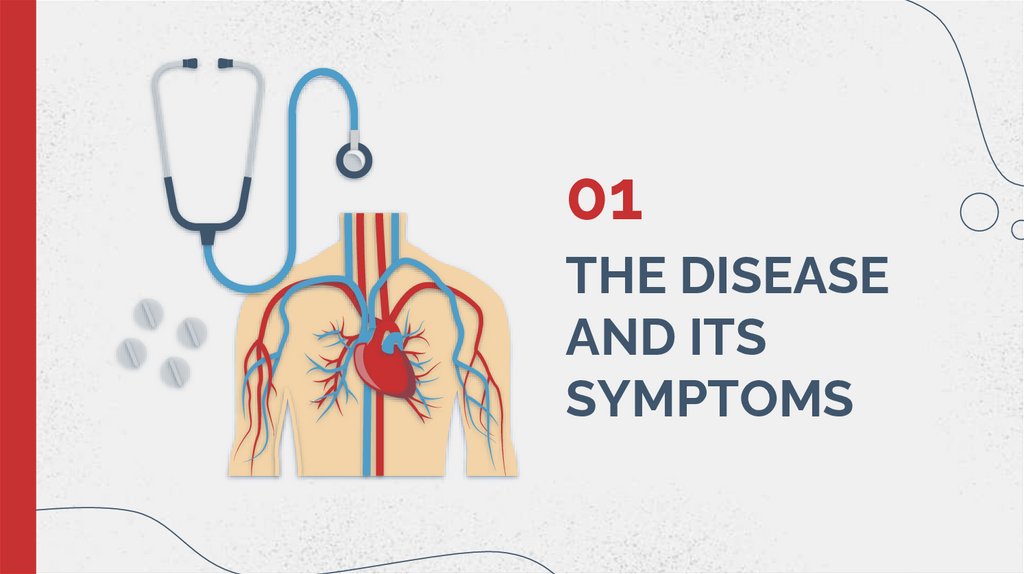
01THE DISEASE
AND ITS
SYMPTOMS
5.
INTRODUCTION TOTHE DISEASE
On the first part of the presentation, it’s important
to give an overview of the disease you’re going to
speak about. This helps your audience understand:
The context
The health risks
Likelihood of developing it
Prevalence
6.
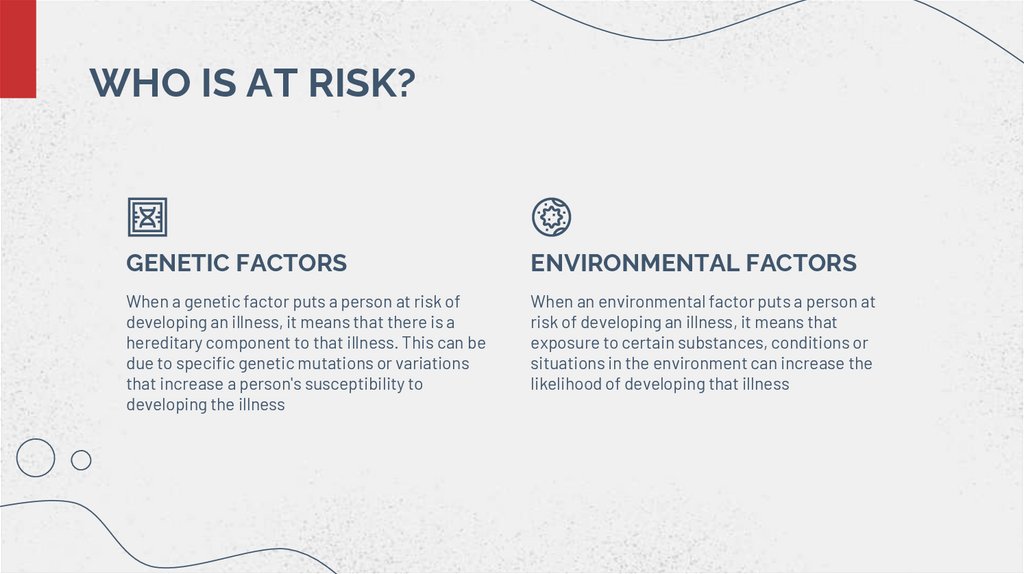
WHO IS AT RISK?GENETIC FACTORS
ENVIRONMENTAL FACTORS
When a genetic factor puts a person at risk of
developing an illness, it means that there is a
hereditary component to that illness. This can be
due to specific genetic mutations or variations
that increase a person's susceptibility to
developing the illness
When an environmental factor puts a person at
risk of developing an illness, it means that
exposure to certain substances, conditions or
situations in the environment can increase the
likelihood of developing that illness
7.
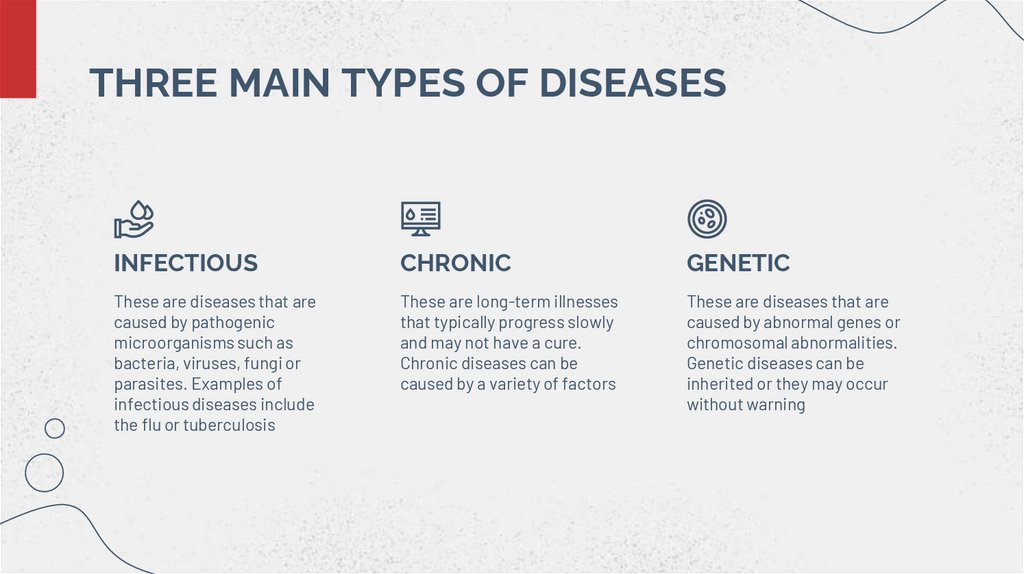
THREE MAIN TYPES OF DISEASESINFECTIOUS
CHRONIC
GENETIC
These are diseases that are
caused by pathogenic
microorganisms such as
bacteria, viruses, fungi or
parasites. Examples of
infectious diseases include
the flu or tuberculosis
These are long-term illnesses
that typically progress slowly
and may not have a cure.
Chronic diseases can be
caused by a variety of factors
These are diseases that are
caused by abnormal genes or
chromosomal abnormalities.
Genetic diseases can be
inherited or they may occur
without warning
8.
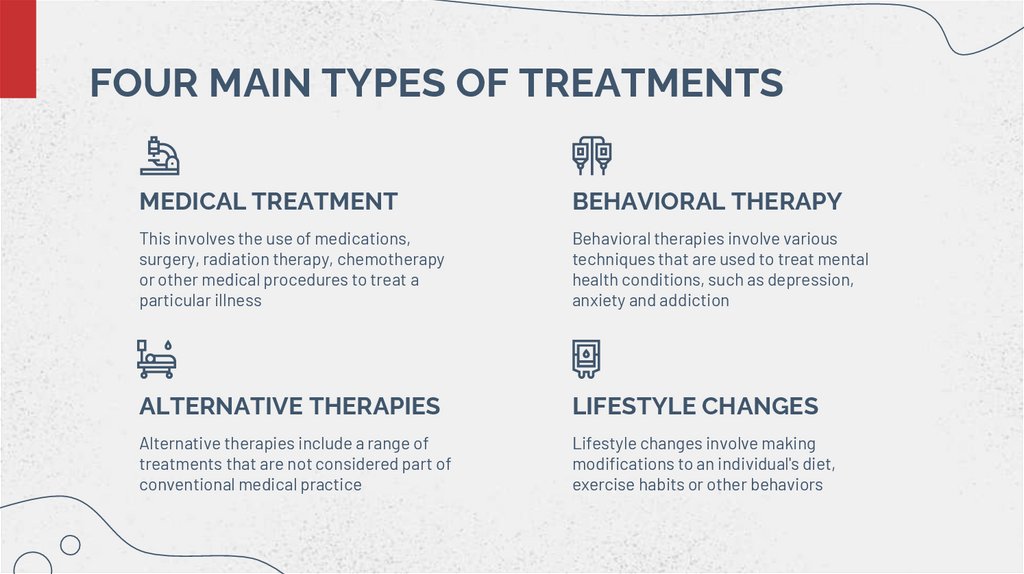
FOUR MAIN TYPES OF TREATMENTSMEDICAL TREATMENT
BEHAVIORAL THERAPY
This involves the use of medications,
surgery, radiation therapy, chemotherapy
or other medical procedures to treat a
particular illness
Behavioral therapies involve various
techniques that are used to treat mental
health conditions, such as depression,
anxiety and addiction
ALTERNATIVE THERAPIES
LIFESTYLE CHANGES
Alternative therapies include a range of
treatments that are not considered part of
conventional medical practice
Lifestyle changes involve making
modifications to an individual's diet,
exercise habits or other behaviors
9.
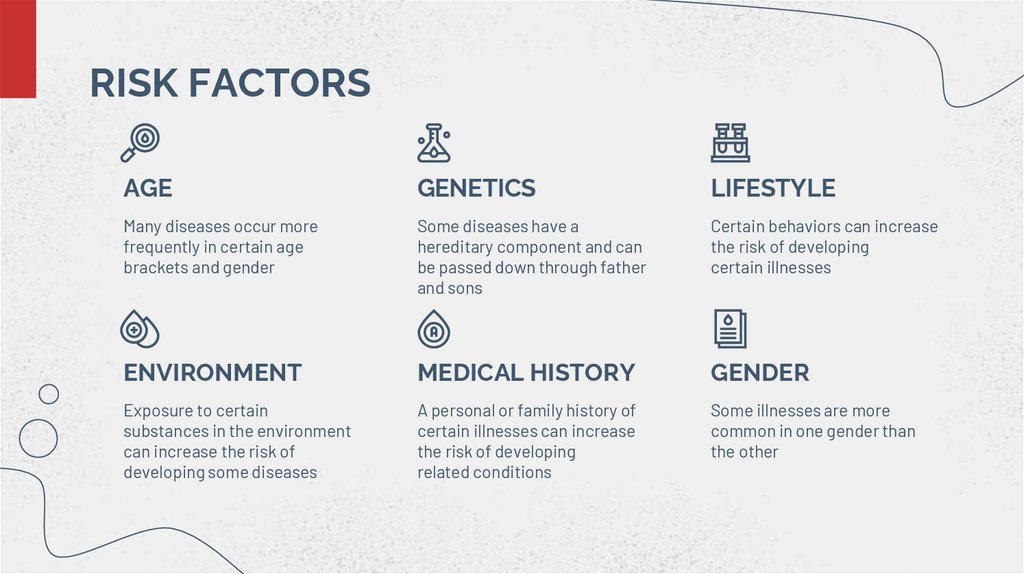
RISK FACTORSAGE
GENETICS
LIFESTYLE
Many diseases occur more
frequently in certain age
brackets and gender
Some diseases have a
hereditary component and can
be passed down through father
and sons
Certain behaviors can increase
the risk of developing
certain illnesses
ENVIRONMENT
MEDICAL HISTORY
GENDER
Exposure to certain
substances in the environment
can increase the risk of
developing some diseases
A personal or family history of
certain illnesses can increase
the risk of developing
related conditions
Some illnesses are more
common in one gender than
the other
10.
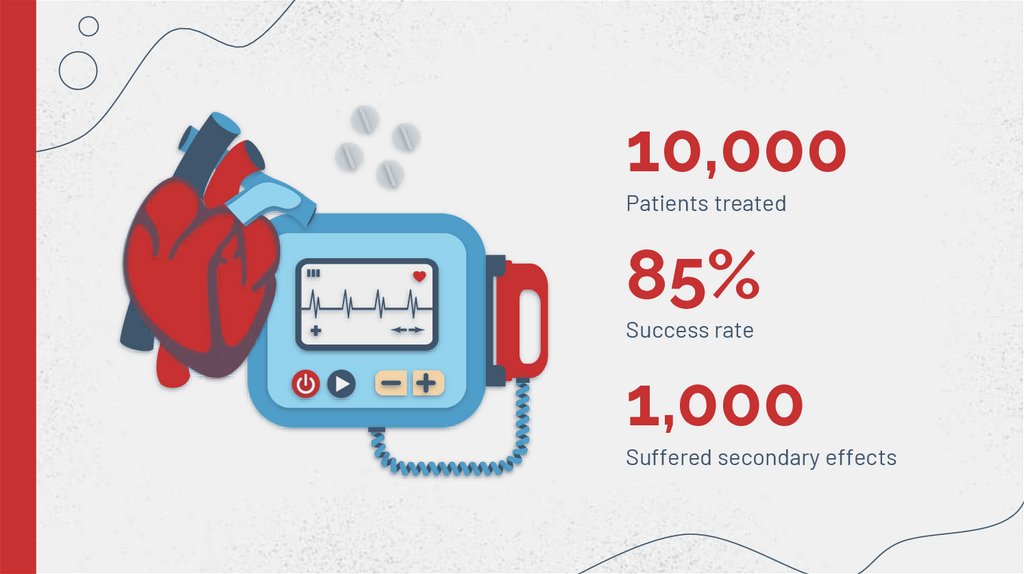
10,000Patients treated
85%
Success rate
1,000
Suffered secondary effects
11.
$1 billionInvestment in disease research is crucial for
improving public health outcomes, advancing
medicine and improving quality of life for
patients, which in turn has the potential for
significant economic growth and global
health benefits
12.
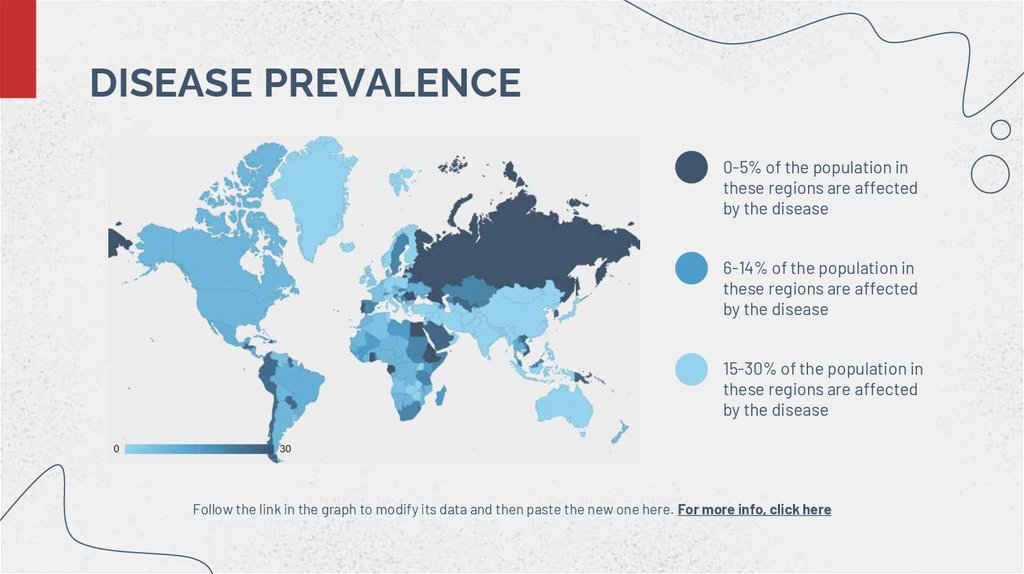
DISEASE PREVALENCE0-5% of the population in
these regions are affected
by the disease
6-14% of the population in
these regions are affected
by the disease
15-30% of the population in
these regions are affected
by the disease
Follow the link in the graph to modify its data and then paste the new one here. For more info, click here
13.
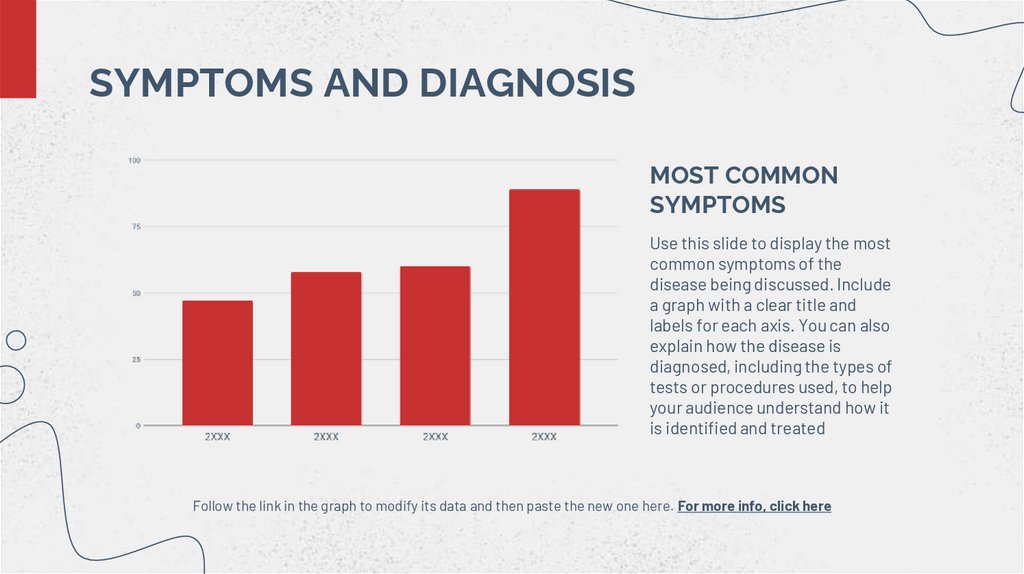
SYMPTOMS AND DIAGNOSISMOST COMMON
SYMPTOMS
Use this slide to display the most
common symptoms of the
disease being discussed. Include
a graph with a clear title and
labels for each axis. You can also
explain how the disease is
diagnosed, including the types of
tests or procedures used, to help
your audience understand how it
is identified and treated
Follow the link in the graph to modify its data and then paste the new one here. For more info, click here
14.
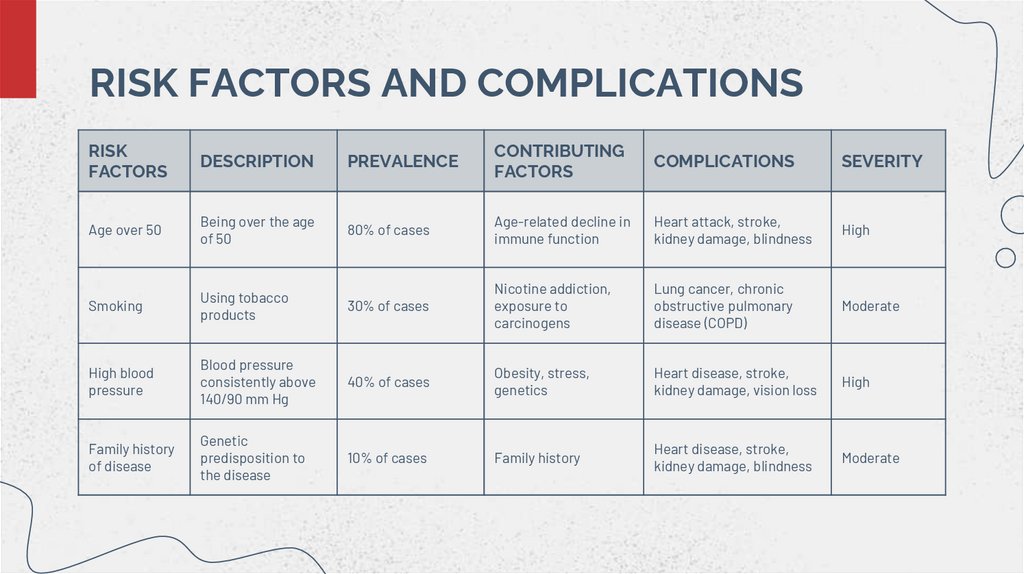
RISK FACTORS AND COMPLICATIONSRISK
FACTORS
DESCRIPTION
PREVALENCE
CONTRIBUTING
FACTORS
COMPLICATIONS
SEVERITY
Age over 50
Being over the age
of 50
80% of cases
Age-related decline in
immune function
Heart attack, stroke,
kidney damage, blindness
High
Smoking
Using tobacco
products
30% of cases
Nicotine addiction,
exposure to
carcinogens
Lung cancer, chronic
obstructive pulmonary
disease (COPD)
Moderate
High blood
pressure
Blood pressure
consistently above
140/90 mm Hg
40% of cases
Obesity, stress,
genetics
Heart disease, stroke,
kidney damage, vision loss
High
Family history
of disease
Genetic
predisposition to
the disease
10% of cases
Family history
Heart disease, stroke,
kidney damage, blindness
Moderate
15.
DISEASE HISTORYDiscovery
Early research
First treatment
Milestone discoveries
Treatment
Epidemic outbreak
Current research
Future directions
16.
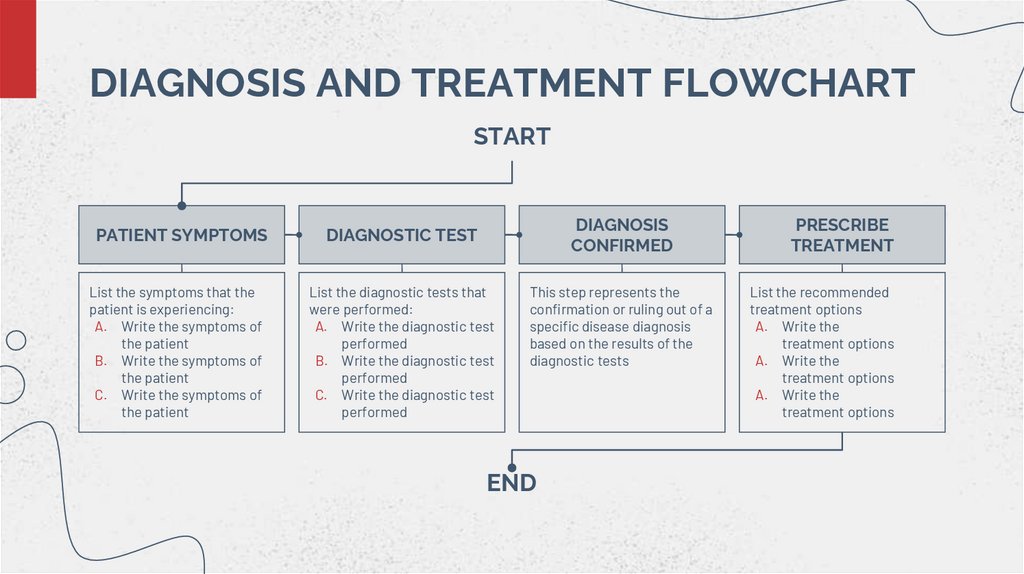
DIAGNOSIS AND TREATMENT FLOWCHARTSTART
DIAGNOSIS
CONFIRMED
PATIENT SYMPTOMS
DIAGNOSTIC TEST
List the symptoms that the
patient is experiencing:
A. Write the symptoms of
the patient
B. Write the symptoms of
the patient
C. Write the symptoms of
the patient
List the diagnostic tests that
were performed:
A. Write the diagnostic test
performed
B. Write the diagnostic test
performed
C. Write the diagnostic test
performed
This step represents the
confirmation or ruling out of a
specific disease diagnosis
based on the results of the
diagnostic tests
END
PRESCRIBE
TREATMENT
List the recommended
treatment options
A. Write the
treatment options
A. Write the
treatment options
A. Write the
treatment options
17.
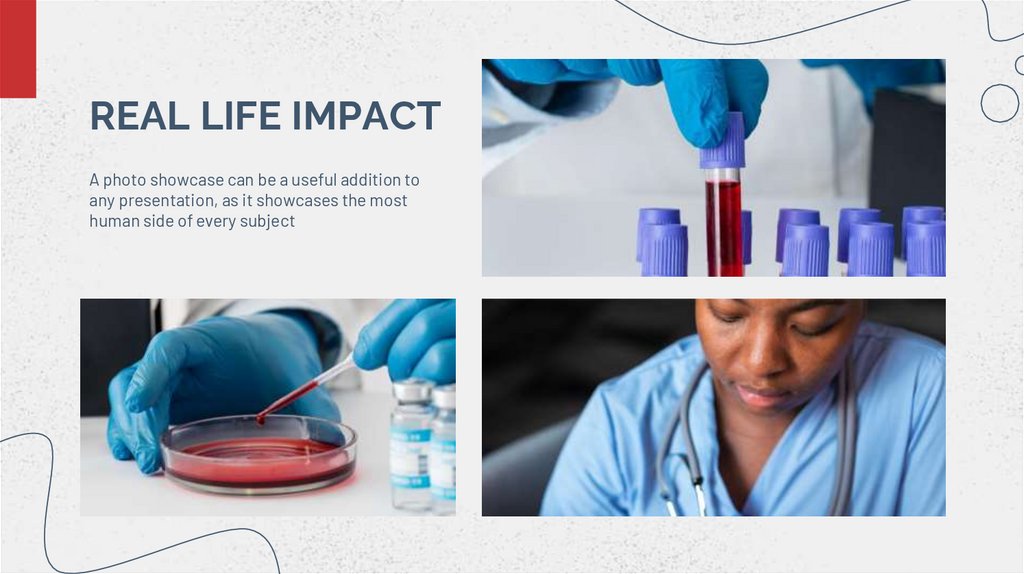
REAL LIFE IMPACTA photo showcase can be a useful addition to
any presentation, as it showcases the most
human side of every subject
18.
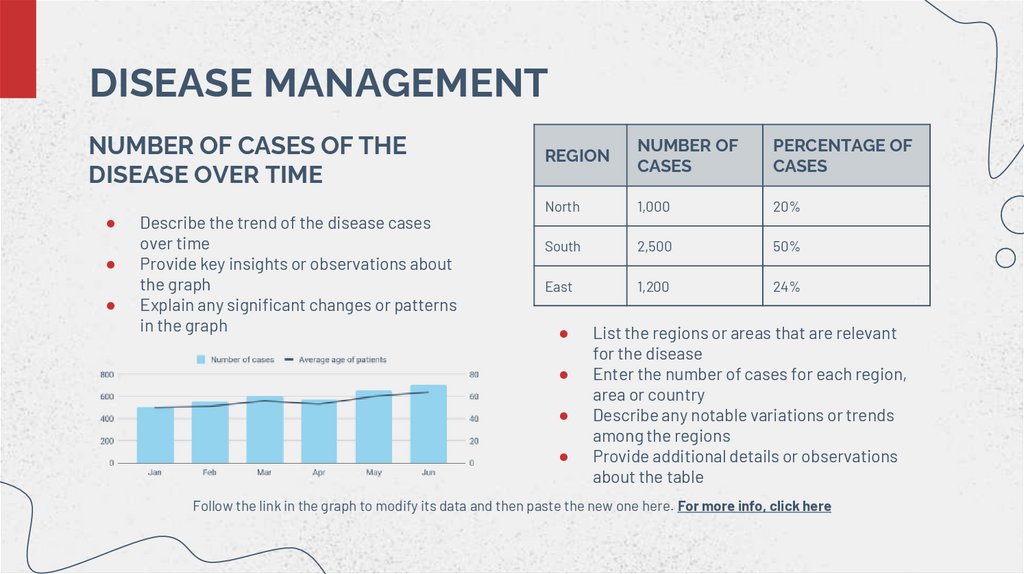
DISEASE MANAGEMENTNUMBER OF CASES OF THE
DISEASE OVER TIME
Describe the trend of the disease cases
over time
Provide key insights or observations about
the graph
Explain any significant changes or patterns
in the graph
REGION
NUMBER OF
CASES
PERCENTAGE OF
CASES
North
1,000
20%
South
2,500
50%
East
1,200
24%
List the regions or areas that are relevant
for the disease
Enter the number of cases for each region,
area or country
Describe any notable variations or trends
among the regions
Provide additional details or observations
about the table
Follow the link in the graph to modify its data and then paste the new one here. For more info, click here
19.
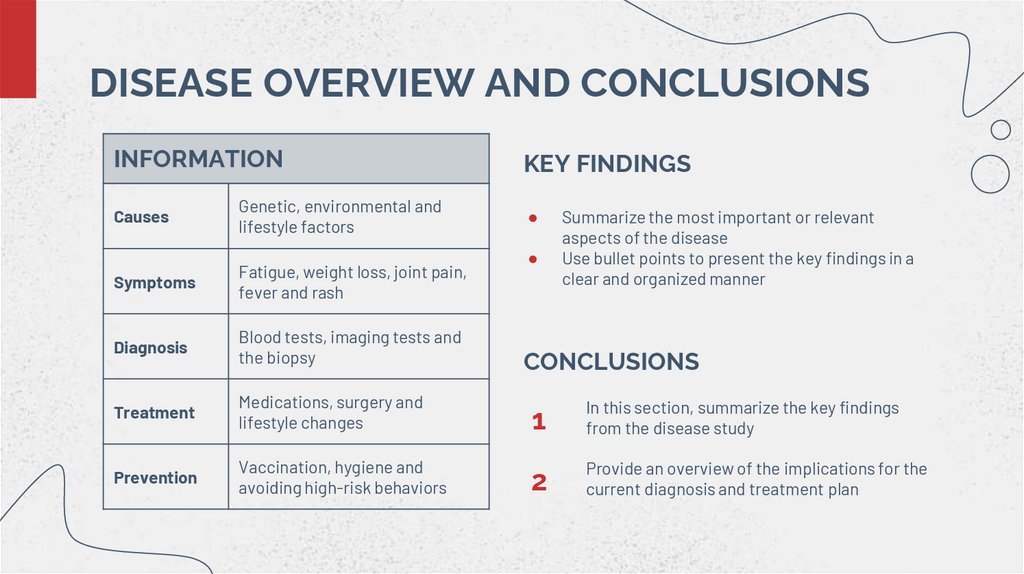
DISEASE OVERVIEW AND CONCLUSIONSINFORMATION
KEY FINDINGS
Causes
Genetic, environmental and
lifestyle factors
Symptoms
Fatigue, weight loss, joint pain,
fever and rash
Diagnosis
Blood tests, imaging tests and
the biopsy
Treatment
Medications, surgery and
lifestyle changes
1
In this section, summarize the key findings
from the disease study
Prevention
Vaccination, hygiene and
avoiding high-risk behaviors
2
Provide an overview of the implications for the
current diagnosis and treatment plan
Summarize the most important or relevant
aspects of the disease
Use bullet points to present the key findings in a
clear and organized manner
CONCLUSIONS
20.
THANKSDo you have any questions?
[email protected]
+91 620 421 838
yourwebsite.com
CREDITS: This presentation template was created by Slidesgo,
including icons by Flaticon and infographics & images by Freepik
Please keep this slide for attribution
21.
ICON PACK22.
ALTERNATIVE RESOURCESHere’s an assortment of alternative resources whose style fits the one of this template:
Digital health icons flat set
23.
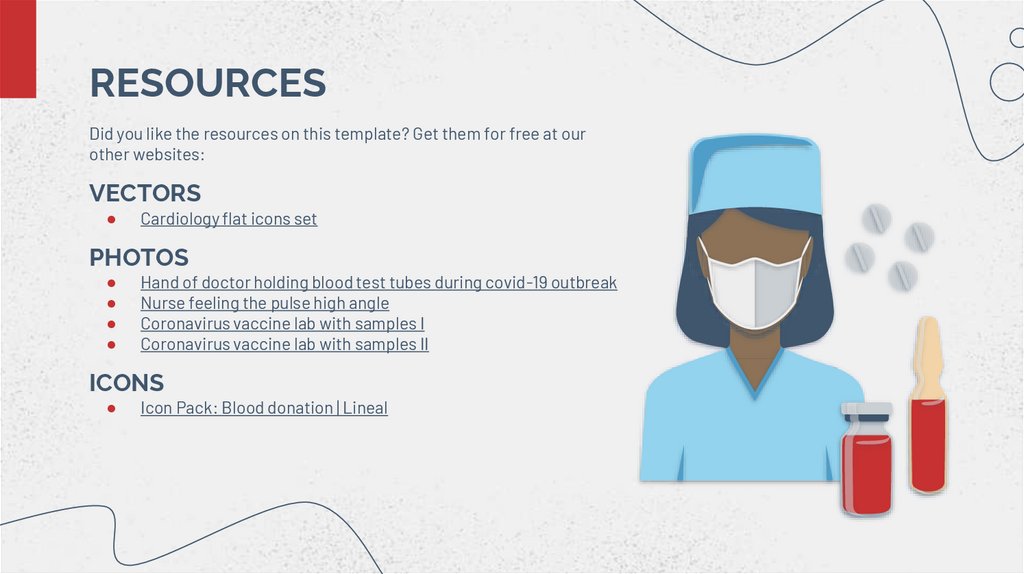
RESOURCESDid you like the resources on this template? Get them for free at our
other websites:
VECTORS
Cardiology flat icons set
PHOTOS
Hand of doctor holding blood test tubes during covid-19 outbreak
Nurse feeling the pulse high angle
Coronavirus vaccine lab with samples I
Coronavirus vaccine lab with samples II
ICONS
Icon Pack: Blood donation | Lineal
24.
Instructions for useIf you have a free account, in order to use this template, you must credit Slidesgo by keeping the Thanks slide. Please
refer to the next slide to read the instructions for premium users.
As a Free user, you are allowed to:
Modify this template.
Use it for both personal and commercial projects.
You are not allowed to:
Sublicense, sell or rent any of Slidesgo Content (or a modified version of Slidesgo Content).
Distribute Slidesgo Content unless it has been expressly authorized by Slidesgo.
Include Slidesgo Content in an online or offline database or file.
Offer Slidesgo templates (or modified versions of Slidesgo templates) for download.
Acquire the copyright of Slidesgo Content.
For more information about editing slides, please read our FAQs or visit our blog:
https://slidesgo.com/faqs and https://slidesgo.com/slidesgo-school
25.
Instructions for use (premium users)As a Premium user, you can use this template without attributing Slidesgo or keeping the "Thanks" slide.
You are allowed to:
Modify this template.
Use it for both personal and commercial purposes.
Hide or delete the “Thanks” slide and the mention to Slidesgo in the credits.
Share this template in an editable format with people who are not part of your team.
You are not allowed to:
Sublicense, sell or rent this Slidesgo Template (or a modified version of this Slidesgo Template).
Distribute this Slidesgo Template (or a modified version of this Slidesgo Template) or include it in a database or in
any other product or service that offers downloadable images, icons or presentations that may be subject to
distribution or resale.
Use any of the elements that are part of this Slidesgo Template in an isolated and separated way from this
Template.
Register any of the elements that are part of this template as a trademark or logo, or register it as a work in an
intellectual property registry or similar.
For more information about editing slides, please read our FAQs or visit our blog:
https://slidesgo.com/faqs and https://slidesgo.com/slidesgo-school
26.
Fonts & colors usedThis presentation has been made using the following fonts:
Raleway
(https://fonts.google.com/specimen/Raleway)
Barlow
(https://fonts.google.com/specimen/Barlow)
#40566d
#c73131
#f3d4a8
#ededed
#4f9ec9
#cacfd3
#93d3ee
27.
StorysetCreate your Story with our illustrated concepts. Choose the style you like the most, edit its colors, pick the background
and layers you want to show and bring them to life with the animator panel! It will boost your presentation. Check out how
it works.
Pana
Amico
Bro
Rafiki
Cuate
28.
Use our editable graphic resources...You can easily resize these resources without losing quality. To change the color, just ungroup the resource and click
on the object you want to change. Then, click on the paint bucket and select the color you want. Group the resource again
when you’re done. You can also look for more infographics on Slidesgo.
29.
30.
31.
JANUARYFEBRUARY
MARCH
APRIL
MAY
JUNE
PHASE 1
Task 1
Task 2
PHASE 2
Task 1
Task 2
JANUARY
PHASE 1
Task 1
Task 2
FEBRUARY
MARCH
APRIL
32.
33.
34.
...and our sets of editable iconsYou can resize these icons without losing quality.
You can change the stroke and fill color; just select the icon and click on the paint bucket/pen.
In Google Slides, you can also use Flaticon’s extension, allowing you to customize and add even more icons.
35.
Educational IconsMedical Icons
36.
Business IconsTeamwork Icons
37.
Help & Support IconsAvatar Icons
38.
Creative Process IconsPerforming Arts Icons