
 english
Similar presentations:


Produce report
1.
Sales reportView in Power BI
2.
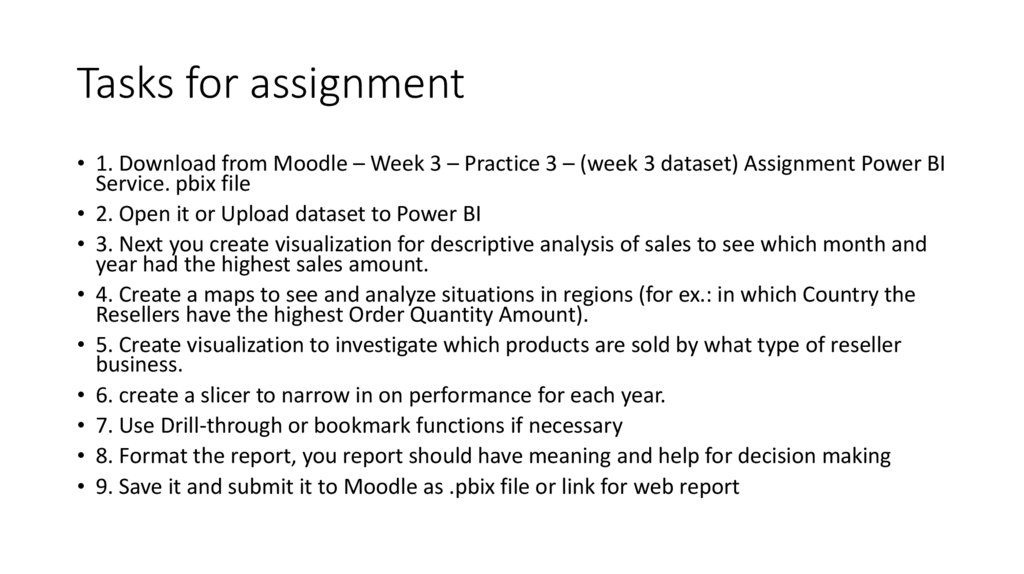
Tasks for assignment• 1. Download from Moodle – Week 3 – Practice 3 – (week 3 dataset) Assignment Power BI
Service. pbix file
• 2. Open it or Upload dataset to Power BI
• 3. Next you create visualization for descriptive analysis of sales to see which month and
year had the highest sales amount.
• 4. Create a maps to see and analyze situations in regions (for ex.: in which Country the
Resellers have the highest Order Quantity Amount).
• 5. Create visualization to investigate which products are sold by what type of reseller
business.
• 6. create a slicer to narrow in on performance for each year.
• 7. Use Drill-through or bookmark functions if necessary
• 8. Format the report, you report should have meaning and help for decision making
• 9. Save it and submit it to Moodle as .pbix file or link for web report