


")


")
")


")
 - Remote Services Summary")


 internet
 electronics
Similar presentations:


")


Remote monitoring. Cost savings
1. Remote monitoring Cost savings
Božidar Kobeščak[email protected]
1
2. Why Remote Monitoring?
Cost savings by reducing manual maintenanceIncreased reliability (preventive maintenance, system checks)
Eliminate unnecessary trips to site at fault and maintenance
situations
Faster failure location
365/24 supervision
On-site spare parts inventory reduced
2
3.
REMOTE MONITORINGNetwork/Site
Management
Center
Web
Browser or
SNMP
ENEC
MODEM
PSTN,GSM
TCP/IP
Transmission
Network
MODEM
RS485 YDN23
DC Power System
ACU
SM BAT
Site
CAN
…
Rect.1 Rect.2
Rect.48
3
SM IO
SM AC
4.
Monitoring– ACU and SM-ACAC mains supervision:
Voltage
Current
Power
Active power
Reactive power
Apparent power
Power factor
Energy
Frequency
THD
Typical
application:
AC Mains
Standby Diesel supervision:
Generator remote control
Remote measurement and detection of
generator status
Real time data/alarm
Generator tests
Standby Diesel
4
5. Monitoring - Supervision Modules
SM-BATMeasure currents, voltages,
temperatures & auxiliary
1-4 batteries per module
2-12V blocks
SM-IO
SM AC
Supports dry contacts,
active signals, transducers
AC mains and diesel
supervision
7 configurable
analogue/digital inputs
-48/+24V batteries
1 AC frequency
Voltages, powers, currents,
THD, PF, energy
consumption and more.
Max 4 modules in a system
5 configurable analogue
inputs
Max 1 module in a system
Max 8 modules in a system
5
6.
DPUStand alone Controller. Processes data from intelligent equipment and
sensors.
19 Inch 1U
2 Slots for option cards
Power
18~60V DC
4-channel DO
10-channel AI &
4-channel, DI
4 serial ports can be configured as
232/422/485 for intelligent device
monitoring
1 Ethernet Port
1 USB Master
Non-intelligent
Environment
sensors
device
6
DC power
Air conditioner
UPS
7.
NetSure - Controller, ACU• Battery management
• Alarm handling and alarm history logs (400 alarms)
• 8 alarm relays output
• Multi-language display
• Web and SNMP
• Advanced events logs
• Advanced PLC functions
• Energy savings function
• Power split function
• Advanced monitoring solution through SM modules
7
8.
NetSure – ACU: Power SplitPower Split:
= Smart software function for Extension of DC power systems and batteries
Easy live interconnection between existing DC Power system and new NetSure 501 system
Allows extension of Emerson and Non-Emerson DC power systems
Power
Output (W)
Low
load
P2
Normal
operation
High Over
load load
SSPL= Slave System Power Limit
50%~90% Slave system capacity
=Slave system output
=Master system output
P1
SSPL
P1=Max. slave system output
P2=Max. slave + master output
Load
(%)
Voltage
(V)
+ △U
U
-△U
=0% to SSPL%, Slave system
=0% to 100%, Master system
8
Load
(%)
=SSPL% to 100%, Slave system
=Power from batteries
9. Fix problems faster with advance alarm identification (reliability)
Alarm levelCritical
Overvoltage
Aditional information
Battery voltage
Voltage value
Remaining battery capacity
Parameters configuration
Urgent
Undervoltage
Rectifier failure
Voltage value
Extra rectifiers capacity
Observation
AC Mains failure
High temperature
AC Mains failure log
Temperature log
Traditional
Alarm description
Battery disconnected
Critical undervoltage
Other services providers
EMERSON
Better quality of information for better decisions
9
10. ENEC Enterprise: Site visualization
10Lower capital invest & maintenance cost & higher uptime
11. Diagnose problems remotely
--
Reduce on-site travel with advance alarm identification ( Send person
with appropriate knowledge and the adequate spare parts) 30-60% of
visits
Problem traceability
Alarm analysis
Utilize your service resources more effectively
11
12. Alarm Report (reliability)
1213. Get proactive real-time fault notification (reliability)
1314. Remote Battery testing-OPEX reduction
Battery Maintenance- Information about real back-up time comparing with
calculated one
On site, off line discharge test
– Up to 50% of the battery at a time
On site, internal resistance test
– Correlation with battery health
Remote discharge test
– Uses the active load
14
15.
Monitoring – ACU: Battery testingBattery testing
= checking the battery backup capacity
Battery testing modes:
Short time test
Time test
Stable current test
Manual battery test
Cyclic (programmable and remote) battery test
15
16. REMOTE BATTERY TEST -savings
Cost saving based on:• working hours
• traveling cost reduction
• cars investment
• energy consumption
Cost saving example (working hours only)
2 persons, 8 hours for battery string
Tehnicians working and traveling hours total =20h
1hour cost =20$
1 battery string = 20h x 20$ or 400$ (labour cost only)
2000 sites x 2 battery strings =4.000x400 or 1,6 mil$
cars, fuel, equipment, energy consumption are extra cost
16
17. Cost savings
Božidar Kobeščak[email protected]
17
18. Energy & Telecommunications
Energy & TelecommunicationsConsumer demand pushing growth of broadband and wireless networks
worldwide
The OPEX part of the total cost of ownership is becoming increasingly
important along with CAPEX
To meet the demands of growing telecom energy consumption and
skyrocketing energy costs, even the best power-system solutions must
continue to evolve.
18
19. Energy & Telecommunications
Energy & TelecommunicationsTelecom systems account for 1% of worldwide electricity (and 3% in the U.S.)
15% of operational expenditures are power-related
(source: Telecommunications Industry Association)
Compare carbon footprint to the CO2 emissions of 29 million cars
19
20. eSure Technology Ultra efficient rectifier: Approaching 97%
Best-in-class sustained efficiency throughout a wide range of operatingconditions
Efficiencies approaching 97% starting at 30% load through to 70% load
Lower total cost of ownership (TCO)
20
21. Energy Savings Case study: eSure vs standard efficiency
Scenario:At list price, a customer chooses to buy 1000 x 3200W eSure rectifiers vs
standard efficiency (SE) rectifiers
At 60% load, the efficiency of the eSure is 96.7% compared to 92% for SE
rectifiers
Assumptions:
Energy cost is $0.1 per KWh
Rectifiers run at 60% load
Air Condition unit has EER rating of 10 and runs at 8 hours per day
0.60kg CO2 emission per KWh consumed
Challenge:
What is the energy cost of ownership over a 10 year useful life of an eSure
rectifier vs. a standard efficiency rectifier?
21
22.
Cost BenefitCase study: eSure vs standard efficiency
Energy loss cost for 1000 standard efficiency rectifiers @ 92% efficiency
Year
1
2
3
4
5
6
7
8
9
10
AC energy loss
166MW
166MW
166MW
166MW
166MW
166MW
166MW
166MW
166MW
166MW
SE Rect energy loss
1463MW
1463MW
1463MW
1463MW
1463MW
1463MW
1463MW
1463MW
1463MW
1463MW
Total energy loss
1629MW
1629MW
1629MW
1629MW
1629MW
1629MW
1629MW
1629MW
1629MW
1629MW
CO2 emission
977Mg
977Mg
977Mg
977Mg
977Mg
977Mg
977Mg
977Mg
977Mg
977Mg
Annual cost of energy
loss
Grand Total:
$162 900 $162 900 $162 900 $162 900 $162 900 $162 900 $162 900 $162 900 $162 900 $162 900
$1 629 000
9770 metric tons CO2
Energy loss cost for 1000 eSure rectifiers @ 96.5% efficiency
Year
1
2
3
4
5
6
7
8
9
10
AC energy loss
69MW
69MW
69MW
69MW
69MW
69MW
69MW
69MW
69MW
69MW
eSure energy loss
610MW
610MW
610MW
610MW
610MW
610MW
610MW
610MW
610MW
610MW
Total energy loss
679MW
679MW
679MW
679MW
679MW
679MW
679MW
679MW
679MW
679MW
78%
CO2 emission
407Mg
407Mg
407Mg
407Mg
407Mg
407Mg
407Mg
407Mg
407Mg
407Mg
Annual cost of energy
loss
ROI on eSure
premium
$67 900
$67 900
$67 900
$67 900
$67 900
$67 900
$67 900
$67 900
$67 900
$67 900
Grand Total:
$679 000
4070 metric tons CO2
Energy loss reduced by 58% with22eSure vs. standard product lines!
1.26
year payback
23. eSure – Annual savings per 8 kW site
25% load0 R48-2000
1 R48-2000e
Input
Rectifier
kW
Efficiency
2,2
90,6%
2,1
95,7%
Load
kW
50% load
0 R48-2000
1 R48-2000e
Input
Rectifier
kW
Efficiency
4,3
92,3%
4,1
96,5%
Load
kW
75% load
0 R48-2000
1 R48-2000e
Input
Rectifier
kW
Efficiency
6,5
92,1%
6,3
96,0%
Load
kW
100% load
0 R48-2000
1 R48-2000e
Input
Rectifier
kW
Efficiency
8,8
91,2%
8,4
95,4%
Load
kW
1)
$
182 €
79 €
Savings
per Year
2
2
Watt
208
90
4
4
Losses
Savings
1)
per Year
Watt
$
334
292 €
145
127 €
165 €
6
6
Losses
Savings
1)
per Year
Watt
$
515
451 €
250
219 €
232 €
8
8
Losses
Savings
1)
per
Year
Watt
$
772
676 €
386
338 €
338 €
1)
23
103 €
@ 0,10€/kWh
24. Efficiency Cost Impact Case study: eSure vs standard efficiency
2425.
Energy savingsSaving money by changing Energy Consumption Behaviour
Increasing individual rectifier efficiency and lifetime
By allowing the system to switch off rectifiers that are not needed
to maintain a fixed redundancy level compared to the actual consumption
Useful for sites with great variances in load
ON
ON
ON
ON
ON
20%
20%
20%
20%
20%
OFF
OFF
OFF
ON
ON
0%
0%
0%
50%
50%
ON
ON
OFF
OFF
OFF
50%
50%
0%
0%
0%
Normal Power System Setup
25
Periodical Cycling Setup
26.
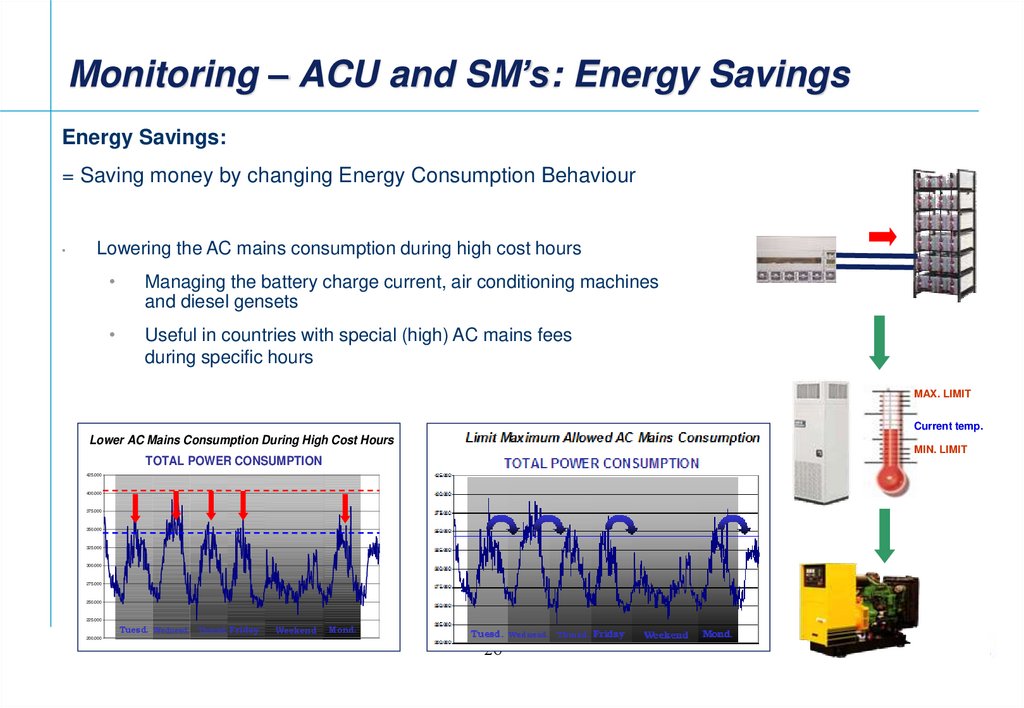
Monitoring – ACU and SM’s: Energy SavingsEnergy Savings:
= Saving money by changing Energy Consumption Behaviour
Lowering the AC mains consumption during high cost hours
Managing the battery charge current, air conditioning machines
and diesel gensets
Useful in countries with special (high) AC mains fees
during specific hours
MAX. LIMIT
Current temp.
Lower AC Mains Consumption During High Cost Hours
MIN. LIMIT
TOTAL POWER CONSUMPTION
425.000
400.000
375.000
350.000
325.000
300.000
275.000
250.000
225.000
Tuesd. Wednesd. Thursd. Friday
200.000
Weekend
Mond.
26
27. Network reliability improvement
-Minimize downtime
-
Fix problems faster with advance alarm
identification
-
Get proactive real-time fault notification
27
28. Minimize downtime (reliability)
-Reduce downtime and service loss between 20-45%
Matching information between:
-
Mains failure by site (Example: 95% < 15 min of duration)
Battery status (Example: 8 minutes of battery backup)
Replacing the worst batteries
Test Baterias
50
25.5
25
1000
900
800
700
600
500
400
300
200
100
0
0
+
Mains failure
24.5
24
-50
23.5
23
-100
22.5
22
-150
21.5
Time
15 Min
60 min
120 min
>120 min
28
10:36:50
10:34:07
10:31:23
10:28:40
10:25:56
10:23:12
10:20:28
10:17:45
10:14:53
10:12:09
10:09:12
10:06:28
10:03:45
10:01:01
09:58:18
09:55:10
09:52:27
09:49:44
09:46:31
21
09:43:39
-200
Current
Voltage
29. Remote Monitoring & Services - Case (RBS) - Remote Services Summary
Remote Monitoring & Services - Case (RBS) Remote Services SummaryA pilot study with a large European operator showed that remote services:
Reduced the sites visits by 60%
Reduced the “time to repair” by 65%
180
160
45
140
120
100
80
60
31
24
25
-60%
49
7
19
24
40
20
45
19
45
14
0
Failures
Current site visits
Site visits with RS
29
No AC mains
Open breaker
Multiple visits
First visit correction
30. SITE VISIT -savings
Cost saving based on:• working hours
• traveling cost reduction
• cars investment
Cost saving example (working hours only)
1 person, 4 hours for site visit
Tehnicians working and traveling hours total =4h
1hour cost =20$
1 site visit per year = 4h x 20$ or 80$ (labour cost only)
2000 sites visits =2.000x80 or 160.000 €/year
cars, fuel, equipment, are extra cost
30
31. Maximize equipment performance and energy savings
Number sites Vs % load30
100%
25
90%
80%
20
10
Efficiency
+
15
70%
60%
50%
40%
30%
5
20%
10%
0
0%
10%
30%
50%
70%
90%
>100%
10%
25%
50%
80%
100%
Load
In some customers it’s possible between a 4,5% and a 5,5% of
energy savings dimensioning correctly
31
32. Reliability Savings Case study: NetSure vs standard reliability
Scenario:Customer buys 1000 rectifiers per year at list price
Expected MTBF of this product is 50 years (436800 hours)
Annual failure rate is the inverse of the MTBF, or 1/50= 2% per year
Assumptions:
One site visit will occur with every 2 rectifier failures
Each site visit costs $240 ($80/hour, 1.5 hour round trip, 1.5 hour onsite repair
and verification)
Full list price of replacement rectifier is incurred for each failure
Standard one year warranty on rectifiers
Challenge:
What is the cost of ownership over 10 year useful life of the rectifier?
32
33.
Cost BenefitCase study: NetSure vs standard reliability
Cost of ownership @ 50* year MTBF
Year
1
2
3
4
5
6
7
8
9
10
Field Pop
1,000
2,000
3,000
4,000
5,000
6,000
7,000
8,000
9,000
10,000
Failures
20
40
60
80
100
120
140
160
180
200
Tech Costs ($240 per 2 fail)
$2,400
$4,800
$7,200
$9,600
$12,000
$14,400
$16,800
$19,200
$21,600
$24,000
Replacement Cost ($500)
$0
$10,000
$20,000
$30,000
$40,000
$50,000
$60,000
$70,000
$80,000
$90,000
$2,400
$14,800
$27,200
$39,600
$52,000
$64,400
$76,800
$89,200 $101,600 $114,000
Annual Total
Grand Total:
$582,000
*50 year MTBF is typical for Emerson legacy products
Cost of ownership @ 200* year MTBF
Year
1
2
3
4
5
6
7
8
9
10
Field Pop
1,000
2,000
3,000
4,000
5,000
6,000
7,000
8,000
9,000
10,000
Failures
5
10
15
20
25
30
35
40
45
50
Tech Costs ($240 per 2 fail)
$600
$1,200
$1,800
$2,400
$3,000
$3,600
$4,200
$4,800
$5,400
$6,000
Replacement Cost ($500)
$0
$2,500
$5,000
$7,500
$10,000
$12,500
$15,000
$17,500
$20,000
$22,500
Annual Total
$600
$3,700
$6,800
$9,900
$13,000
$16,100
$19,200
$22,300
$25,400
$28,500
Grand Total:
$145,500
*200 year MTBF is typical for Emerson NetSure products
75% cost reduction with NetSure
vs. standard product lines!
33
34. MTBF Cost Impact Case study: NetSure vs standard reliability
3435. Remote Monitoring & Services - Remote Services Summary
Remote Monitoring & Services - RemoteServices Summary
Remote Services will result with:
Increased Network availability
– Early warnings
– Bad batteries identification improvement
– Quicker failure resolutions
Lower OPEX
– Reduced number of site visits
– Reduced maintenance cost
– Improved field force efficiency
– Energy savings
Asset Optimization
– Better utilization of existing equipment
Reduces CO2 foot print by less site visits and energy savings
35
36. Conclusions:
Corrective & Preventive:30-65%
Energy reduction:
4,5-5,5%
Plant reengineering:
Dimensioning rectifiers and batteries
20-30%
36
37.
Service CapabilitiesGlobal Knowledge, Local Expertise
37