

 sociology
Similar presentations:


")


")

Ecological characteristics of population of Europe
1.
2.
Population DensityPopulation density (in agriculture : standing stock and standing
crop) is a measurement of population per unit area or unit
volume; it is a quantity of type number density. It is frequently
applied to living organisms, and particularly to humans. It is a key
geographic term.
3.
Population Density of
Europe
The current population of Europe is
747,608,577
• The total land area is 22,134,900
Km2 (8,546,329 sq. miles)
• The population density in Europe is
34 per Km2 (87 people per mi2).
4.
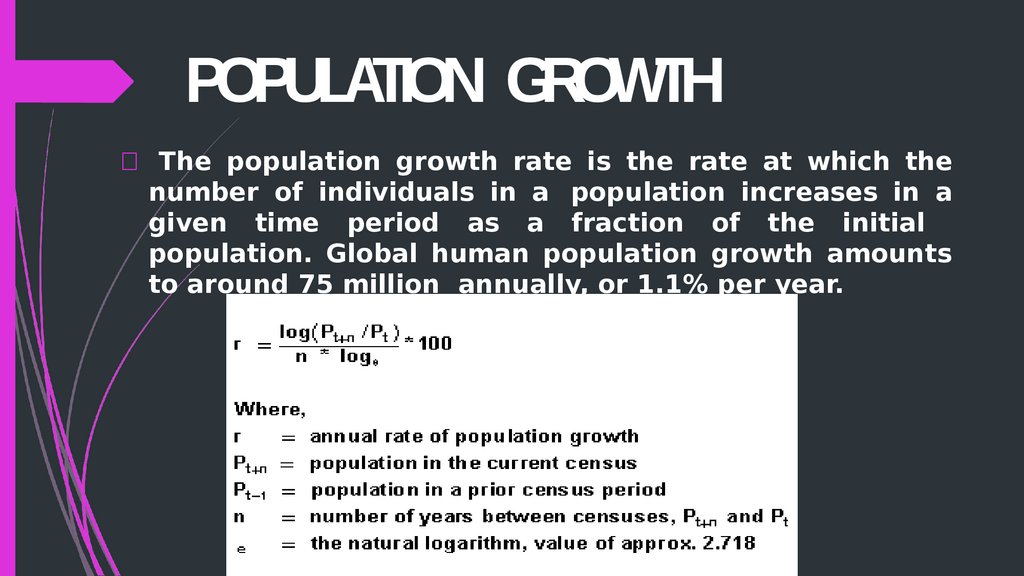
POPULATION GROWTHThe population growth rate is the rate at which the
number of individuals in a population increases in a
given time period as a fraction of the initial
population. Global human population growth amounts
to around 75 million annually, or 1.1% per year.
5.
POPULATION GROWTHOFEUROPEIts population is estimated at 738 million, which accounts
for 11% of the world's population.
The continent is currently growing at a rate of
0.3%.
Europe has been in a decline for some time and its
population is aging rapidly in most countries.
6.
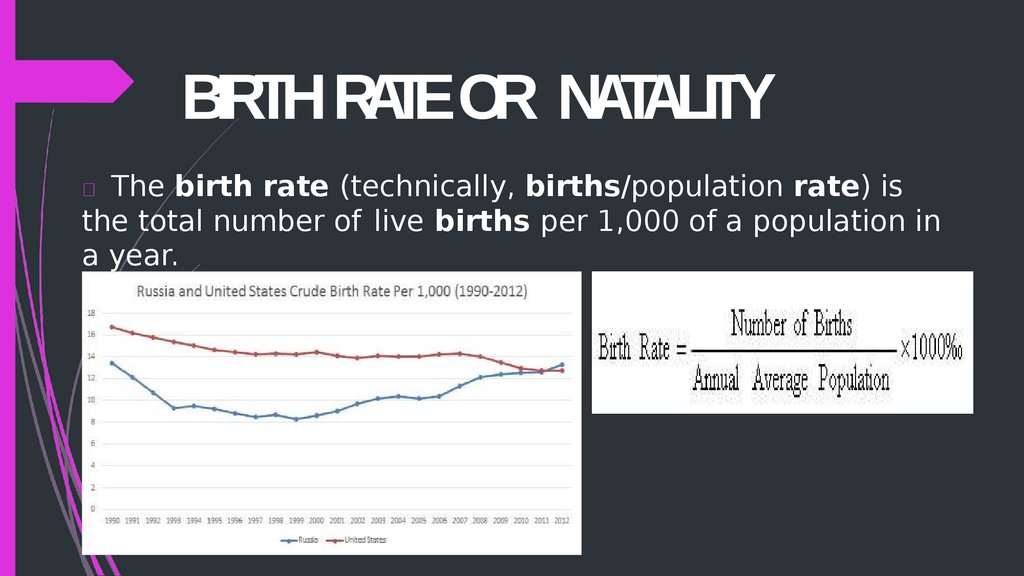
BIRTH RATE OR NATALITYThe birth rate (technically, births/population rate) is
the total number of live births per 1,000 of a population in
a year.
7.
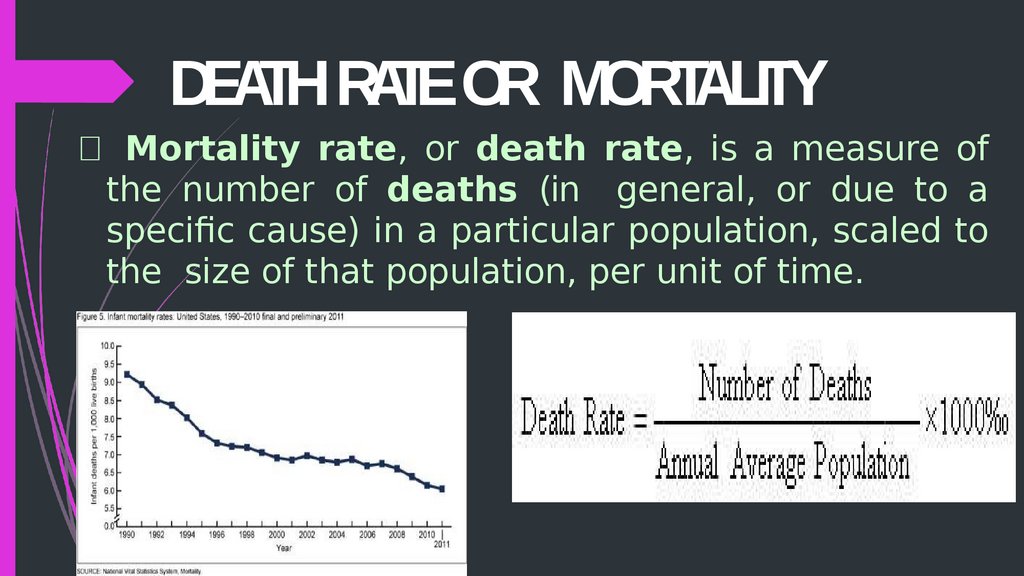
DEATH RATE OR MORTALITYMortality rate, or death rate, is a measure of
the number of deaths (in general, or due to a
specific cause) in a particular population, scaled to
the size of that population, per unit of time.
8.
Life Expectancy in EuropeBOTH SEXES
79.1 years
• (life expectancy at birth, both sexes combined)
• FEMALES
• 82.3 years
• (life expectancy at birth, females)
• MALES
• 75.9 years
• (life expectancy at birth, males)
9.
Infant Mortality Rate and Deathsof Children under 5 Years Old in
Europe
INFANT MORTALITY :
3.4
• (infant deaths per 1,000 live births)
• DEATHS UNDER AGE 5 :
• 4.2
• (per 1,000 live births)
10.
GENDER RATIOThe gender ratio is the ratio of males to females in a
population. In the majority of species, this is 1:1, the
reasons for which are described in Fisher's principle.
Some eusocial wasps, such as the Polistes fuscatus and
the Polistes exclamans, seem to defy this ratio at times.
11.
Fertility in Europe• Total Fertility Rate (TFR) of 2.1 represents the
Replacement-Level Fertility: the average number
of children per woman needed for each
generation to exactly replace itself without
needing international immigration.
• A value below 2.1 will cause the native
population to decline
12.
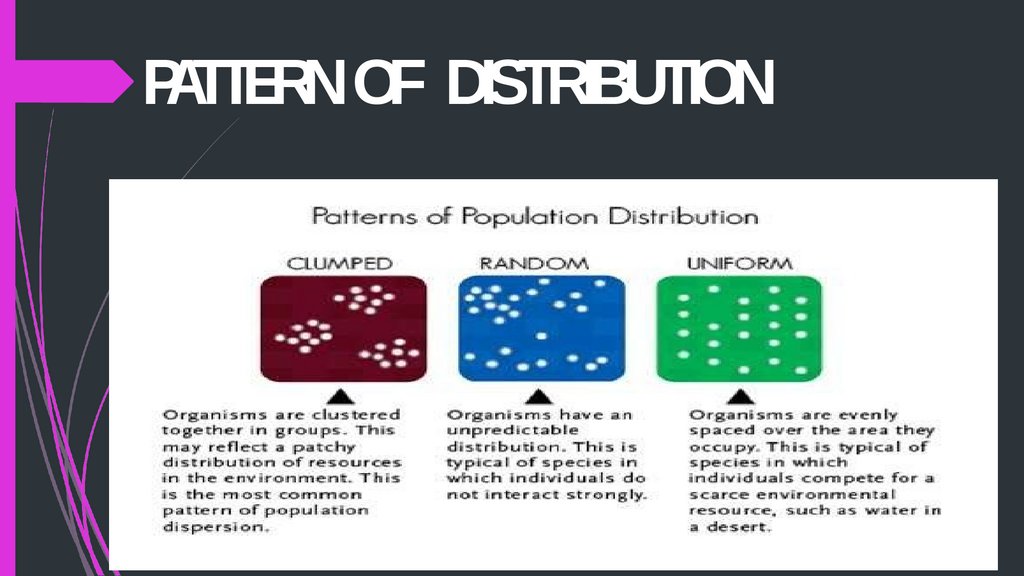
PATTERN OF DISTRIBUTION13.
AGE DISTRIBUTIONThere are three types of age
distribution methods:
Pyramid Shaped
Bell Shaped
Urn Shaped
14.
Pyramid shapedPyramid Shaped Age Distribution of Population of China and India
15.
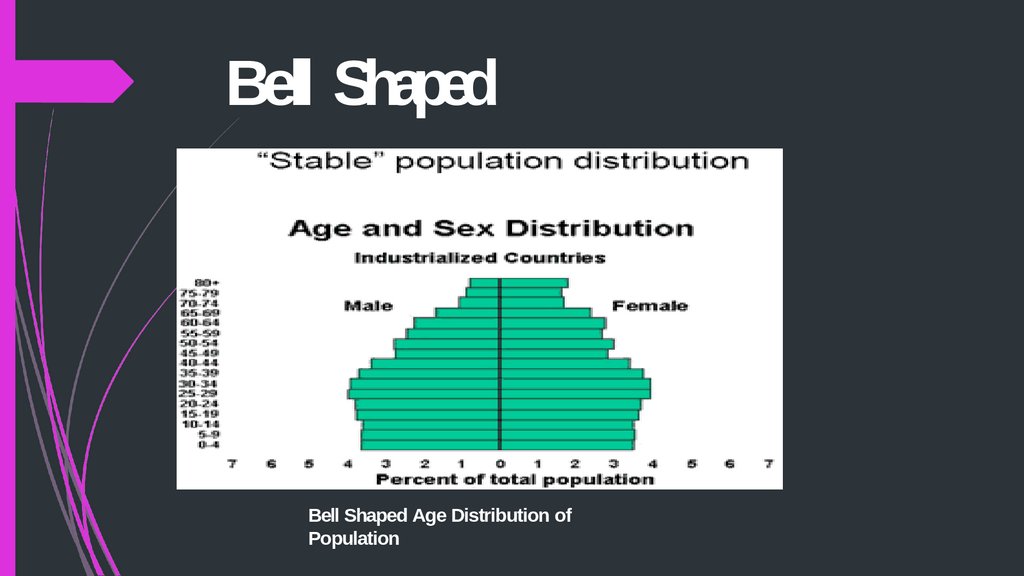
Bell ShapedBell Shaped Age Distribution of
Population
16.
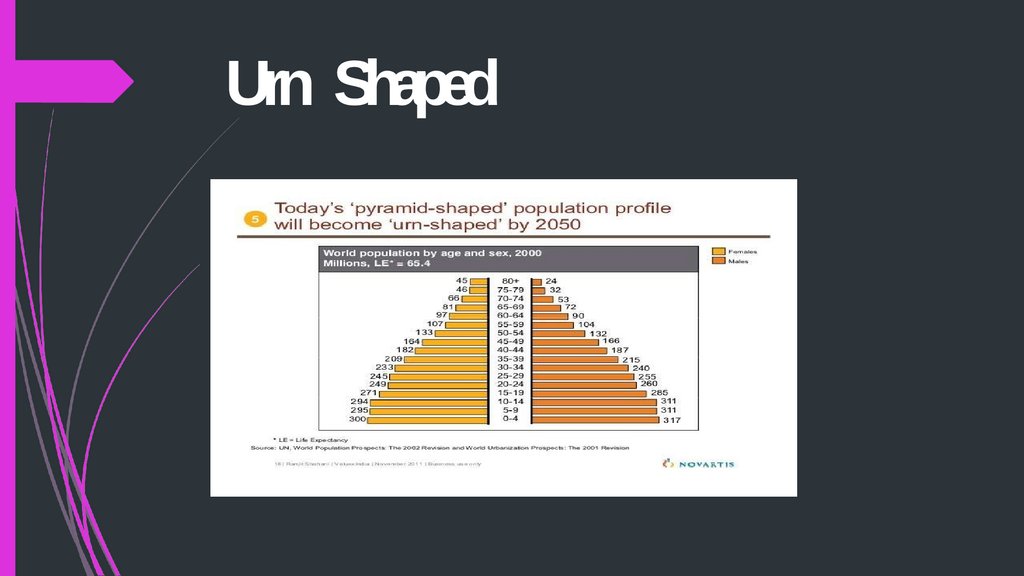
Urn Shaped17.
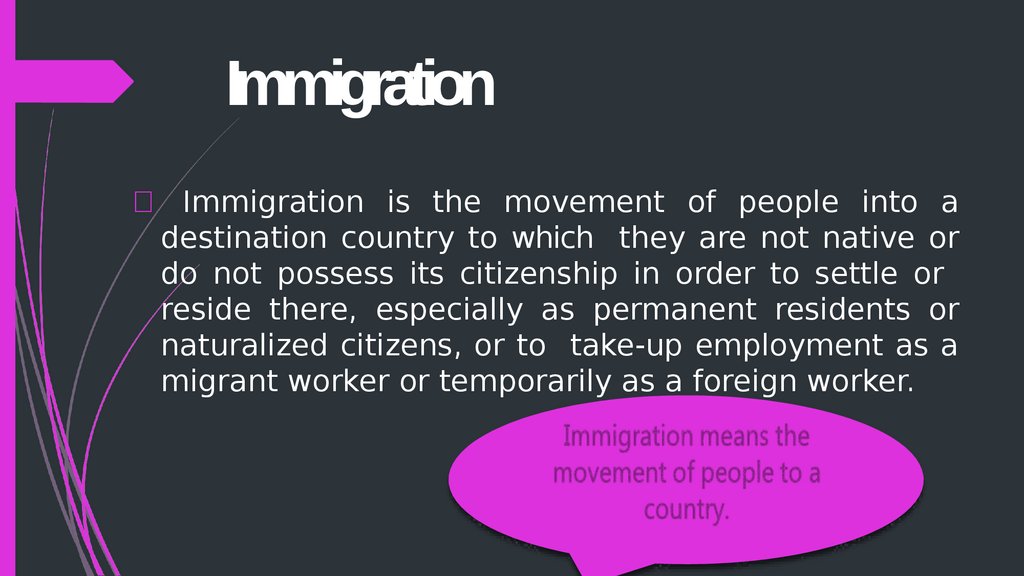
ImmigrationImmigration is the movement of people into a
destination country to which they are not native or
do not possess its citizenship in order to settle or
reside there, especially as permanent residents or
naturalized citizens, or to take-up employment as a
migrant worker or temporarily as a foreign worker.
18.
EmigrationEmigration is the act of leaving one's native
country with the intent to settle elsewhere.
Conversely,
immigration
describes
the
movement of persons into one country from
another. Both are acts of migration across
national boundaries.
19.
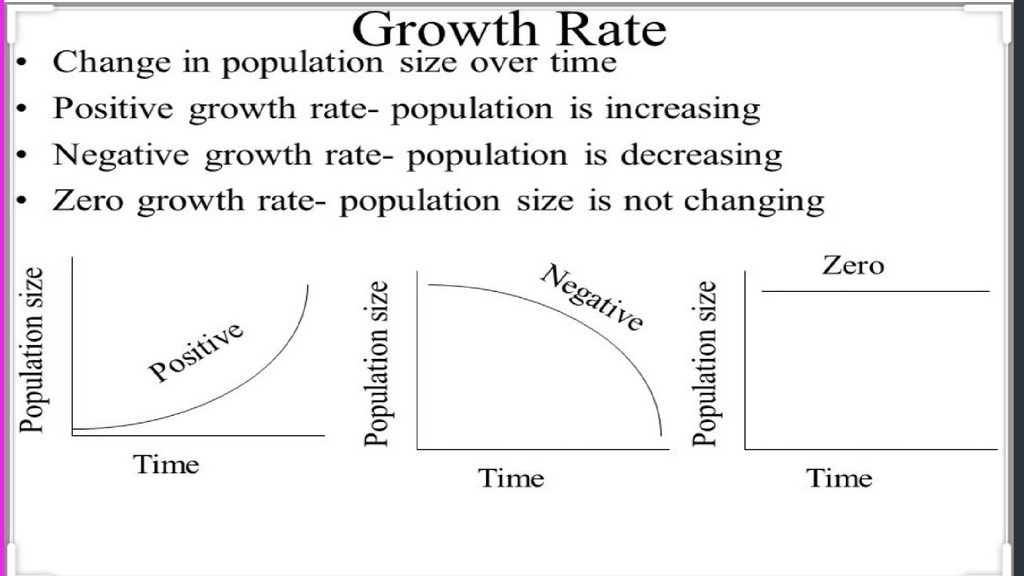
Positive/Negative Growth Rate• A Positive growth rate indicates that the population
is increasing
• Negative growth rate indicates that the population
is decreasing.
20.
Zero Growth• Z ero population growth, sometimes abbreviated ZPG
(also called the replacement level of fertility), is a
condition of demographic balance where the number
of people in a specified population neither grows nor
declines, considered as a social aim by some.
• According to some, zero population growth is the
ideal towards which countries and the whole world
should aspire in the interests of accomplishing longterm environmental sustainability.
• What it means by ‘the number of people neither
grows nor declines’ is that births plus in-migrants
21.
22.
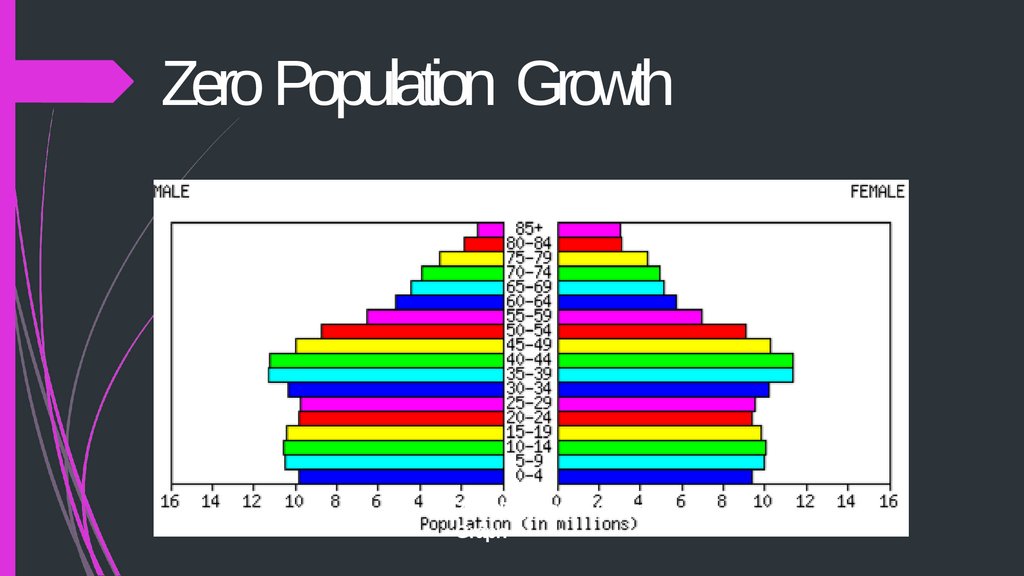
Zero Population GrowthZero Population Growth
Graph
23.
THA
YO N
K
U