
 database
Similar presentations:
")


Chapter 5: Statistics
1.
Pure MathFPMP0003
Semester 1 AY 2021-22
GROUP – 4
Dr. Devendra Kumar
2.
Chapter 5: StatisticsLearning outcomes covered:
Understand basic concepts of
descriptive statistics, mean,
median, mode and summarize
data into tables and simple graphs
(bar charts,histogram, and pie
chart).
Learning Objectives
• understand the basic concepts of
descriptive statistics.
• compute the basic measures of
central tendency.
• summarize a given data in to tables
and graphs.
3.
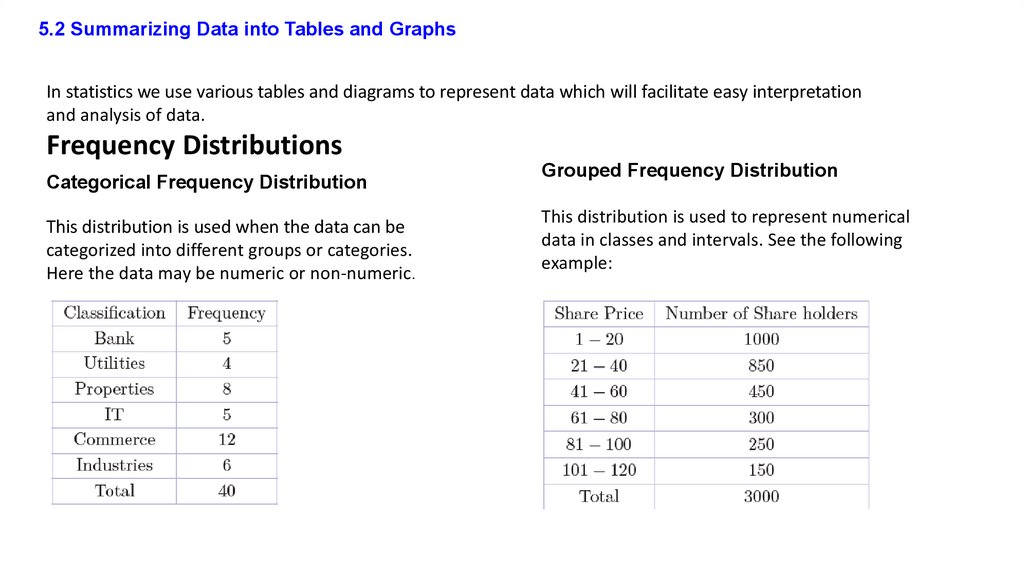
5.2 Summarizing Data into Tables and GraphsIn statistics we use various tables and diagrams to represent data which will facilitate easy interpretation
and analysis of data.
Frequency Distributions
Categorical Frequency Distribution
This distribution is used when the data can be
categorized into different groups or categories.
Here the data may be numeric or non-numeric.
Grouped Frequency Distribution
This distribution is used to represent numerical
data in classes and intervals. See the following
example:
4.
Constructing a grouped frequency distributionStep 1. Form the classes/class intervals. Pick out the highest and the lowest values and find the range of the data.
Determine the class intervals. Number of intervals should be between 5 and 12 and they usually have equal widths.
Ensure that each item of the data will be included in a unique class.
Step 2. Tally the values in the data set into the classes formed.
Step 3. Find the frequency of each class by totaling the tallies.
5.
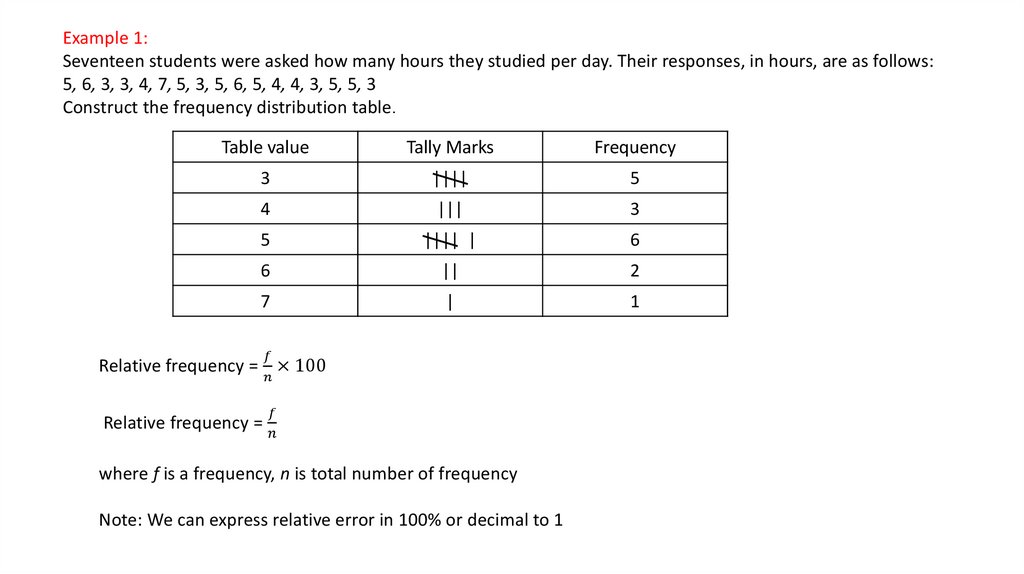
Example 1:Seventeen students were asked how many hours they studied per day. Their responses, in hours, are as follows:
5, 6, 3, 3, 4, 7, 5, 3, 5, 6, 5, 4, 4, 3, 5, 5, 3
Construct the frequency distribution table.
Table value
Tally Marks
Frequency
3
||||
5
4
|||
3
5
|||| |
6
6
||
2
7
|
1