")


")


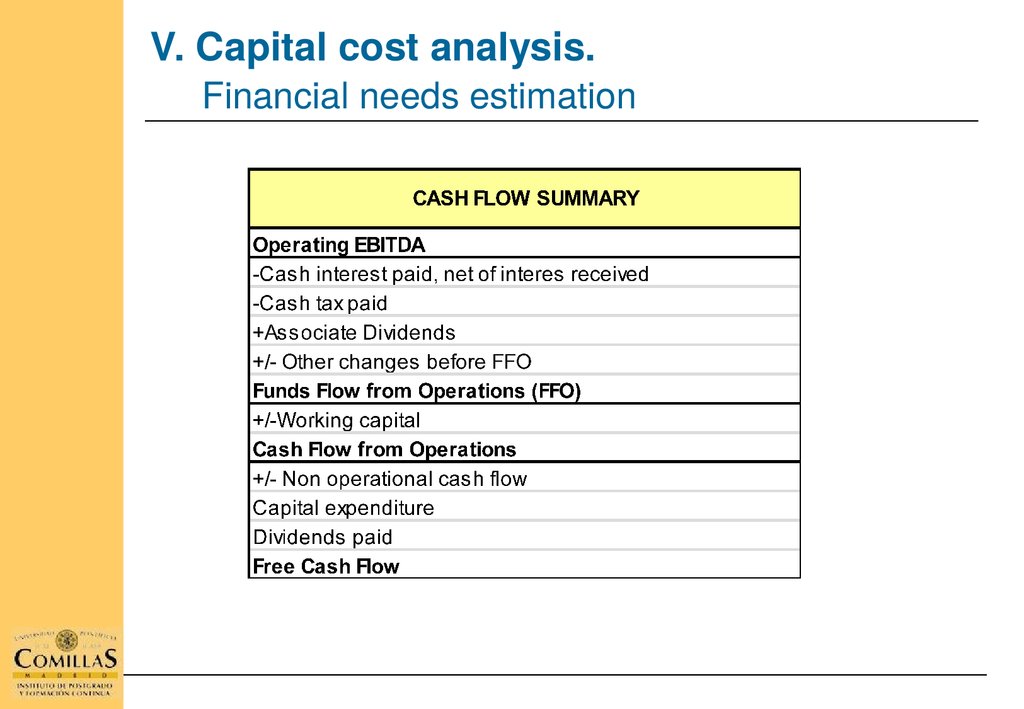


 economics
 finance
 management
Similar presentations:


")


Economics and management of network. Industries
1. Erasmus Mundus Joint Master in Economics and Management of Network Industries (2015-2016)
Erasmus Mundus Joint Master inEconomics and Management of Network
Industries (20152016)
FINANCIAL ANALYSIS OF THE ELECTRIC POWER INDUSTRY
COST AND RETURN ANALYSIS
Ignacio Martínez
[email protected]
2. FINANCIAL ANALYSIS OF THE ELECTRICITY INDUSTRY. Contents
FINANCIAL ANALYSIS OF THE ELECTRICITYINDUSTRY. Contents
I. Cost structure of the Electricity Business.
II. Capital Cost Analysis.
III. Economic and Financial Analysis. Ratios.
– Economic and Financial Return. Value Creation.
– Rating ratios.
– Stock market ratios.
IV. Case studies.
V. Generation cost of power plants.
VI. Distribution costs.
3. III. ECONOMIC & FINANCIAL ANALYSIS. RATIOS
III. ECONOMIC & FINANCIAL ANALYSIS.RATIOS
4. III. Economic & Financial Analysis. Financial situation
III. Economic & Financial Analysis.Financial situation
5.
III. Economic & Financial Analysis.Financial situation
ELECTRICITY BUSINESS
Fixed assets-84.3%
Equity – 39.7%
Issued capital
Reserves
Permanent
Financing – 84.4%
Long term
Liabilities – 44.6%
Trade payables
Current
Assets - 15.7%
Inventories-2.3%
Receivables-7.9%
Cash – 5.5%
Current tax liab.
Short-term loans
Current
Liabilities – 15.6%
6.
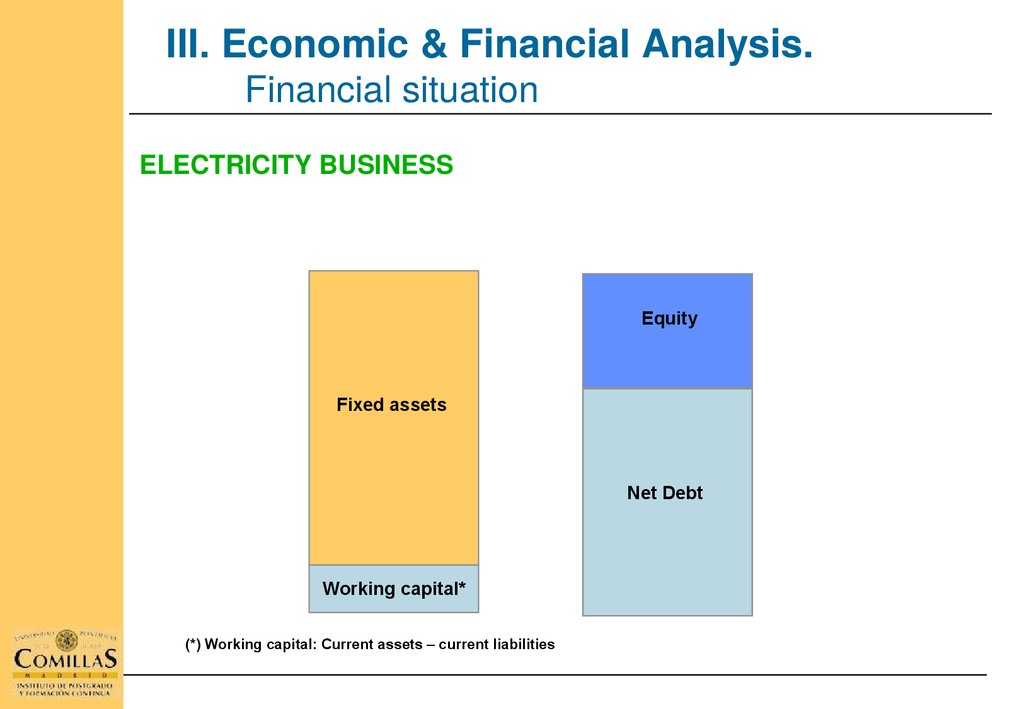
III. Economic & Financial Analysis.Financial situation
ELECTRICITY BUSINESS
Equity
Fixed assets
Net Debt
Working capital*
(*) Working capital: Current assets – current liabilities
7.
III. Economic & Financial Analysis.Working capital
ELECTRICITY BUSINESS
Inventories
Receivables
Cash
Current
Assets
Working capital
Trade payables
Tax liabilities
Short term loans
Current
Liabilities
8.
III. Economic & Financial Analysis.Liquidity
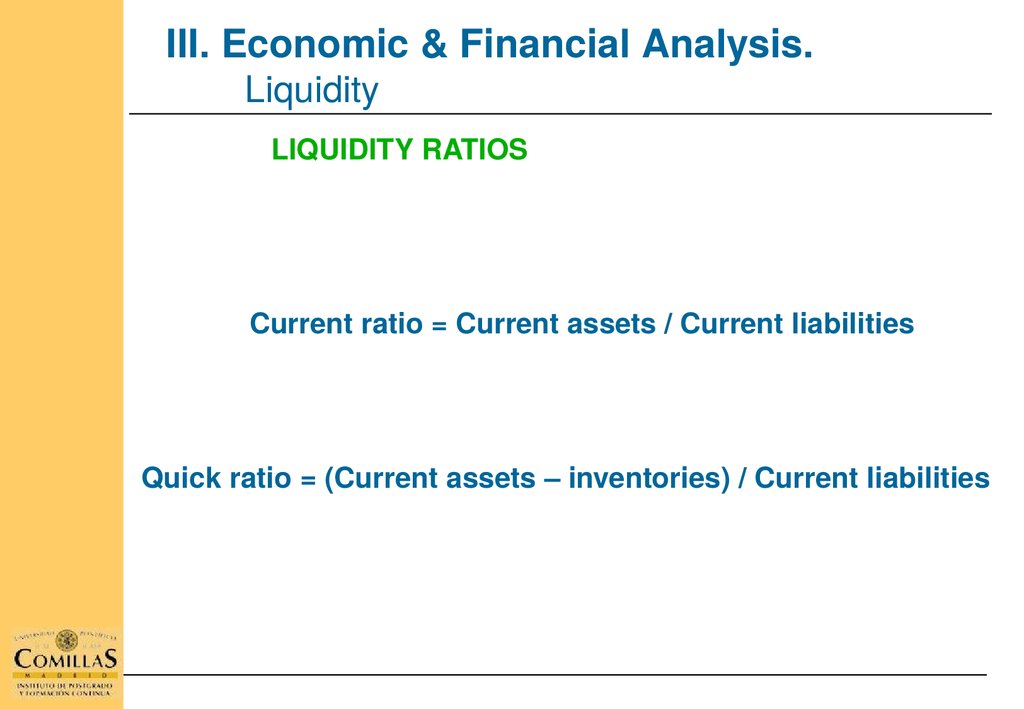
LIQUIDITY RATIOS
Current ratio = Current assets / Current liabilities
Quick ratio = (Current assets – inventories) / Current liabilities
9.
III. Economic & Financial Analysis.Liquidity
LIQUIDITY CHART AT YEAR END 2013
10.
III. Economic & Financial Analysis.Return
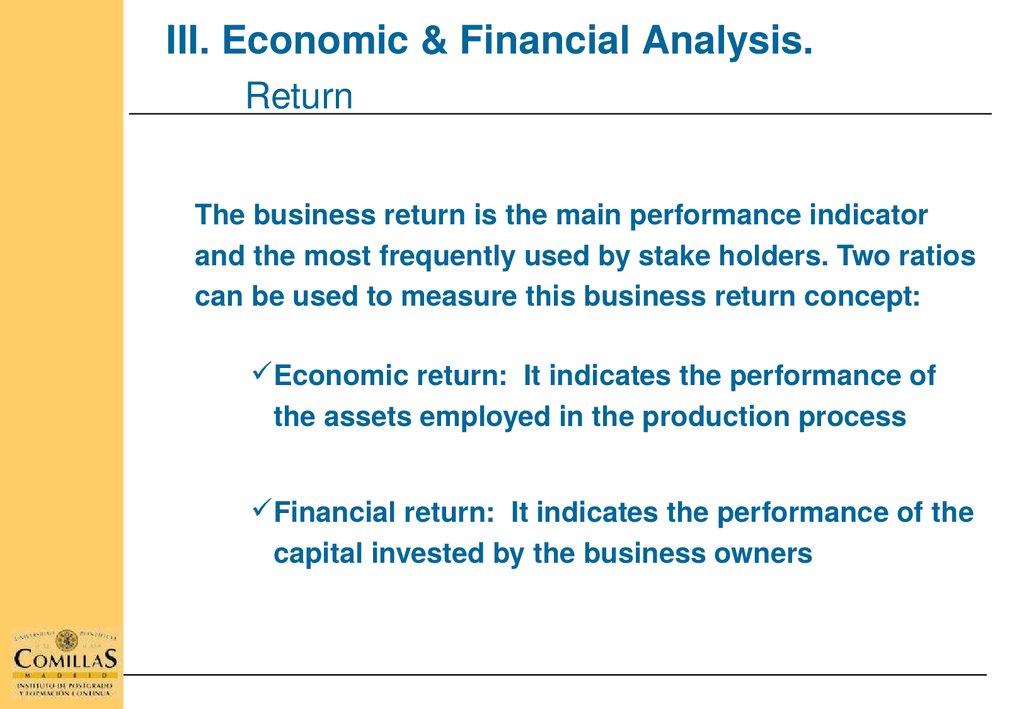
The business return is the main performance indicator
and the most frequently used by stake holders. Two
ratios can be used to measure this business return
concept:
Economic return: It indicates the performance of
the assets employed in the production process
Financial return: It indicates the performance of
the capital invested by the business owners
11.
III. Economic & Financial Analysis.Return
FINANCIAL RETURN
• Relationship between earnings after taxes (net income)
and equity.
• Return indicator to be used by investors company
owners
R.O.E. = Net income / Equity
12.
III. Economic & Financial Analysis.Return
ECONOMIC RETURN
R.O.A = EBIT / Total net assets
R.O.A = EBIT (1t) / Total net assets
EBIT : Earnings before interest and Corporate Tax.
EBIT (1t) EBIT after Corporate Tax
13.
III. Economic & Financial Analysis.Financial leverage
RETURN ON
EQUITY
DEBT
No debt
D/E = 100%
D/E=200%
1,000
1,000
1,000
Investment
Value incr. (ROA)
20%
5%
Debt
1,000
2,000
Debt cost
10%
10%
Profit
200
R.O.E.
20%
50
5%
20%
5%
20%
5%
400100
100100
600200
150200
30%
0%
40%
5%
14.
V. Economic & Financial Analysis.Return
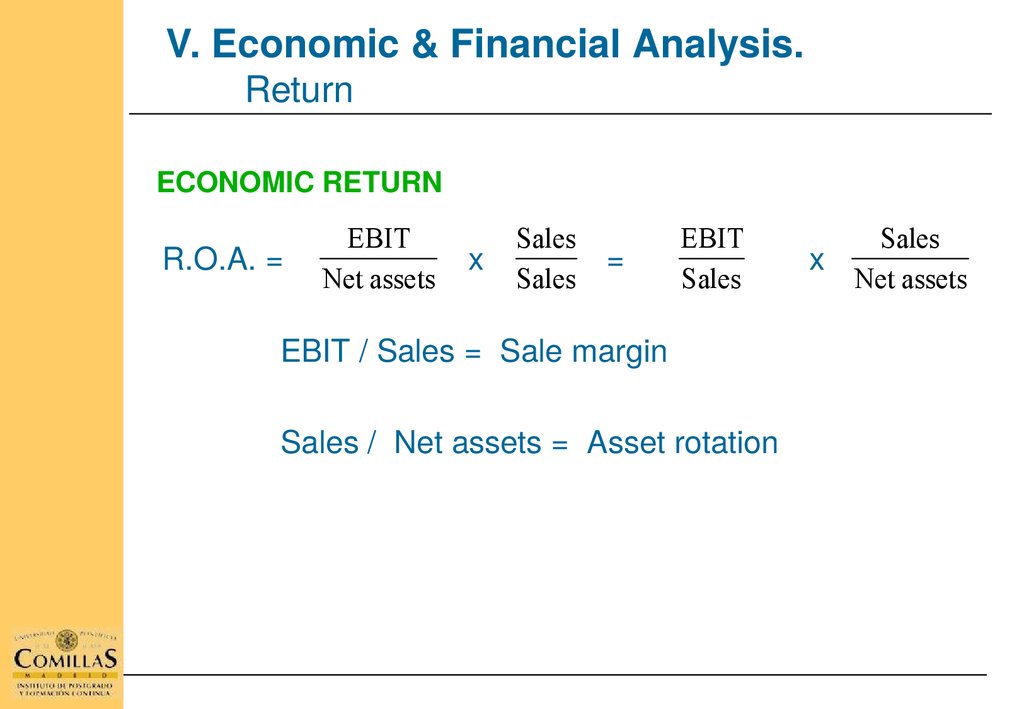
ECONOMIC RETURN
R.O.A. =
EBIT
Sales
EBIT
x = x
Net assets
Sales
Sales
EBIT / Sales = Sale margin
Sales / Net assets = Asset rotation
Sales
Net assets
15.
V. Economic & Financial Analysis.Return
FINANCIAL RETURN AND FINANCIAL LEVERAGE (1)
R.O.E. =
R.O.E
Net income
Equity
Net income
Sales
Net assets
EBIT
R.O.E. = x x x x
R.O.E
Equity
Sales
Net assets
EBIT
EBT
EBT
Sales
EBIT
Net assets
EBT
Net income
R.O.E. = x x x x
R.O.E.
Net assets
Sales
Equity
EBIT
EBT
16.
III. Economic & Financial Analysis.Financial leverage
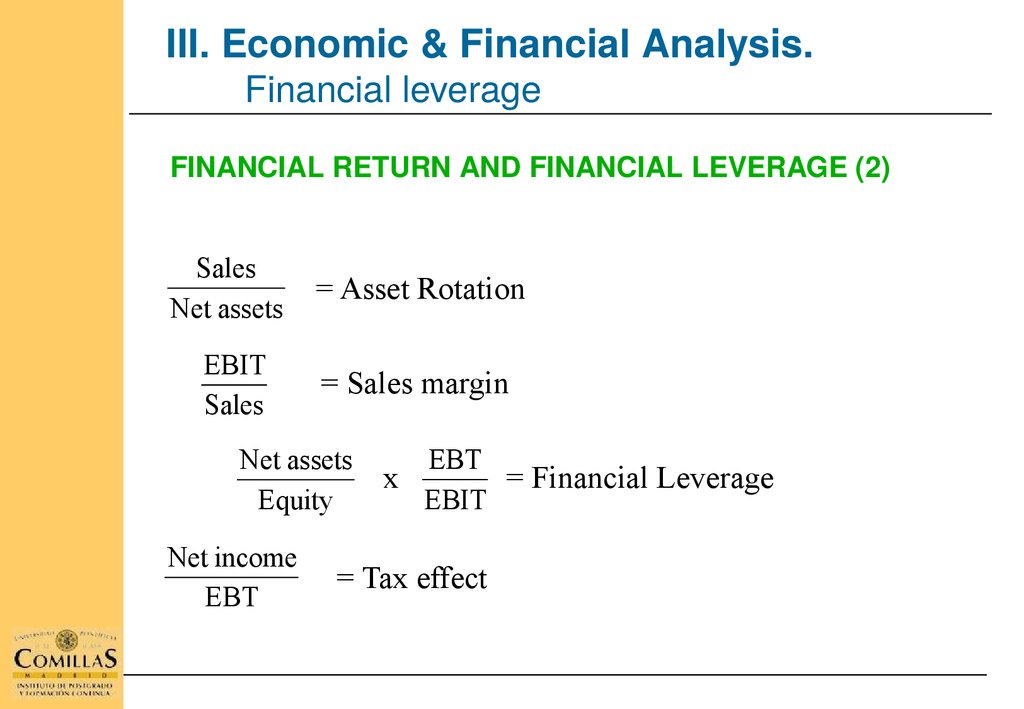
FINANCIAL RETURN AND FINANCIAL LEVERAGE (2)
Sales
Net assets
= Asset Rotation
EBIT
Sales
= Sales margin
Net assets
Equity
Net income
EBT
x
EBT
= Financial Leverage
EBIT
= Tax effect
17.
V. Economic & Financial Analysis.Financial leverage
FINANCIAL RETURN AND FINANCIAL LEVERAGE (3)
• Financial Return (i.e. Equity Return) can be also analysed as a variable
depending on Financial Leverage:
Net assets
Equity
x
EBT
= Financial Leverage
EBIT
ROE = ROA x Financial Leverage x Tax Effect
• When is there a positive financial leverage?
• What are the consequences of a positive financial leverage on investment
decision making?
18.
V. Economic & Financial Analysis.Return
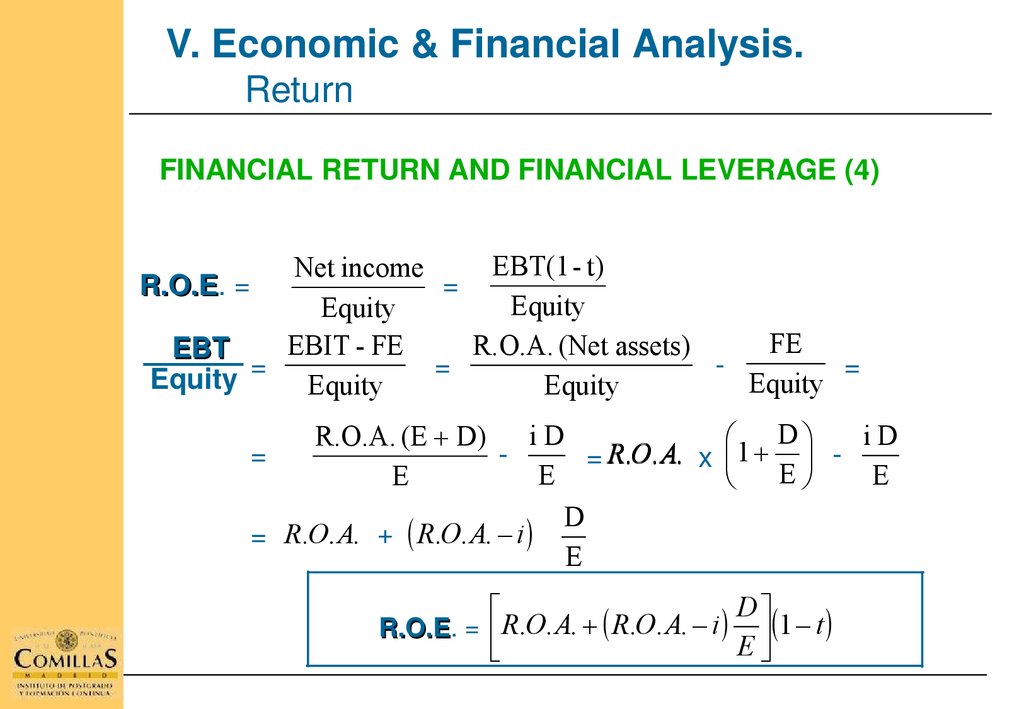
FINANCIAL RETURN AND FINANCIAL LEVERAGE (4)
EBT(1 - t)
Net income
R.O.E. = =
R.O.E
Equity
Equity
FE
EBIT - FE
R.O.A. (Net assets)
EBT
EBT
=
=
Equity = Equity
Equity
Equity
D
iD
iD
R.O.A. (E D)
1
=
= R.O. A. x
E
E
E
E
D
= R.O. A. + R.O. A. i
E
D
1 t
R
.
O
.
A
.
R
.
O
.
A
.
i
R.O.E. =
R.O.E
E
19. FINANCIAL ANALYSIS OF THE ELECTRICITY INDUSTRY. Contents
FINANCIAL ANALYSIS OF THE ELECTRICITYINDUSTRY. Contents
I. Cost structure of the Electricity Business.
II. Capital Cost Analysis.
III. Economic and Financial Analysis. Ratios.
– Assessing operating performance. Value Creation.
– Stock market ratios.
– Rating ratios.
IV. Case studies.
V. Generation cost for different kinds of power plants.
VI. Distribution costs.
20. III. ECONOMIC & FINANCIAL ANALYSIS. STOCK MARKET RATIOS
III. ECONOMIC & FINANCIAL ANALYSIS.STOCK MARKET RATIOS
21.
III. Economic & Financial Analysis.Stock Market Ratios
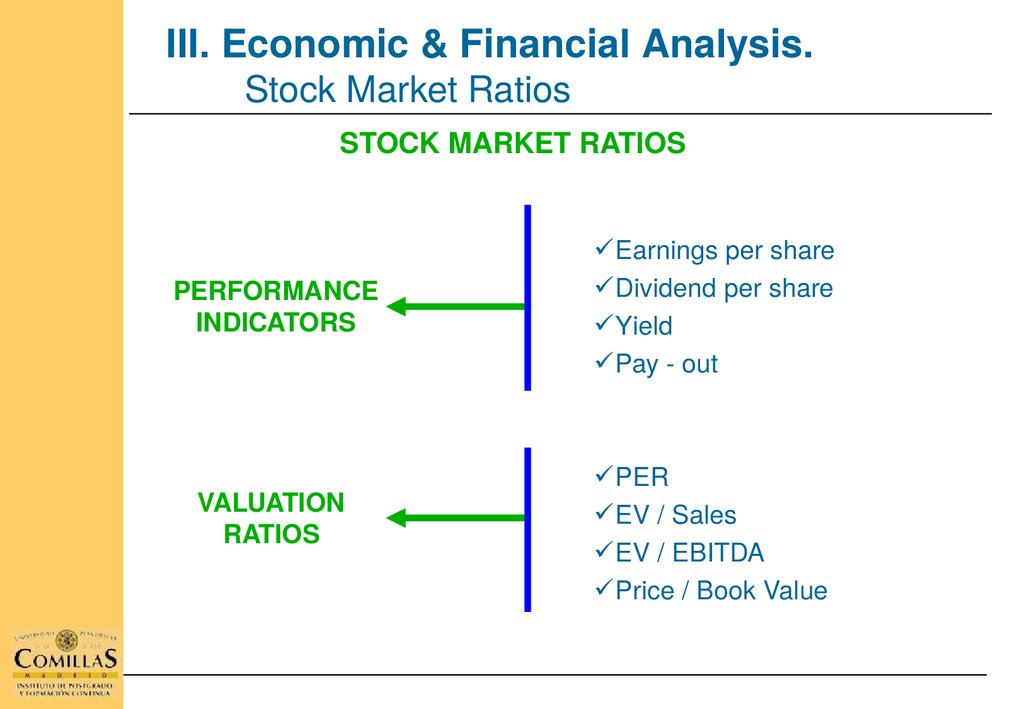
STOCK MARKET RATIOS
PERFORMANCE
INDICATORS
VALUATION
RATIOS
Earnings per share
Dividend per share
Yield
Pay out
PER
EV / Sales
EV / EBITDA
Price / Book Value
22. STOCK MARKET RATIOS: Earnings per share
V. Economic & Financial Analysis.Operating Ratios
STOCK MARKET RATIOS: Earnings per share
Earnings = Net income
Net income ENEL(1) =
Nº shares ENEL
3,032 €m.
=
9,403.4 millions
EPS = 0.32 €
(1) Analyst’s adjusted net income
23. STOCK EXCHANGE RATIOS : Dividend per share
V. Economic & Financial Analysis.Operating Ratios
STOCK EXCHANGE RATIOS : Dividend per share
Dividend = Distributed income
Dividends ENEL =
Nº of shares ENEL =
1,506 €m
9,403.4 millions
Dividend per share (DPS) = 0.16 €
24. STOCK EXCHANGE RATIOS: Pay - out
V. Economic & Financial Analysis.Operating Ratios
STOCK EXCHANGE RATIOS: Pay out
Pay out = Distributed income / Net income
Net income = Profit attributed to owners of the parent company
Distributed income =
Net income ENEL =
1,506 €m
3,032 €m
Pay out = 49.7%
25. STOCK EXCHANGE RATIOS: Price Earning Ratio (PER)
V. Economic & Financial AnalysisValuation ratios
STOCK EXCHANGE RATIOS: Price Earning Ratio (PER)
Price = Market Capitalisation
Earnings = Net income
Market Capitalisation ENEL
= 39,739 €m
Net income ENEL = 3,032 €m
PER ENEL
= 13.1 x
Average PER Energy Utilities
= 13.9 x (Analyst)
Price
= Average PER X Net income ENEL
Estimated Equity Value
= 42,145 €m
Estimated Price
= 4.5 € (Actual Price 4.23)
26. P.E.R. and E.P.S. Growth expectations
V. Economic & Financial AnalysisValuation ratios
P.E.R. and E.P.S. Growth expectations
27. STOCK EXCHANGE RATIOS: EV / EBITDA
V. Economic & Financial AnalysisValuation ratios
STOCK EXCHANGE RATIOS: EV / EBITDA
Enterprise Value = Market Cap. + Net Debt + Provisions + Other liabilities
EBITDA = Earnings before interests taxes depreciation & amortization
Enterprise Value = Average Ratio x EBITDA IBE
EV / EBITDA ENEL
EBITDA ENEL
Average EV / EBITDA
= 6.4 x
= 15,018 €m.
= 8.0 x
Estimated Enterprise Value = 120,144 €m.
() Net Debt ENEL
= 38,983 €m.
() Provisions & other liab. = 25,000 €m
= Estimated Equity Value = 56,161 €m.
= Estimated Price
= 6,0 € (Actual Price 4.23)
28. EV / Ebitda and Ebitda Growth expectations
V. Economic & Financial AnalysisValuation ratios
EV / Ebitda and Ebitda Growth expectations
29. FINANCIAL ANALYSIS OF THE ELECTRICITY INDUSTRY. Contents
FINANCIAL ANALYSIS OF THE ELECTRICITYINDUSTRY. Contents
I.
Cost structure of the Electricity Business.
II. Capital Cost Analysis.
III. Economic and Financial Analysis. Ratios.
– Assessing operating performance. Value Creation.
– Stock market ratios.
– Rating ratios.
IV. Case studies.
V. Generation cost for different kinds of power plants.
VI. Distribution costs.
30.
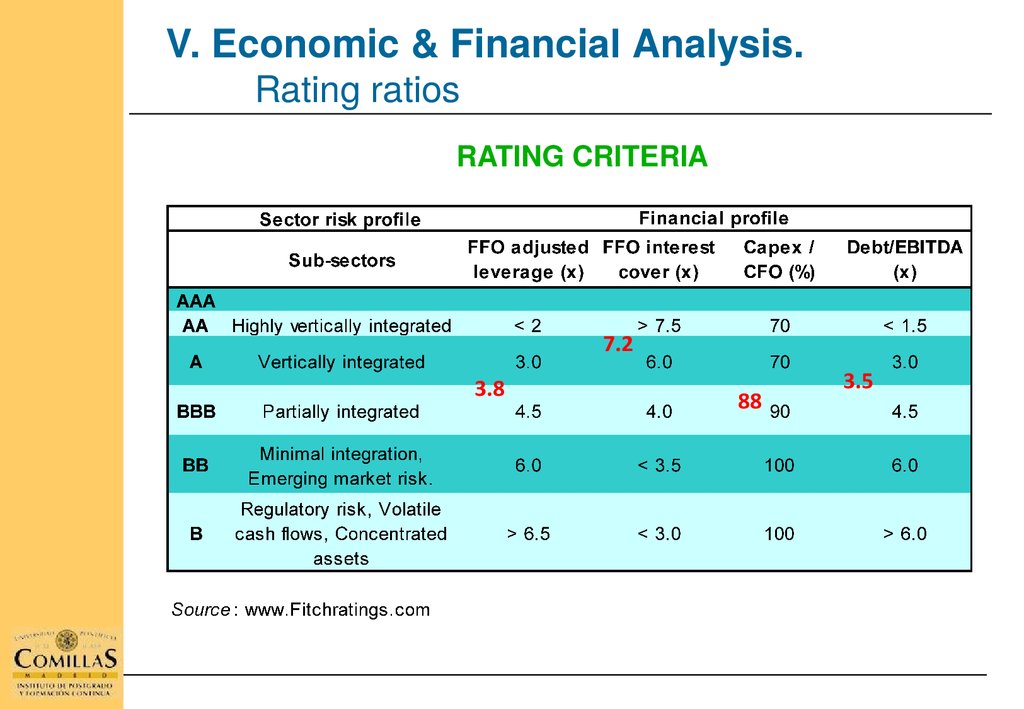
V. Economic & Financial Analysis.Rating ratios
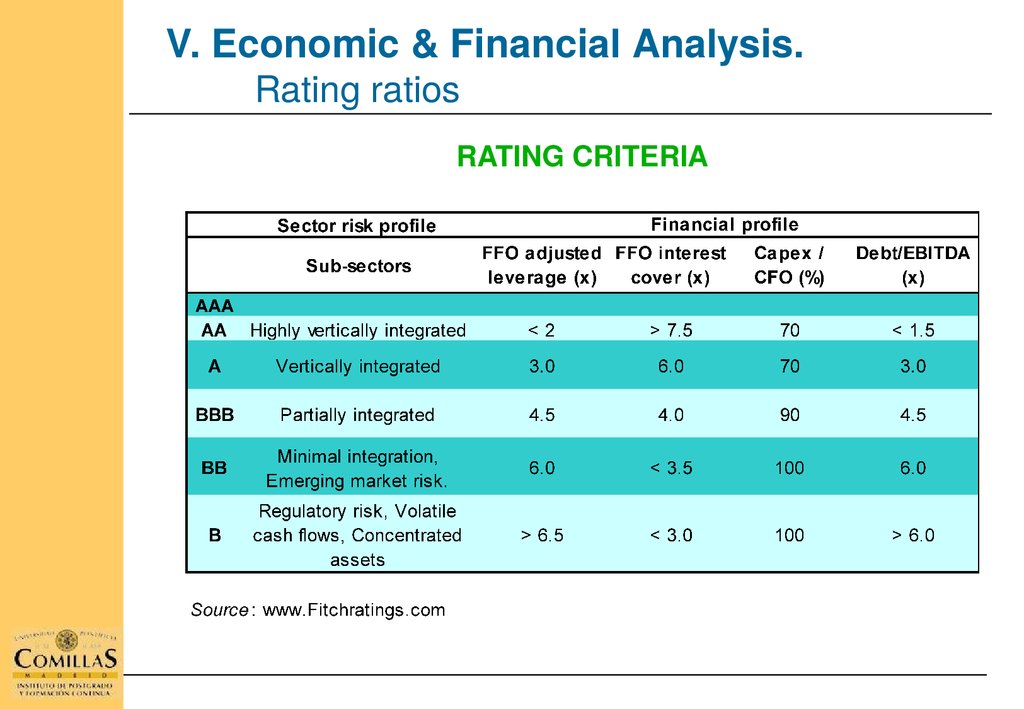
RATING CRITERIA
31.
V. Economic & Financial Analysis.Rating ratios
FFO adjusted leverage (x)
FFO interest cover (x)
Capex / FFO (%)
Debt / Ebitda (x)
FINANCIAL
PROFILE
FFO adjusted leverage =
FFO interest cover =
Capex / FFO
Debt / Ebitda =
=
Adjusted debt
Funds flow from operations
Funds flow from operations
Interest paid - Interest received
Capital expenditure
Funds flow from operations
Adjusted debt
Ebitda
32.
V. Capital cost analysis.Financial needs estimation
33.
V. Economic & Financial Analysis.Rating ratios
Adjusted net debt
FFO adjusted leverage = = 3.8
Funds flow from operations
FFO interest cover =
Capex / FFO
Debt / Ebitda =
Funds flow from operations
= 7.2
Interest paid - Interest received
Capital expenditure
= = 88
Funds flow from operations
Adjusted debt
= 3.5
Ebitda
34.
V. Economic & Financial Analysis.Rating ratios
RATING CRITERIA
3.
8
7.
2
88
3.
5